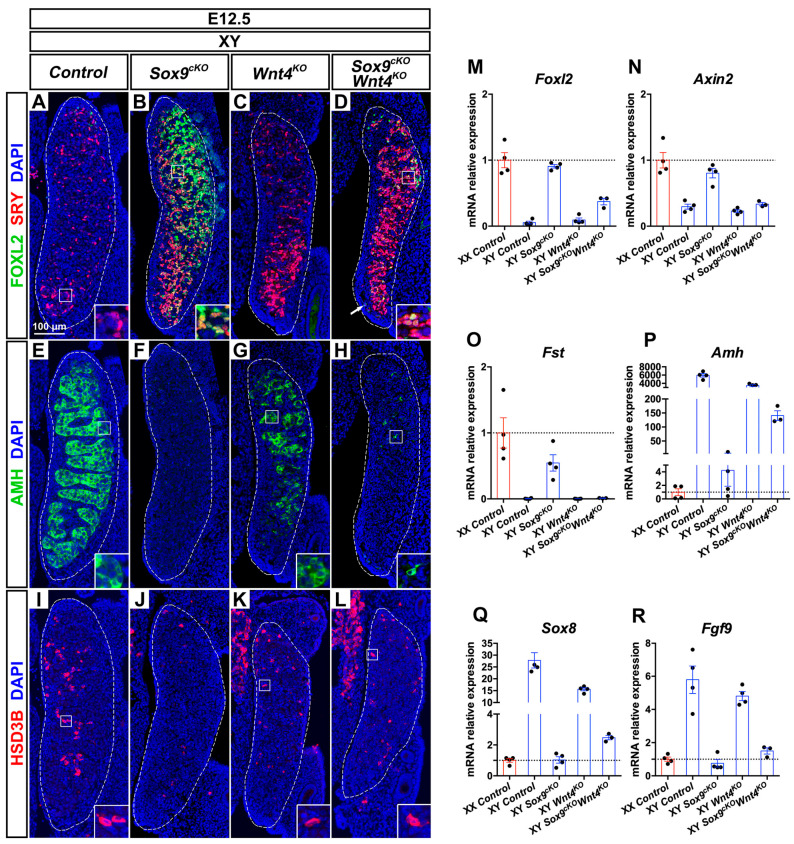
Figure 4.
Phenotypic and gene expression changes in E12.5 XY Sox9; Wnt4 mutants (A–D). Immunodetection of the pre-granulosa cell marker FOXL2 (green) and the male supporting cell marker SRY (red) in E12.5 XY gonads of Control (A), Sox9cKO (B), Wnt4KO (C), and Sox9cKO Wnt4KO (D) genotypes. (E–H) Immunodetection of the Sertoli cell marker AMH (green) in E12.5 XY gonads of Control (E), Sox9cKO (F), Wnt4KO (G), and Sox9cKO Wnt4KO (H) genotypes. (I–L) Immunodetection of the steroidogenic enzyme HSD3B (red) in E12.5 XY gonads of Control (I), Sox9cKO (J), Wnt4KO (K), and Sox9cKO Wnt4KO (L) genotypes. (M–R) RT-quantitative PCR analysis of Foxl2 (M), Axin2 (N), Follistatin (Fst) (O), Amh (P), Sox8 (Q), and Fgf9 (R) expression in E12.5 gonads of XX Control, XY Control, XY Sox9cKO, XY Wnt4KO, and XY Sox9cKO Wnt4KO genotypes (N = 3–4 embryos for each genotype). Expression level in XX controls is 1. Graphs show individual values (dots), and the mean fold-change (bars) ± SEM. Nuclei labeled with DAPI are shown in blue. Magnification is the same in all panels. Scale bar = 100 μm. Gonads are outlined with broken white lines. The white arrow in D indicates the coelomic vessel.

