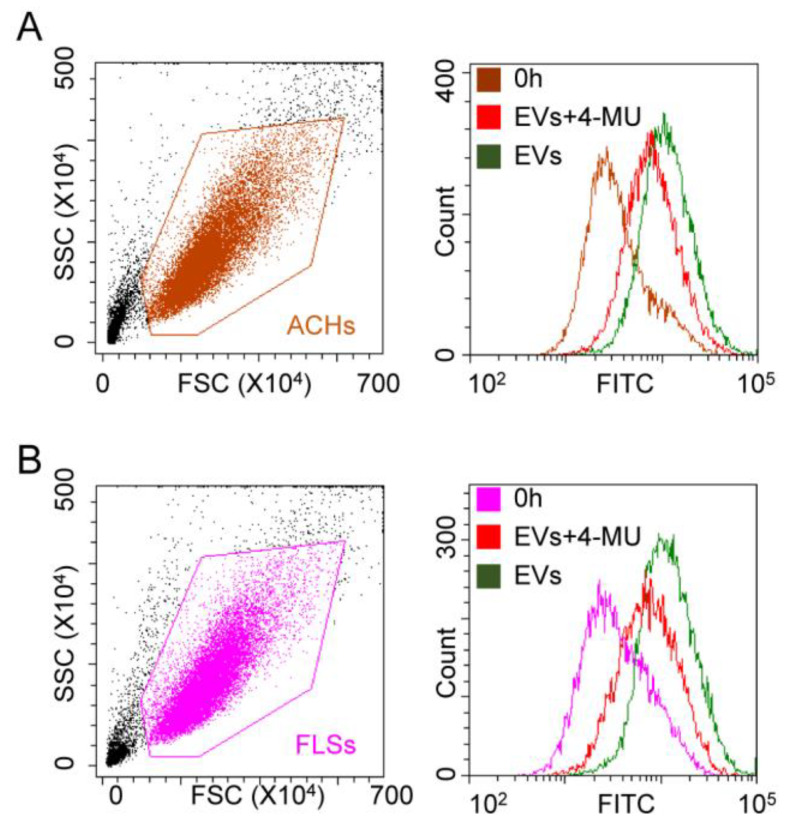
Figure 6.
HA removal effect on ASC-EV interaction with ACHs and FLSs in 2D. (A,B) Cytograms showing fluorescence at time 0 and after 24 h for both ACHs and FLSs incubated with ASC-EVs, in presence and absence of HA-synthesis inhibitor 4-MU. HA removal reduces fluorescence increase at 24 h. 4-MU treated samples at time 0 are not shown for clarity, since no differences with control samples at time 0 emerged. One representative donor is shown.

