Abstract
Background
A comprehensive investigation of ubiquitin-conjugating enzyme E2I (UBE2I) in cancer is still insufficiency. In this study, we aimed to analyze its role and mechanism in cancer by combination of bioinformatic analysis and experimental validation.
Methods
The expression profile of UBE2I in human cancers were obtained using GEPIA. Kaplan–Meier plotter was used to assess the prognostic values of UBE2I in diverse types of cancer. ROC curve analysis was employed to determine the diagnostic role of UBE2I in hepatocellular carcinoma (HCC). The expression differences based on various clinicopathological features was evaluated by UALCAN. Wound healing assay and transwell invasion assay were used to detected the effects of UBE2I on migration and invasion of HCC cells, respectively. The miRNA regulatory mechanism of UBE2I was successively investigated by binding prediction, expression analysis, survival analysis and dual-luciferase reporter assay. The correlation of UBE2I mRNA expression and UBE2I promoter methylation level was assessed using cBioPortal. STRING was finally introduced to perform co-expression analysis and enrichment analysis for UBE2I.
Results
UBE2I was upregulated in HCC, correlated with cancer progression and poor prognosis of HCC. We also found a significant diagnostic value of UBE2I in HCC. Functional experiments revealed that knockdown of UBE2I significantly inhibited HCC migration and invasion. Further research on mechanism suggested that loss of inhibition of hsa-miR-195-3p and dysregulation of UBE2I promoter methylation might account for UBE2I overexpression in HCC. Analysis of UBE2I-invovled regulatory network identified six key genes (NSMCE2, SAE1, UBA2, RANGAP1, SUMO1 and SUMO2) whose expression linked to poor prognosis in HCC.
Conclusions
In conclusion, UBE2I may be a promising therapeutic target and biomarker in cancer, especially HCC.
Keywords: UBE2I, Hepatocellular carcinoma, Diagnosis, Prognosis, Migration, Invasion, Metastasis, microRNA (miRNA), Protein–protein interaction (PPI)
Background
As is known to all, ubiquitin–proteasome pathway (UPP), consisting of ubiquitin, ubiquitin-activating enzyme (E1), ubiquitin-conjugating enzyme (E2), ubiquitin-ligating enzyme (E3) and proteasome, plays important roles in post-translationally regulating protein expression, thus participating in almost all life activities of eukaryotes [1, 2]. Previous studies have reported that dysregulation of UPP is linked to development of multiple human disorders, such as systemic inflammation [3, 4] and cancer [5–7].
In 1996, Watanabe et al. identified a novel cell cycle-associated gene UBC9, containing an open reading frame of 474 nucleotides encoding 158 amino acids [8]. This gene encodes Ubiquitin-conjugating enzyme E2I (UBE2I), which is a member of E2 enzyme family. UBE2I is a key regulator of body immunity. For example, the team of Wang A indicated that UBI2I was required for positive selection and late-stage maturation of thymocytes [9]. UBE2I is also found to favorably impact cardiac function in compromised hearts by mediating SUMOylation [10]. Moreover, several reports have shown that abnormal expression of UBE2I results in occurrence and progression of multiple human cancers, including breast cancer [11, 12], glioma [13, 14], lung cancer [15], head and neck squamous cell carcinoma [16], osteosarcoma [17] and hepatocellular carcinoma [18].
However, to date, a comprehensive analysis of UBE2I in human cancers remains absent. Elucidation of UBE2I expression, function and mechanism in human cancers may provide an effective therapeutic target and a promising biomarker for diagnosing or predicting prognosis of cancer patients. In the study, expression profile of UBE2I in 33 various cancers was first analyzed using data from the Cancer Genome Atlas (TCGA) and the Genotype-Tissue Expression (GTEx) projects. Then, HCC was selected as the studied cancer of interest by combination of the various stage expression analysis and survival analysis of UBE2I. Further investigation revealed that UBE2I expression correlated with progression of HCC. Moreover, ROC curve analysis showed a significant diagnostic value of UBE2I for HCC patients. Then, two potential dysregulated mechanisms of UBE2I in HCC were explored. We also identified several positively correlated genes that are involved in UBE2I-associated modulatory network. Finally, survival analysis and enrichment analysis for these genes were performed.
Materials and methods
GEPIA database analysis
GEPIA, a newly developed interactive web server for analyzing the RNA sequencing data of 9736 tumor samples and 8587 normal samples from the TCGA and GTEx projects, provides a variety of functions, including tumor/normal differential expression analysis, profiling according to cancer types or pathological stages and correlation analysis [19]. In this study, GEPIA database was first employed to analyze UBE2I expression profiling in 33 different cancer types and determine expression differences of UBE2I among various major stages in cancers. Moreover, GEPIA database was also introduced to assess the expression relationships between two genes in HCC. P value < 0.05 was considered as statistically significant.
Kaplan–Meier plotter analysis
The prognostic values of UBE2I in kidney renal clear cell carcinoma (KIRC), liver hepatocellular carcinoma (LIHC, HCC) and stomach adenocarcinoma (STAD) were evaluated using Kaplan–Meier plotter as previously described [20, 21]. Briefly, UBE2I was first entered into the database. Subsequently, Kaplan–Meier survival plots were automatically generated, and statistical analytic results, including hazards ratio (HR), 95% confidence interval (CI) and logrank P-value, were presented on the webpage. This database was also used to perform survival analysis of miRNAs and other genes in HCC. Logrank P-value < 0.05 was considered as statistically significant.
Oncomine database analysis
Oncomine database is a cancer microarray database and integrated data-mining platform [22]. Oncomine database was utilized to analyze UBE2I expression in HCC. P-value < 0.05, |fold change (FC)| > 1.5 and gene rank in the top 10% were set as the thresholds for choosing datasets of interest.
UALCAN database analysis
UALCAN, an online web server for facilitating tumor subgroup gene expression and survival analyses based on the TCGA data, was used to detect expression levels of UBE2I according to several different clinicopathological features, containing nodal metastasis, individual cancer stage and tumor grade [23]. P-value < 0.05 was considered as statistically significant.
ROC curve analysis
The diagnostic role of UBE2I in HCC was assessed by receptor operating characteristic (ROC) curve analysis based on TCGA normal liver samples and HCC samples. P-value < 0.05 was considered as statistically significant.
miRNet database analysis
The potential miRNAs binding to UBE2I were predicted through miRNet, which is a comprehensive database and analytic platform to explore miRNA-target interactions and functional associations by network-based visual analysis [24, 25]. The miRNA-UBE2I interactions were re-entered into Cytoscape software (Version 3.6.0) to establish miRNA-UBE2I regulatory network.
starBase database analysis
The expression levels of potential miRNAs in HCC were determined by starBase database, which is a web server for decoding miRNA-mRNA interaction maps from large-scale CLIP-Seq data [26, 27]. starBase database was also employed to evaluate the expression correlation of miRNA and UBE2I in HCC. P-value < 0.05 was considered as statistically significant.
cBioPortal database analysis
cBioPortal is a database used to explore, visualize and analyze multidimensional cancer genomics data [28]. cBioPortal was utilized to assess the association between UBE2I promoter methylation level and UBE2I mRNA expression in HCC. P-value < 0.05 was considered as statistically significant.
STRING database analysis
STRING database (https://string-db.org/) was introduced to probe the UBE2I-involved protein–protein interaction (PPI) network. The PPI network was directly downloaded from the webpage. Only these interactions with score ≥ 0.4 were included. Gene Ontology (GO) functional annotation and pathway enrichment analysis were also performed by this database.
Cell lines and cell culture
Two human HCC cell lines, HepG2 and Bel7402, were purchased from the Institute of Biochemistry and Cell Biology of the Chinese Academy of Sciences (Shanghai, China). These cells were maintained in Dulbecco’s modified Eagle’s medium (DMEM; Gibco) supplemented with 10% fetal bovine serum (FBS; Biological Industries) under a humidified atmosphere of 5% CO2 at 37 °C.
Cell transfection
Small interfering RNA (siRNA) targeting UBE2I (si-UBE2I) and negative control (NC) siRNA (si-NC) were designed and synthesized by Guangzhou Ribobio Co. Ltd. (Guangzhou, China). miR-195-3p mimic and mimic negative control (mimic-NC) were also obtained from Guangzhou Ribobio Co. Ltd. (Guangzhou, China). Cells were seeded into six-well plates, after which transfection was introduced by Lipofectamine™ 3000 (Invitrogen, Shanghai, China) according to the manufacturer’s instruction.
RNA isolation and qPCR
RNA isolation and qPCR were performed as previously described [29, 30].
Wound healing assay
Firstly, pre-transfected cells were plated into six-well plates. After these cells were grown to 100% confluence, a micropipette tip was used to make a cross wound. Subsequently, photographs were taken using at 0 h and 24 h post-transfection.
Transwell assay
Transwell invasion assay was employed to determine the invaded ability of HCC cells. Firstly, transwell inserts (Corning, USA) were coated with Matrigel (BD Bioscience, USA). Subsequently, 50,000 cells were suspended into 0.2 mL serum-free medium and then added into the pre-coated inserts. 0.6 mL medium containing 10% FBS were added to the lower compartment. After culturing for 48 h at 37 °C, the cells on the super surface of the membrane were removed using a cotton swab and the cells on the lower surface of the membrane were successively fixed with 10% methanol and stained with 0.1% crystal violet. Finally, five fields of each insert were randomly selected through a microscopy.
Dual-luciferase reporter assay
The 3′-UTR fragments of UBE2I containing the wild-type or mut-type miR-195-3p-binding site were constructed and cloned into psi-CHECK2 luciferase reporter vector (Promega, USA). HepG2 cells were co-transfected with luciferase plasmids and miR-195-3p mimics. 48 h post-transfection, luciferase activity was measured with the Dual-Luciferase Reporter Assay System (Promega, USA) and firefly luciferase activity was normalized to Renilla luciferase activity.
Statistical analysis
The statistical analysis of in silico analyses has been performed by the online bioinformatic tools as mentioned above. The diagnostic value of UBE2I in HCC was determined by ROC curve analysis using GraphPad Prism software (Version 7). Differences between two groups of data and statistical significance were analyzed by Students’ t-test. P-value < 0.05 was considered to indicate a statistically significant difference.
Results
Expression profile and prognostic values of UBE2I in human cancers
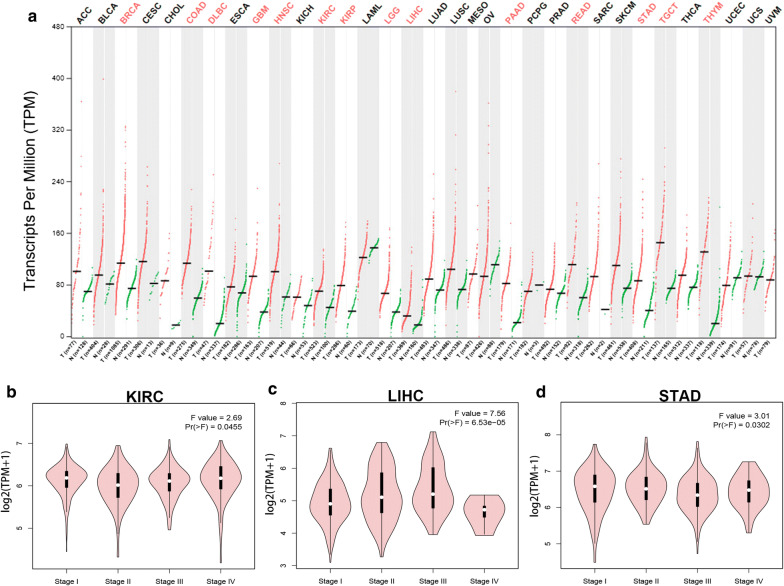
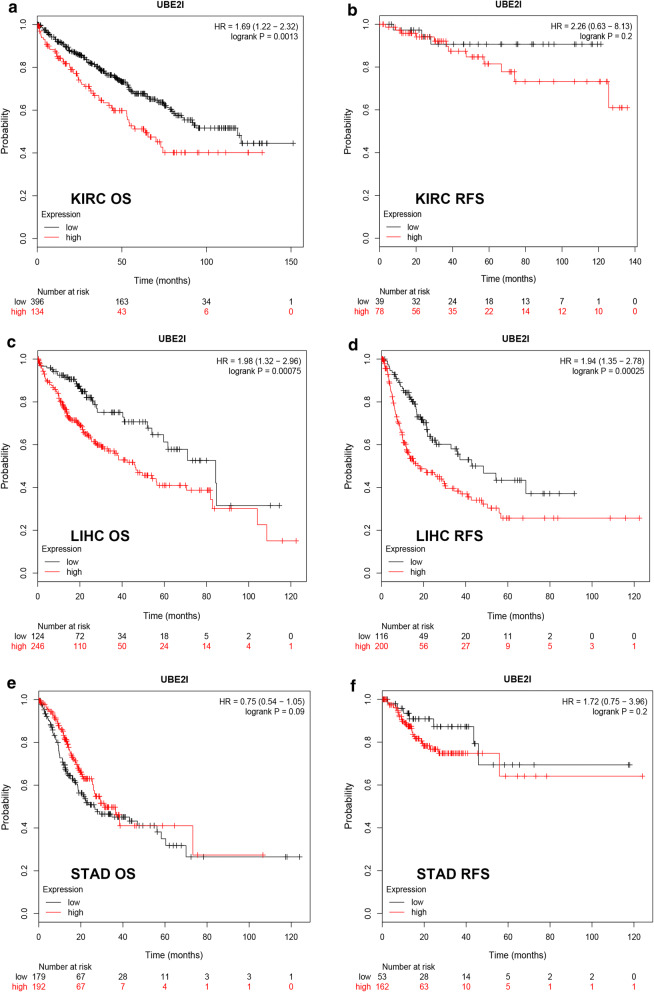
The data from GTEx data and TCGA normal tissues and cancer tissues revealed that UBE2I was markedly overexpressed in 13 types of cancer (BRCA, COAD, DLBC, GBM, HNSC, KIRC, KIRP, LGG, LIHC, PAAD, READ, STAD, TGCT and THYM) when compared with corresponding normal controls (Fig. 1a). Next, we determined the expression differences of UBE2I among various major stages in the 13 human cancers using GEPIA database. The results demonstrated that expression of UBE2I among different major stages presented statistically difference only in 3 cancer types, containing KIRC (Fig. 1b), LIHC (Fig. 1c) and STAD (Fig. 1d). Therefore, KIRC, LIHC and STAD were selected as cancer candidates for further investigation. Subsequently, we performed survival analysis of UBE2I in KIRC, LIHC and STAD using Kaplan–Meier plotter database. Two prognostic indices, overall survival (OS) and relapse free survival (RFS), were included. As shown in Fig. 2a, high expression of UBE2I was significantly associated with unfavorable OS of KIRC. No significant association of UBE2I expression and RFS of KIRC was observed (Fig. 2b). As presented in Fig. 2c, d, LIHC patients with higher expression had poorer OS and RFS, respectively. For STAD, UBE2I expression was not significantly correlated with patients’ OS and RFS as shown in Fig. 2e, f, respectively. The results from expression analysis and survival analysis together suggest that LIHC may be the most suitable cancer type for UBE2I study.
Fig. 1.
Expression of UBE2I in human cancers determined by GEPIA database. a The expression profile of UBE2I in 33 human cancers. b The expression difference of UBE2I among various major stage of KIRC. c The expression difference of UBE2I among various major stage of LIHC. d The expression difference of UBE2I among various major stage of STAD
Fig. 2.
Survival analysis of UBE2I in KIRC, LIHC and STAD determined by Kaplan–Meier plotter database. a The prognostic value (OS) of UBE2I in KIRC. b The prognostic value (RFS) of UBE2I in KIRC. c The prognostic value (OS) of UBE2I in LIHC. d The prognostic value (RFS) of UBE2I in LIHC. e The prognostic value (OS) of UBE2I in STAD. f The prognostic value (RFS) of UBE2I in STAD. Note: OS, overall survival; RFS, relapse free survival. Logrank P-value < 0.05 was considered as statistically significant
Diagnostic role of UBE2I in HCC
In view of the prognostic value of UBE2I in HCC, in this part, we further evaluated the diagnostic role of UBE2I for patients with HCC by performing ROC curve analysis using TCGA normal liver and HCC data. Figure 3 revealed that UBE2C possessed a significant diagnostic ability distinguishing HCC from normal controls, with area under curve (AUC) equal to 0.8351. The current result indicates that UBE2I may be a promising diagnostic biomarker for patients with HCC.
Fig. 3.
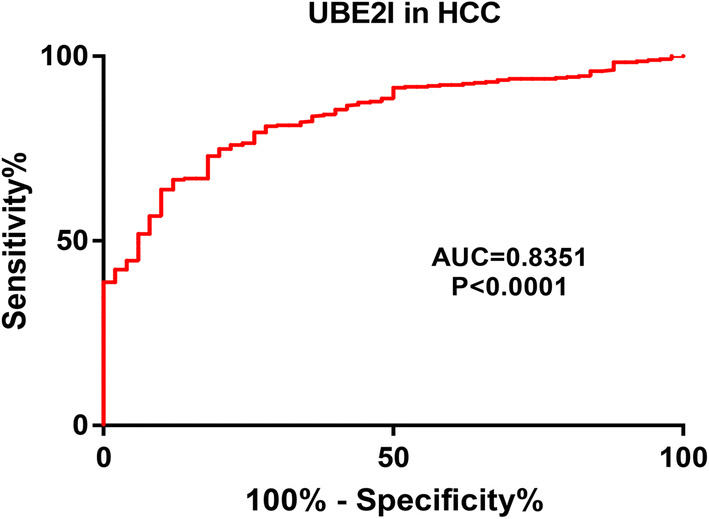
The diagnostic value of UBE2I in HCC based on the TCGA normal liver and HCC data. P-value < 0.05 was considered as statistically significant
UBE2I is highly expressed in HCC and correlates with progression of HCC
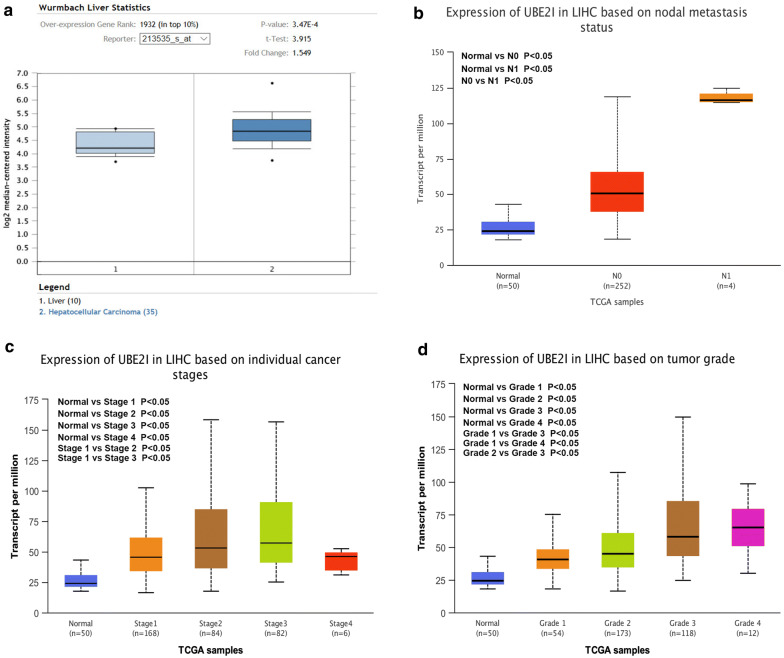
To further validate the high expression of UBE2I in HCC, Oncomine database was employed. As presented in Fig. 4a, we also found that UBE2I was obviously overexpressed in HCC tissues when compared with normal liver tissues. Moreover, the analytic result from UALCAN database demonstrated that HCC patients with nodal metastasis had statistically higher expression of UBE2I than that in HCC patients without nodal metastasis (Fig. 4b). As shown in Fig. 4c, d, UBE2I expression was upregulated in advanced stage HCC and poorly differentiated grade HCC compared with early stage HCC and well differentiated grade HCC in general, respectively. Moreover, UBE2I protein expression level was also increased in HCC cancer tissue when compared with normal tissue (Fig. 4e). All these findings further confirm that UBE2I is highly expressed in HCC and correlates with HCC progression.
Fig. 4.
UBE2I expression in HCC based on nodal metastasis status, individual cancer stage or tumor grade. a The expression level of UBE2I in HCC samples compared with normal liver samples determined by Oncomine database. b UBE2I expression in HCC based on nodal metastasis status. c UBE2I expression in HCC based on individual cancer stage. d UBE2I expression in HCC based on tumor grade. e UBE2I protein expression levels in HCC cancer tissue and normal tissue were analyzed using immunohistochemical staining from HumanProteinAtlas database. P-value < 0.05 was considered as statistically significant
Knockdown of UBE2I inhibits HCC invasion and migration
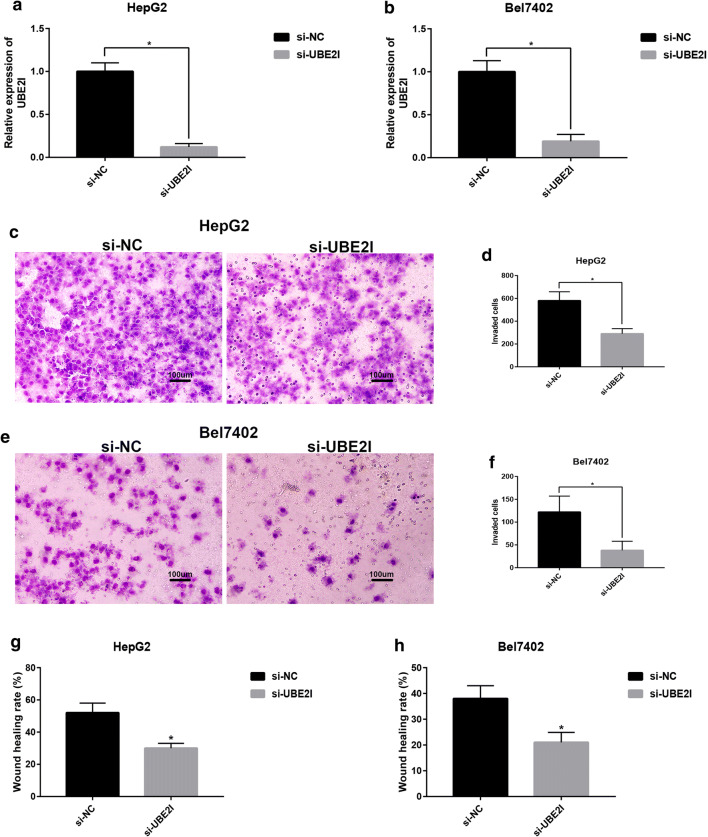
As UBE2I expression linked to nodal metastasis, advanced clinical stage, high tumor grade and poor prognosis, we supposed that UBE2I might be involved in regulation of HCC metastasis. In this part, transwell invasion assay and wound healing migration assay were performed. As shown in Fig. 5a and b, treatment of si-UBE2I in HepG2 and Bel7402 cells, the UBE2I expression was significantly decreased. Figure 5c, d revealed that knockdown of UBE2I marked reduced the invaded ability of HepG2. The similar result was also observed in LM3 as presented in Fig. 5e and f. Moreover, HepG2 and LM3 cell migration was significantly inhibited in si-UBE2I-treated groups compared with si-NC-treated groups. Taken together, UBE2I may be one HCC metastasis promoting molecule.
Fig. 5.
Knockdown of UBE2I inhibited invasion and migration of HCC cells. a The knockdown effect of si-UBE2I in HepG2 cells. b The knockdown effect of si-UBE2I in Bel7402 cells. c Treatment of si-UBE2I significantly suppressed HepG2 invasion. d The quantitative analysis of the effect of si-UBE2I on HepG2 invasion. e Treatment of si-UBE2I significantly suppressed Bel7402 invasion. f The quantitative analysis of the effect of si-UBE2I on Bel7402 invasion. g Treatment of si-UBE2I significantly suppressed HepG2 migration. h Treatment of si-UBE2I significantly suppressed Bel7402 migration. Bar scale: 100 um. P-value < 0.05 was considered as statistically significant
The upstream mechanisms of UBE2I in HCC
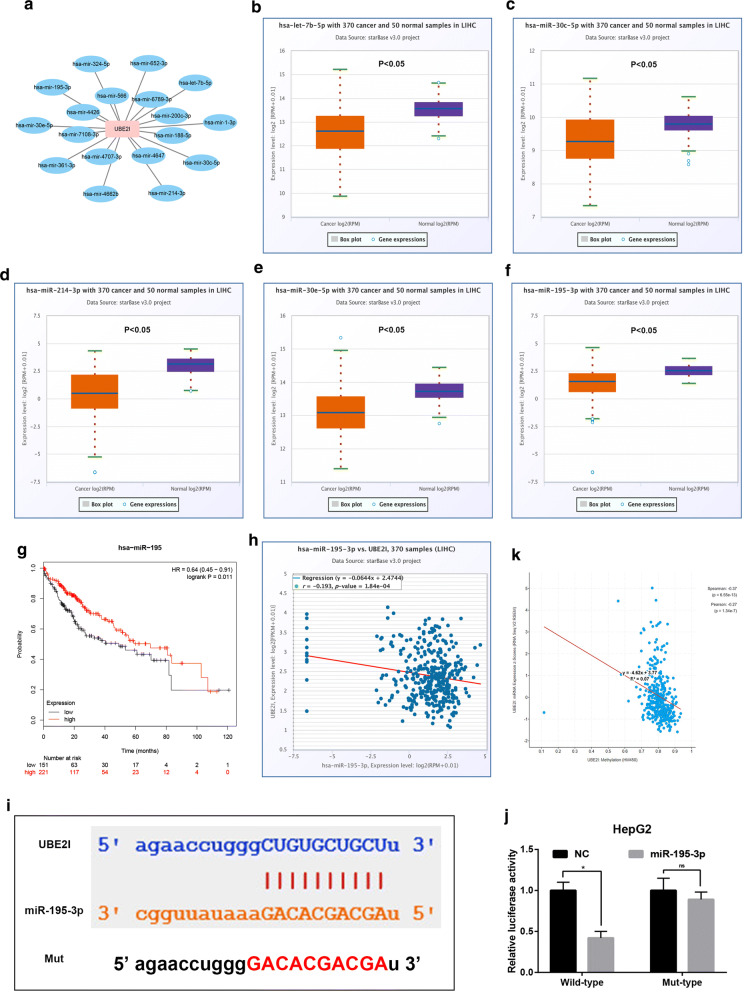
MiRNAs are found to play important roles in cancer development and progression, mainly by targeting gene expression. Thus, we predicted the upstream binding miRNAs of UBE2I using miRNet database. As shown in Fig. 6a, 18 miRNAs were forecasted to potentially bind to UBE2I. Based on the action mechanism of miRNAs and the oncogenic role of UBE2I in HCC, the potential regulatory miRNAs of UBE2I should be tumor suppressive miRNAs in HCC. By expression analysis, we found that only hsa-let-7b-5p (Fig. 6b), hsa-miR-30c-5p (Fig. 6c), hsa-miR-214-3p (Fig. 6d), hsa-miR-30e-5p (Fig. 6e) and hsa-miR-195-3p (Fig. 6f) were significantly downregulated in HCC samples when compared with normal liver samples. Next, survival analysis for the 5 miRNAs revealed that only high expression of hsa-miR-195-3p indicated favorable prognosis of HCC as presented in Fig. 6g. Moreover, hsa-miR-195-3p expression was significantly inversely linked to UBE2I expression in HCC determined by starBase database (Fig. 6h). Figure 6i showed the potential binding sites of miR-195-3p and UBE2I. Dual-luciferase reporter assay suggested that miR-195-3p could directly bind to UBE2I (Fig. 6j). Altogether, hsa-miR-195-3p might be a critical negative modulator of UBE2I in HCC. Gene promoter methylation deregulation may cause silence or activation of tumor suppressors or oncogenes, thereby resulting in development of human cancers, including HCC. In this work, we wanted to ascertain if dysregulation of UBE2I promoter methylation is associated with UBE2I overexpression in HCC. The result from Fig. 6k demonstrated that promoter methylation level of UBE2I was significantly negatively correlated with UBE2I mRNA expression.
Fig. 6.
The dysregulated mechanisms of UBE2I in HCC. a The potential miRNAs-UBE2I regulatory network established by Cytoscape software (Version 3.6.0). b The expression level of hsa-let-7b-5p in HCC determined by starBase database. c The expression level of hsa-miR-30c-5p in HCC determined by starBase database. d The expression level of hsa-miR-214-3p in HCC determined by starBase database. e The expression level of hsa-miR-30e-5p in HCC determined by starBase database. f The expression level of hsa-miR-195-3p in HCC determined by starBase database. P-value < 0.05 was considered as statistically significant. g The prognostic value of has-miR-195-3p in HCC determined by Kaplan–Meier plotter. Logrank P-value < 0.05 was considered as statistically significant. h The expression correlation between UBE2I and hsa-miR-195-3p in HCC determined by starBase database. i The relationship between UBE2I promoter methylation level and UBE2I mRNA expression in HCC determined by cBioPortal database. j The binding sites of has-miR-193-5p and UBE2I was predicted by starBase and the mutant binding sequences for miR-193-5p in the 3′-UTR of UBE2I were also shown. k Luciferase activity was detected in HepG2 by co-transfected with a reporter plasmid carrying the wild-type or mut-type UBE2I 3′-UTR and either the miR-195-3p mimics or miR-NC. P-value < 0.05 was considered as statistically significant. “ns” represented no significant
UBE2I-involved PPI network
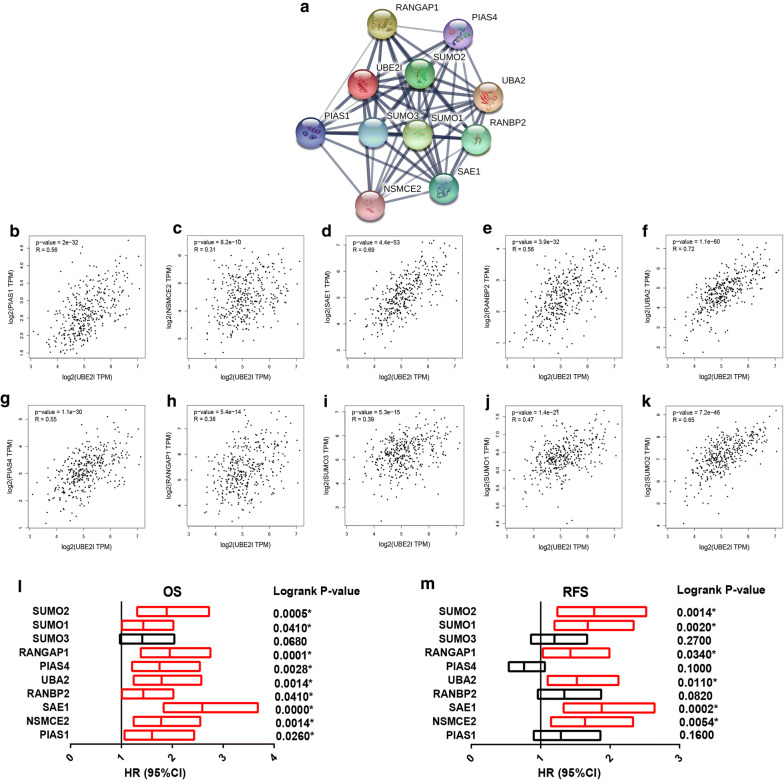
To better understand the molecular action mechanism of UBE2I, we constructed a UBE2I-involved PPI network using STRING database as shown in Fig. 7a. Three GO categories, containing biological process (BP), molecular function (MF) and cellular component (CC), were included for GO functional annotation. As listed in Table 1, the top 5 enriched GO items included protein sumoylation, positive regulation of protein sumoylation in the BP category; SUMO transferase activity, small protein activating enzyme binding and enzyme binding in the MF category; and PML body, SUMO activating enzyme complex and nuclear part in the CC category. For pathway enrichment, KEGG’s cell signaling pathway and Reactome’s cell signaling pathway were analyzed. Table 2 suggested that the proteins from UBE2I-invovled PPI network significantly enriched in ubiquitin mediated proteolysis and SUMOylation pathways. Besides, we also assessed the mRNA expression correlation of UBE2I and individual protein-coding gene from UBE2I-involved PPI network using GEPIA database. The result revealed that UBE2I expression was statistically positively linked to PIAS1 (Fig. 7b), NSMCE2 (Fig. 7c), SAE1 (Fig. 7d), RANBP2 (Fig. 7e), UBA2 (Fig. 7f), PIAS4 (Fig. 7g), RANGAP1 (Fig. 7h), SUMO3 (Fig. 7i), SUMO1 (Fig. 7j) or SUMO2 (Fig. 7k) expression in HCC. Survival analysis showed that most of the 10 correlated genes were linked to poor OS and RFS as shown in Fig. 7l and m, respectively. Notably, high expression of NSMCE2, SAE1, UBA2, RANGAP1, SUMO1 and SUMO2 indicated unfavorable OS and RFS in HCC.
Fig. 7.
Expression correlation analysis and survival analysis of UBE2I with genes in the UBE2I-involved protein–protein interaction network. a The UBE2I-involved protein–protein interaction network constructed by STRING database. b The expression relationship between UBE2I and PIAS1 in HCC assessed by GEPIA database. c The expression relationship between UBE2I and NSMCE2 in HCC assessed by GEPIA database. d The expression relationship between UBE2I and SAE1 in HCC assessed by GEPIA database. e The expression relationship between UBE2I and RANBP2 in HCC assessed by GEPIA database. f The expression relationship between UBE2I and UBA2 in HCC assessed by GEPIA database. g The expression relationship between UBE2I and PIAS4 in HCC assessed by GEPIA database. h The expression relationship between UBE2I and RANGAP1 in HCC assessed by GEPIA database. i The expression relationship between UBE2I and SUMO3 in HCC assessed by GEPIA database. j The expression relationship between UBE2I and SUMO1 in HCC assessed by GEPIA database. k The expression relationship between UBE2I and SUMO2 in HCC assessed by GEPIA database. P-value < 0.05 was considered as statistically significant. l The prognostic values (OS, overall survival) of the 10 correlated genes of UBE2I in HCC determined by Kaplan–Meier plotter. m The prognostic values (RFS, relapse free survival) of the 10 correlated genes of UBE2I in HCC determined by Kaplan–Meier plotter. Red bars indicated unfavorable prognosis; black represented no statistical significance. Logrank P-value < 0.05 was considered as statistically significant
Table 1.
The top 5 GO items related to proteins involved in UBE2I network
| GO-term | Description | False discovery rate |
|---|---|---|
| Biological process (BP) | ||
| GO:0016925 | Protein sumoylation | 8.43e−24 |
| GO:0033235 | Positive regulation of protein sumoylation | 5.45e−06 |
| GO:0032436 | Positive regulation of proteasomal ubiquitin-dependent protein catabolic process | 9.15e−06 |
| GO:0043085 | Positive regulation of catalytic activity | 8.30e−04 |
| GO:0065009 | Regulation of molecular function | 1.20e−03 |
| Molecular function (MF) | ||
| GO:0019789 | SUMO transferase activity | 9.18e−14 |
| GO:0044388 | Small protein activating enzyme binding | 2.99e−10 |
| GO:0019899 | Enzyme binding | 9.43e−08 |
| GO:0031386 | Protein tag | 3.48e−07 |
| GO:0008022 | Protein C-terminus binding | 6.65e−07 |
| Cellular component (CC) | ||
| GO:0016605 | PML body | 3.45e−12 |
| GO:0031510 | SUMO activating enzyme complex | 1.34e−07 |
| GO:0044428 | Nuclear part | 1.73e−06 |
| GO:0005654 | Nucleoplasm | 5.48e−06 |
| GO:0044614 | Nuclear pore cytoplasmic filaments | 5.48e−05 |
Table 2.
The top 5 KEGG and Reactome pathways related to proteins involved in UBE2I network
| Pathway-term | Description | False discovery rate |
|---|---|---|
| KEGG pathways | ||
| hsa04120 | Ubiquitin mediated proteolysis | 5.25e−08 |
| hsa03013 | RNA transport | 6.03e−08 |
| hsa05418 | Fluid shear stress and atherosclerosis | 1.20e−04 |
| hsa04064 | NF-kappa B signaling pathway | 2.20e−03 |
| hsa04630 | Jak-STAT signaling pathway | 5.00e−03 |
| Reactome pathways | ||
| HSA-2990846 | SUMOylation | 9.18e−14 |
| HSA-3108232 | SUMO E3 ligases SUMOylate target proteins | 2.99e−10 |
| HSA-3108214 | SUMOylation of DNA damage response and repair proteins | 9.43e−08 |
| HSA-3065678 | SUMO is transferred from E1 to E2 (UBE2I, UBC9) | 3.48e−07 |
| HSA-4615885 | SUMOylation of DNA replication proteins | 6.65e−07 |
Discussion
UBE2I is a member of the E2 enzyme family, involving in post-translationally regulating protein expression. A variety of investigations have suggested that UBE2I plays key roles in occurrence and development of several cancers. However, to the best of our knowledge, a study regarding its expression, functions and mechanisms in cancer remains absent. Thus, this study was conducted.
Our study conducted an analysis of UBE2I in 33 cancers using the data from TCGA and GTEx databases. The analytic result provided evidences that UBE2I was upregulated in 13 cancers and may act as an oncogene in these cancers. To find the studied cancer of interest, we assessed expression differences of UBE2I among various major stages in the 13 cancers. Only three cancers, KIRC, HCC and STAD, possessed statistical differences. Subsequently, the prognostic values (OS and RFS) of UBE2I in the three cancers were evaluated using Kaplan–Meier plotter database. High expression of UBE2I was significantly negatively correlated with both OS and RFS only in HCC. Fang et al. found that UBE2I was markedly overexpressed in HCC cell lines and clinical samples compared with normal controls [18]. They also indicated that UBE2I decreased the sensitivity of HCC to doxorubicin. This report together with our analytic results suggest that UBE2I may be a critical oncogene in HCC and may be developed as a promising therapeutic target in the future. We also found that UBE2I had a significant diagnostic value in HCC by ROC curve analysis. All these findings further imply that UBE2I may be an oncogene in HCC and may be a potential diagnostic biomarker for HCC patients.
For further validating UBE2I expression in HCC, Oncomine database was employed. The analytic result revealed that UBE2I was upregulated in HCC, partially supporting the accuracy of our previous bioinformatic analysis. Subsequently, we determined the expression level of UBE2I in HCC based on some clinicopathological features, including nodal metastasis, individual cancer stage and tumor grade. In general, UBE2I was correlated with development and progression of HCC. Functional experiments suggested that inhibition of UBE2I significantly reduced the invaded and migrated abilities of HCC, further supporting the oncogenic roles of UBE2I in HCC.
Next, we explored possible mechanisms causing UBE2I upregulation in HCC. It has been widely acknowledged that miRNAs are involved in negatively regulating downstream target gene expression [29–32]. Furthermore, in 2012, Zhao et al. showed that UBE2I expression was directly targeted by hsa-miR-214-3p in glioma [13]. Therefore, we predicted the upstream miRNAs of UBE2I by miRNet, which is a comprehensive database for miRNA-associated studies [24, 25]. Finally, 18 potential miRNAs were identified. Then, the expression levels and prognostic roles of these miRNAs were determined using TCGA data by starBase and Kaplan–Meier plotter, respectively. The results revealed that hsa-miR-195-3p was the most potential regulatory miRNA of UBE2I, with both downregulation in HCC compared with normal liver and possessing favorable prognosis in HCC patients with high expression UBE2I. Moreover, an inverse expression association between hsa-miR-195-3p and UBE2I was observed in HCC. Additionally, for the first time, we demonstrated that the promoter methylation level of UBE2I was significantly negatively linked to UBE2I mRNA expression in HCC. Taken together, loss of inhibition of hsa-miR-195-3p and dysregulation of promoter methylation level of UBE2I may account for UBE2I overexpression in HCC.
Genes usually interact with other genes, thereby exerting their biological roles [21]. To have a better understand of UBE2I action mechanism, a UBE2I-involved PPI network was established by STRING database. Enrichment analysis for the genes in this network revealed that they were significantly enriched in ubiquitin mediated proteolysis and SUMOylation pathways. These pathways have been well documented to be correlated with cancer progression [33, 34]. Correlation analysis revealed that UBE2I was significantly positively correlated with the 10 other genes in UBE2I-involved regulatory network. These correlated genes may play key roles in HCC. Especially, high expression of 6 genes (NSMCE2, SAE1, UBA2, RANGAP1, SUMO1 and SUMO2) indicated unfavorable OS and RFS in HCC. Guo et al. found that the expression levels of SUMO1 in human HCC cell lines and clinical HCC samples were significantly higher than that in corresponding normal controls [35]. All these findings suggest possible oncogenic roles of the 6 correlated genes in HCC.
Conclusion
In conclusion, we comprehensively analyzed the expression and prognostic values of UBE2I in human cancers. We also found that UBE2I possessed a diagnostic value in HCC. Two possible molecular mechanisms were discovered to account for UBE2I overexpression in HCC. Exploration and study of UBE2I-related PPI regulatory network provided important clues for developing novel therapeutic targets in HCC. These findings need to be further confirmed in the future.
Acknowledgements
Not applicable.
Authors’ contributions
WYL and JC conceived and supervised the study; HY performed bioinformatic analysis, conducted experiments, wrote the manuscript and revised the manuscript; SG performed some bioinformatic analysis. All authors read and approved the final manuscript.
Funding
This work was supported by 2019 Jiaxing Key Discipiline of Medical—Oncology (Supporting Subject, No. 2019-ZC-11).
Availability of data and materials
Contact with correspondence author for any data and material in this study.
Ethics approval and consent to participate
Not applicable.
Consent for publication
Not applicable.
Competing interests
All authors declared no conflict of interests.
Footnotes
Publisher's Note
Springer Nature remains neutral with regard to jurisdictional claims in published maps and institutional affiliations.
Contributor Information
Jing Chen, Email: 344299731@qq.com.
Weiyang Lou, Email: 11718264@zju.edu.cn.
References
- 1.Clague MJ, Heride C, Urbe S. The demographics of the ubiquitin system. Trends Cell Biol. 2015;25(7):417–426. doi: 10.1016/j.tcb.2015.03.002. [DOI] [PubMed] [Google Scholar]
- 2.Swatek KN, Komander D. Ubiquitin modifications. Cell Res. 2016;26(4):399–422. doi: 10.1038/cr.2016.39. [DOI] [PMC free article] [PubMed] [Google Scholar]
- 3.Guillamot M, Ouazia D, Dolgalev I, Yeung ST, Kourtis N, Dai Y, Corrigan K, Zea-Redondo L, Saraf A, Florens L, et al. The E3 ubiquitin ligase SPOP controls resolution of systemic inflammation by triggering MYD88 degradation. Nat Immunol. 2019;20(9):1196–1207. doi: 10.1038/s41590-019-0454-6. [DOI] [PMC free article] [PubMed] [Google Scholar]
- 4.Uematsu A, Kido K, Takahashi H, Takahashi C, Yanagihara Y, Saeki N, Yoshida S, Maekawa M. The E3 ubiquitin ligase MIB2 enhances inflammation by degrading the deubiquitinating enzyme CYLD. J Biol Chem. 2019;294(38):14135–14148. doi: 10.1074/jbc.RA119.010119. [DOI] [PMC free article] [PubMed] [Google Scholar]
- 5.Xu T, Wang H, Jiang M, Yan Y, Li W, Xu H, Huang Q, Lu Y, Chen J. The E3 ubiquitin ligase CHIP/miR-92b/PTEN regulatory network contributes to tumorigenesis of glioblastoma. Am J Cancer Res. 2017;7(2):289–300. [PMC free article] [PubMed] [Google Scholar]
- 6.Cai H, Zhang F, Li Z. Gfi-1 promotes proliferation of human cervical carcinoma via targeting of FBW7 ubiquitin ligase expression. Cancer Manag Res. 2018;10:2849–2857. doi: 10.2147/CMAR.S161130. [DOI] [PMC free article] [PubMed] [Google Scholar]
- 7.Hong SY, Kao YR, Lee TC, Wu CW. Upregulation of E3 Ubiquitin Ligase CBLC enhances EGFR dysregulation and signaling in lung adenocarcinoma. Cancer Res. 2018;78(17):4984–4996. doi: 10.1158/0008-5472.CAN-17-3858. [DOI] [PubMed] [Google Scholar]
- 8.Watanabe TK, Fujiwara T, Kawai A, Shimizu F, Takami S, Hirano H, Okuno S, Ozaki K, Takeda S, Shimada Y, et al. Cloning, expression, and mapping of UBE2I, a novel gene encoding a human homologue of yeast ubiquitin-conjugating enzymes which are critical for regulating the cell cycle. Cytogenet Cell Genet. 1996;72(1):86–89. doi: 10.1159/000134169. [DOI] [PubMed] [Google Scholar]
- 9.Wang A, Ding X, Demarque M, Liu X, Pan D, Xin H. Ubc9 is required for positive selection and late-stage maturation of thymocytes. J Biol Chem. 2017;198(9):3461–3470. doi: 10.4049/jimmunol.1600980. [DOI] [PMC free article] [PubMed] [Google Scholar]
- 10.Gupta MK, McLendon PM, Gulick J, James J, Khalili K, Robbins J. UBC9-mediated sumoylation favorably impacts cardiac function in compromised hearts. Circ Res. 2016;118(12):1894–1905. doi: 10.1161/CIRCRESAHA.115.308268. [DOI] [PMC free article] [PubMed] [Google Scholar]
- 11.Zhu S, Sachdeva M, Wu F, Lu Z, Mo YY. Ubc9 promotes breast cell invasion and metastasis in a sumoylation-independent manner. Oncogene. 2010;29(12):1763–1772. doi: 10.1038/onc.2009.459. [DOI] [PMC free article] [PubMed] [Google Scholar]
- 12.Chen SF, Gong C, Luo M, Yao HR, Zeng YJ, Su FX. Ubc9 expression predicts chemoresistance in breast cancer. Chin J Cancer. 2011;30(9):638–644. doi: 10.5732/cjc.011.10084. [DOI] [PMC free article] [PubMed] [Google Scholar]
- 13.Zhao Z, Tan X, Zhao A, Zhu L, Yin B, Yuan J, Qiang B, Peng X. microRNA-214-mediated UBC9 expression in glioma. BMB Rep. 2012;45(11):641–646. doi: 10.5483/BMBRep.2012.45.11.097. [DOI] [PMC free article] [PubMed] [Google Scholar]
- 14.Wang S, Jiao B, Geng S, Ma S, Liang Z, Lu S. Combined aberrant expression of microRNA-214 and UBC9 is an independent unfavorable prognostic factor for patients with gliomas. Med Oncol (Northwood, London, England) 2014;31(1):767. doi: 10.1007/s12032-013-0767-5. [DOI] [PubMed] [Google Scholar]
- 15.Li H, Niu H, Peng Y, Wang J, He P. Ubc9 promotes invasion and metastasis of lung cancer cells. Oncol Rep. 2013;29(4):1588–1594. doi: 10.3892/or.2013.2268. [DOI] [PubMed] [Google Scholar]
- 16.Ronen O, Malone JP, Kay P, Bivens C, Hall K, Paruchuri LP, Mo YY, Robbins KT, Ran S. Expression of a novel marker, Ubc9, in squamous cell carcinoma of the head and neck. Head Neck. 2009;31(7):845–855. doi: 10.1002/hed.21048. [DOI] [PubMed] [Google Scholar]
- 17.Zhang D, Yu K, Yang Z, Li Y, Ma X, Bian X, Liu F, Li L, Liu X, Wu W. Silencing Ubc9 expression suppresses osteosarcoma tumorigenesis and enhances chemosensitivity to HSV-TK/GCV by regulating connexin 43 SUMOylation. Int J Oncol. 2018;53(3):1323–1331. doi: 10.3892/ijo.2018.4448. [DOI] [PubMed] [Google Scholar]
- 18.Fang S, Qiu J, Wu Z, Bai T, Guo W. Down-regulation of UBC9 increases the sensitivity of hepatocellular carcinoma to doxorubicin. Oncotarget. 2017;8(30):49783–49795. doi: 10.18632/oncotarget.17939. [DOI] [PMC free article] [PubMed] [Google Scholar]
- 19.Tang Z, Li C, Kang B, Gao G, Li C, Zhang Z. GEPIA: a web server for cancer and normal gene expression profiling and interactive analyses. Nucleic Acids Res. 2017;45(W1):W98–W102. doi: 10.1093/nar/gkx247. [DOI] [PMC free article] [PubMed] [Google Scholar]
- 20.Lou W, Ding B, Fan W. High expression of pseudogene PTTG3P indicates a poor prognosis in human breast cancer. Mol Ther Oncol. 2019;14:15–26. doi: 10.1016/j.omto.2019.03.006. [DOI] [PMC free article] [PubMed] [Google Scholar]
- 21.Lou W, Liu J, Ding B, Jin L, Xu L, Li X, Chen J, Fan W. Five miRNAs-mediated PIEZO2 downregulation, accompanied with activation of Hedgehog signaling pathway, predicts poor prognosis of breast cancer. Aging. 2019;11(9):2628–2652. doi: 10.18632/aging.101934. [DOI] [PMC free article] [PubMed] [Google Scholar]
- 22.Rhodes DR, Yu J, Shanker K, Deshpande N, Varambally R, Ghosh D, Barrette T, Pandey A, Chinnaiyan AM. ONCOMINE: a cancer microarray database and integrated data-mining platform. Neoplasia (New York, NY) 2004;6(1):1–6. doi: 10.1016/S1476-5586(04)80047-2. [DOI] [PMC free article] [PubMed] [Google Scholar]
- 23.Chandrashekar DS, Bashel B, Balasubramanya SAH, Creighton CJ, Ponce-Rodriguez I, Chakravarthi B, Varambally S. UALCAN: a portal for facilitating tumor subgroup gene expression and survival analyses. Neoplasia (New York, NY) 2017;19(8):649–658. doi: 10.1016/j.neo.2017.05.002. [DOI] [PMC free article] [PubMed] [Google Scholar]
- 24.Fan Y, Siklenka K, Arora SK, Ribeiro P, Kimmins S, Xia J. miRNet—dissecting miRNA-target interactions and functional associations through network-based visual analysis. Nucleic Acids Res. 2016;44(W1):W135–W141. doi: 10.1093/nar/gkw288. [DOI] [PMC free article] [PubMed] [Google Scholar]
- 25.Fan Y, Xia J. miRNet-Functional Analysis and Visual Exploration of miRNA-Target Interactions in a Network Context. Methods in Molecular Biology (Clifton, NJ) 2018;1819:215–233. doi: 10.1007/978-1-4939-8618-7_10. [DOI] [PubMed] [Google Scholar]
- 26.Li JH, Liu S, Zhou H, Qu LH, Yang JH. starBase v20: decoding miRNA-ceRNA, miRNA-ncRNA and protein-RNA interaction networks from large-scale CLIP-Seq data. Nucleic Acids Res. 2014;42(Database issue):D92–D97. doi: 10.1093/nar/gkt1248. [DOI] [PMC free article] [PubMed] [Google Scholar]
- 27.Yang JH, Li JH, Shao P, Zhou H, Chen YQ, Qu LH. starBase: a database for exploring microRNA-mRNA interaction maps from Argonaute CLIP-Seq and Degradome-Seq data. Nucleic Acids Res. 2011;39(Database issue):D202–D209. doi: 10.1093/nar/gkq1056. [DOI] [PMC free article] [PubMed] [Google Scholar]
- 28.Gao J, Aksoy BA, Dogrusoz U, Dresdner G, Gross B, Sumer SO, Sun Y, Jacobsen A, Sinha R, Larsson E, et al. Integrative analysis of complex cancer genomics and clinical profiles using the cBioPortal. Sci Signal. 2013;6(269):pl1. doi: 10.1126/scisignal.2004088. [DOI] [PMC free article] [PubMed] [Google Scholar]
- 29.Lou W, Liu J, Ding B, Chen D, Xu L, Ding J, Jiang D, Zhou L, Zheng S, Fan W. Identification of potential miRNA-mRNA regulatory network contributing to pathogenesis of HBV-related HCC. J Transl Med. 2019;17(1):7. doi: 10.1186/s12967-018-1761-7. [DOI] [PMC free article] [PubMed] [Google Scholar]
- 30.Lou W, Liu J, Ding B, Xu L, Fan W. Identification of chemoresistance-associated miRNAs in breast cancer. Cancer Manag Res. 2018;10:4747–4757. doi: 10.2147/CMAR.S172722. [DOI] [PMC free article] [PubMed] [Google Scholar]
- 31.Lou W, Chen J, Ding B, Chen D, Zheng H, Jiang D, Xu L, Bao C, Cao G, Fan W. Identification of invasion-metastasis-associated microRNAs in hepatocellular carcinoma based on bioinformatic analysis and experimental validation. J Transl Med. 2018;16(1):266. doi: 10.1186/s12967-018-1639-8. [DOI] [PMC free article] [PubMed] [Google Scholar]
- 32.Lou W, Ding B, Xu L, Fan W. Construction of Potential Glioblastoma Multiforme-Related miRNA-mRNA Regulatory Network. Front Mol Neurosci. 2019;12:66. doi: 10.3389/fnmol.2019.00066. [DOI] [PMC free article] [PubMed] [Google Scholar]
- 33.Nakayama KI, Nakayama K. Ubiquitin ligases: cell-cycle control and cancer. Nat Rev Cancer. 2006;6(5):369–381. doi: 10.1038/nrc1881. [DOI] [PubMed] [Google Scholar]
- 34.Lee JS, Choi HJ, Baek SH. Sumoylation and its contribution to cancer. Adv Exp Med Biol. 2017;963:283–298. doi: 10.1007/978-3-319-50044-7_17. [DOI] [PubMed] [Google Scholar]
- 35.Guo WH, Yuan LH, Xiao ZH, Liu D, Zhang JX. Overexpression of SUMO-1 in hepatocellular carcinoma: a latent target for diagnosis and therapy of hepatoma. J Cancer Res Clin Oncol. 2011;137(3):533–541. doi: 10.1007/s00432-010-0920-x. [DOI] [PubMed] [Google Scholar]
Associated Data
This section collects any data citations, data availability statements, or supplementary materials included in this article.
Data Availability Statement
Contact with correspondence author for any data and material in this study.


