Abstract
Background
Comprehensive and efficient assessments are necessary for clinical care and research in chronic diseases. Our objective was to assess the implementation of a technology-enabled tool in MS practice.
Method
We analyzed prospectively collected longitudinal data from routine multiple sclerosis (MS) visits between September 2015 and May 2018. The MS Performance Test, comprising patient-reported outcome measures (PROMs) and neuroperformance tests (NPTs) self-administered using a tablet, was integrated into routine care. Descriptive statistics, Spearman correlations, and linear mixed-effect models were used to examine the implementation process and relationship between patient characteristics and completion of assessments.
Results
A total of 8022 follow-up visits from 4199 patients (median age 49.9 [40.2–58.8] years, 32.1% progressive course, and median disease duration 13.6 [5.9–22.3] years) were analyzed. By the end of integration, the tablet version of the Timed 25-Foot Walk was obtained in 89.0% of patients and the 9-Hole Peg Test in 94.8% compared with 74.2% and 64.3%, respectively before implementation. The greatest increase in data capture occurred in processing speed and low-contrast acuity assessments (0% prior vs 78.4% and 36.7%, respectively, following implementation). Four PROMs were administered in 41%–98% of patients compared with a single depression questionnaire with a previous capture rate of 70.6%. Completion rates and time required to complete each NPT improved with subsequent visits. Younger age and lower disability scores were associated with shorter completion time and higher completion rates.
Conclusions
Integration of technology-enabled data capture in routine clinical practice allows acquisition of comprehensive standardized data for use in patient care and clinical research.
Comprehensive, reproducible, and quantitative assessment of neurologic function is challenging in clinical practice. Longitudinal information about neurologic status is often confined to individual narrative descriptions documented in the electronic health record (EHR), which are difficult to use for patient care and even more difficult to aggregate for research purposes.1,2 Standardized, accurate, reliable, valid, and easy-to-use tools for self-report and performance assessment for routine use in practice are greatly needed.3 Technology-enabled tools have the potential to substantially enhance clinical care by improving measurement and documentation of neurologic function over time. Consequently, comprehensive quantitative data collection could accelerate the development of observational studies and pragmatic trials, particularly in the field of multiple sclerosis (MS).3,4
Neurologic impairment in MS can affect multiple domains. In clinical practice, measures such as the Expanded Disability Status Scale (EDSS),5 the Timed 25-Foot Walk (T25FW), and the 9-Hole Peg Test (9HPT) are performed inconsistently, require provider time, and cover a narrow representation of neurologic disability.1 The Multiple Sclerosis Performance Test (MSPT) comprises a battery of quantitative patient-reported outcome measures (PROMs) and neuroperformance tests (NPTs) administered using a tablet-based application and supporting hardware.6 Validated PROMs evaluating different aspects of quality of life and patient-perceived disability were integrated in the application as electronic questionnaires. The NPTs were modeled after the technician-administered tests comprising the Multiple Sclerosis Functional Composite (MSFC), a widely used outcome measure in MS trials.7–14 The aim of this study was to assess the feasibility and measure the effect of integrating these routine assessments into clinical care.
Methods
Implementation process
Technical development
The application was developed at the Cleveland Clinic, partially funded by Biogen, and its implementation was approved by our institutional review board.6 The integration of data into the EHR was conducted over 9 months. Initially, a full-time analyst, a full-time web developer, and a part-time research manager worked on the implementation process. Subsequently, the time required by the EHR information technology team was 1 to 2 hours per week to maintain adequate technical flow. Sustaining costs after implementation consist of personnel time (medical assistant or similar to oversee testing), institutional IT fees associated with data storage/hosting, and any necessary technical maintenance/support.
Clinical reorganization and data management
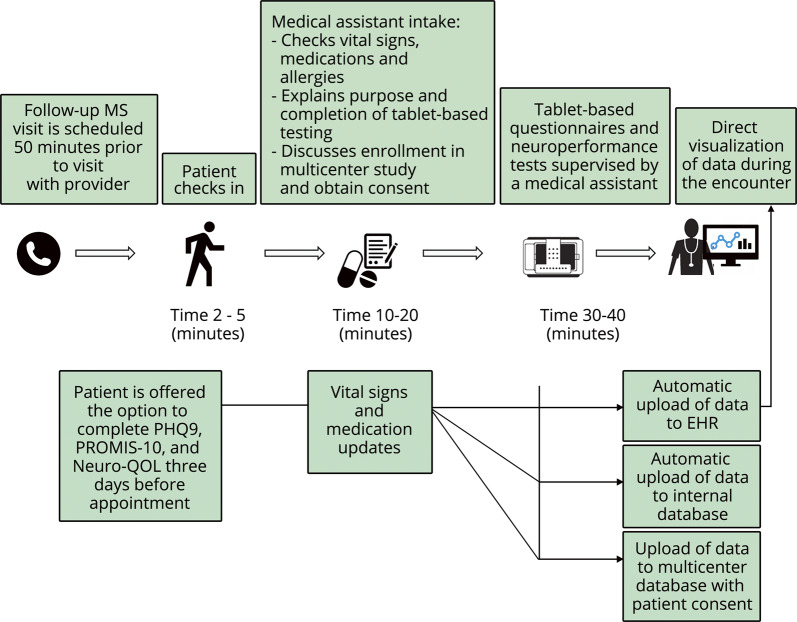
Visit conduct and data flow are illustrated in figure 1. Patients complete the MSPT as standard of care, either independently with visual and audio instructions or, if needed, with the help of a medical assistant. A dedicated assessment space was created between the waiting area and examination room corridor with stations for 8 patients to complete the MSPT simultaneously. One medical assistant generally oversees testing by 4 to 6 patients, providing special assistance to patients as needed. The MSPT is typically completed in 30–40 minutes. Raw data are scored and automatically integrated to the EHR, allowing review during clinical encounters and, as of January 2018, incorporation of data into a standardized follow-up note template that includes MSPT data (figure e-1). To assess efficiency of documentation in the EHR, the time spent actively creating notes was calculated for providers who started using the MSPT template exclusively, before and after switching to the new format, via EHR background tools.
Figure 1. Clinical workflow and automatic data upload after completion of technology-enabled tests.
EHR = electronic health record; Neuro-QOL = Quality of Life in Neurological Disorders; PHQ-9 = Patient Health Questionnaire-9; PROMIS-10 = Patient-Reported Outcomes Measurement Information System.
Personnel and patient engagement
Clinician and patient engagement were addressed through staff education, codesign of the process with patients, continuous feedback from involved parties, and ongoing efforts to optimize efficiency. A multidisciplinary team of neurologists, research managers, medical assistants, nurse practitioners, biomedical engineers, and statisticians monitored the implementation process, identified obstacles, and maintained patient confidentiality.
Design and participants
The analysis included all patients with a diagnosis of MS presenting for a follow-up visit from September 1, 2015, to May 31, 2018.
Study measures
Demographics and disease characteristics
Demographics (age, sex, race, educational level, and employment status), patient-reported disease course, use of disease-modifying therapy, and disease duration were collected using a questionnaire included in the first module of the MSPT (My Health).
Patient-reported outcome measures
The My Health module also included 3 PROMs: Patient Determined Disease Steps (PDDS, a self-reported physical disability scale strongly correlated with the pyramidal and cerebellar functional system scores of the EDSS),15 Patient Health Questionnaire-9 (PHQ-9, a measure of depression),16 and Patient-Reported Outcomes Measurement Information System (PROMIS-10, an NIH toolbox questionnaire that quantifies physical and mental health-related quality of life).17 The Quality of Life in Neurological Disorder Questionnaire (Neuro-QOL, an NIH toolbox self-reported assessment) evaluates 12 domains (lower extremity function, upper extremity function, cognition, sleep, fatigue, depression, anxiety, emotional and behavioral dyscontrol, participation in social roles and activities, satisfaction in social roles, stigma, and well-being) and was administered as a separate module.18,19 Neuro-QOL is administered using computer adapted testing. T-scores are calculated, with T = 50 indicating average function compared with a reference population with an SD of 10. For Neuro-QOL and PROMIS-10, both clinical samples and general population served as the reference population depending on the evaluated domain.20 To reduce visit time, patients were able to complete PHQ-9, PROMIS-10, and Neuro-QOL questionnaires from home via an independent platform linked to the EHR up to 3 days before their appointment. Correlation analyses included tests completed both at home and in office. Analysis of completion rates included office assessments only.
Neuroperformance tests
The NPTs in the MSPT have been validated, showing comparable or superior performance compared with standard technician-administered tests with regard to test-retest reliability, practice effects, and sensitivity to distinguishing people with MS from healthy controls, specifically for the Processing Speed Test (PST).6,21 Excellent concurrent validity has been established with strong correlations between MSPT components and analogous MSFC tests.6 In addition, administration of the MSPT has been well accepted in patient focus groups.6,21
Four NPTs were included in the MSPT, each forming a separate module:
1. Walking Speed Test (WST): an electronic adaptation of the T25FW, measured in seconds.
2. Manual Dexterity Test (MDT): an electronic adaptation of the 9HPT, measured in seconds, in each hand separately.
3. PST: an electronic adaptation of the Symbol-Digit Modalities Test (SDMT), measured in total number of correct answers in 120 seconds.
4. Contrast Sensitivity Test (CST): an electronic adaptation of Sloan Low-Contrast Letter Acuity (LCLA) in the MSFC, binocular with a 2.5% contrast level, measured in number of correct answers.
Larger-scale validation of the MDT, WST, and CST has been completed and is currently under review.
The total time to complete each of the NPTs included the time to read the instructions, complete training trials (when applicable), and complete the test itself.
The MSPT modules were administered in the following fixed order: My Health, Neuro-QOL, PST, CST, MDT, and WST (figure e-2). The My Health module was mandatory. For patients who were unable to complete other parts of the MSPT because of physical inability (e.g., the WST for nonambulatory patients), refusal to take the test, or lack of time (e.g., patients who checked-in late for their appointment), modules were deselected before administration. When lack of time was the limitation, priority was given to the MDT and WST. Reasons why patients did not complete testing were not formally determined during this period.
Statistical analysis
Descriptive statistics were used to analyze patient and clinical characteristics. Chi-square and T-tests were used to examine differences in characteristics between completers and noncompleters and in percentages of patients completing PROMs and NPTs before (January to May 2015) and after (January to May 2018) implementing the MSPT. The percentage of patients assessed via the MSPT was calculated across different periods, and change over time was examined using a Cochran-Armitage22 test for trend. The change in the proportion of patients completing each NPT and the time needed to complete each NPT were modeled using a generalized linear mixed-effect model to account for potential subject correlation, with the number of visits as a fixed effect and a random effect for subjects. An estimate statement was used to assess the trend of change for significance in marginal means of each NPT duration across visits. A binomial distribution model was used to analyze the trend of change in the completion proportions of each NPT across visits. Spearman correlation coefficients were used to examine the relation of age and disability to time needed to complete each NPT and the number of NPTs completed at each encounter. Significance was set at p ≤ 0.001 given the large sample size and to account for multiplicity. A paired t test was used to compare time spent by the clinician to completing EHR documentation before and after switching to the MSPT template.
Standard protocol approvals, registrations, and patient consents
The Cleveland Clinic Institutional Review Board approved this study.
Data availability
Anonymized data will be shared with qualified investigators by request to the corresponding author for purposes of replicating procedures and results.
Results
Patient characteristics
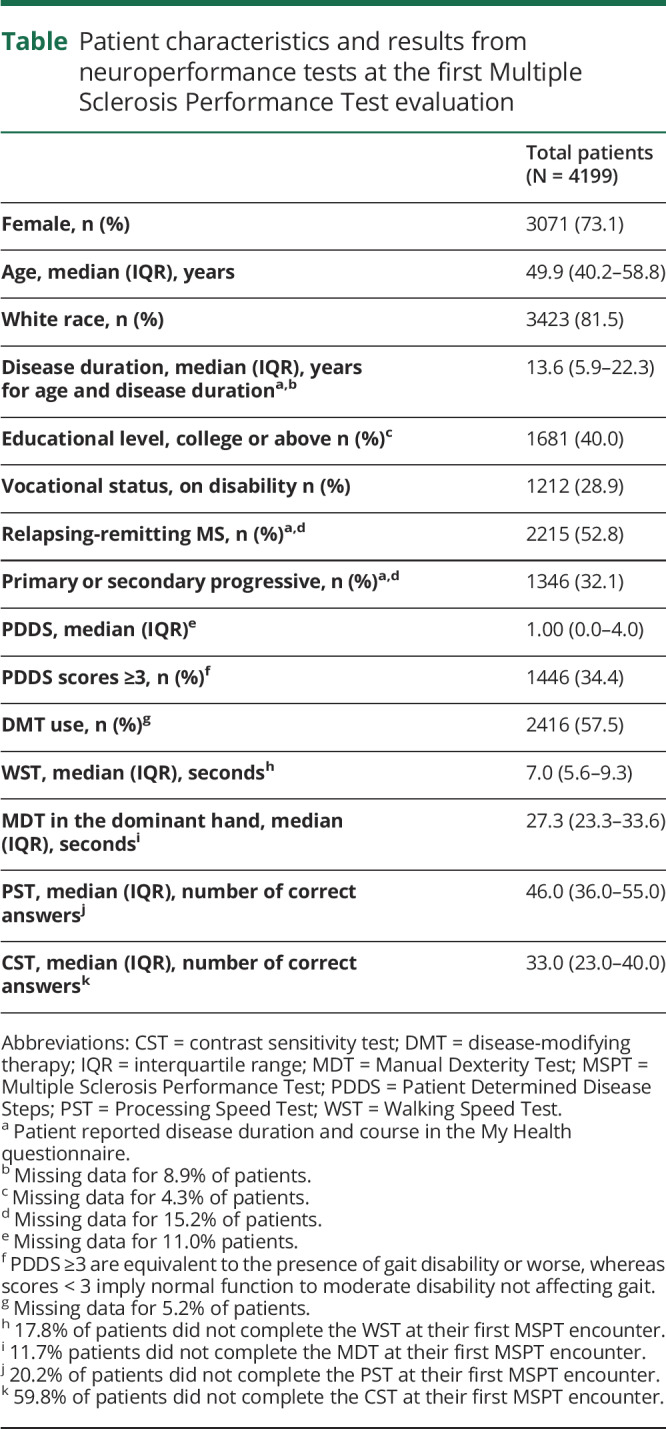
Data were collected from 8022 encounters with 4199 unique patients having a diagnosis of MS. Baseline demographics and disease characteristics were typical of an MS population in a large referral clinic (table).23,24 Demographics of patients with established MS who were seen at our center but did not take the MSPT were similar to those who completed the MSPT (partially or completely) in the late implementation period (January 2018 through May 2018), with no differences in age, race, or sex between the 2 groups. Standardized and comparable physical or cognitive disability measures were not obtained for patients who did not take the MSPT, precluding more extensive assessment for participation bias.
Table.
Patient characteristics and results from neuroperformance tests at the first Multiple Sclerosis Performance Test evaluation
MSPT implementation
For clinicians who switched to the MSPT-based template, the mean time spent completing the visit note decreased from 8.5 to 6.2 minutes.
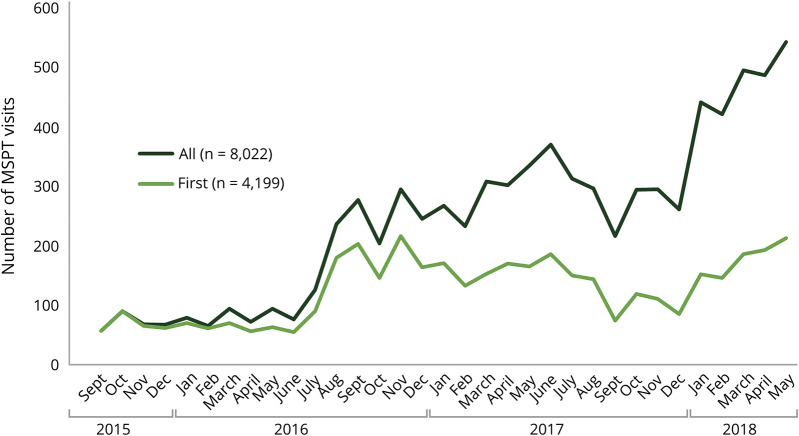
MSPT technology was implemented gradually (figure 2). A limited number of patients were initially enrolled from September 2015 to June 2016. From January 2018 to the end of the study period (May 31, 2018), 477 patients were assessed per month, on average, with fluctuations depending on the total number of patients visiting the center and staff availability. The proportion of follow-up patients assessed by the MSPT increased over time: 13.9% in December 2015, 35.5% in August 2016, 69.2% in December 2016, and 77.2% in May 2018 (p for trend < 0.0001). Fluctuations in the number of visits due to patient volume or clinical staffing were present throughout the implementation period.
Figure 2. Integration of technology-enabled data capture into patient care over time.
The number of patients taking the MSPT each month since initial implementation in September 2015 is shown. All = all patient visits; First = visits from patient at their initial MSPT encounter; MSPT = Multiple Sclerosis Performance Test.
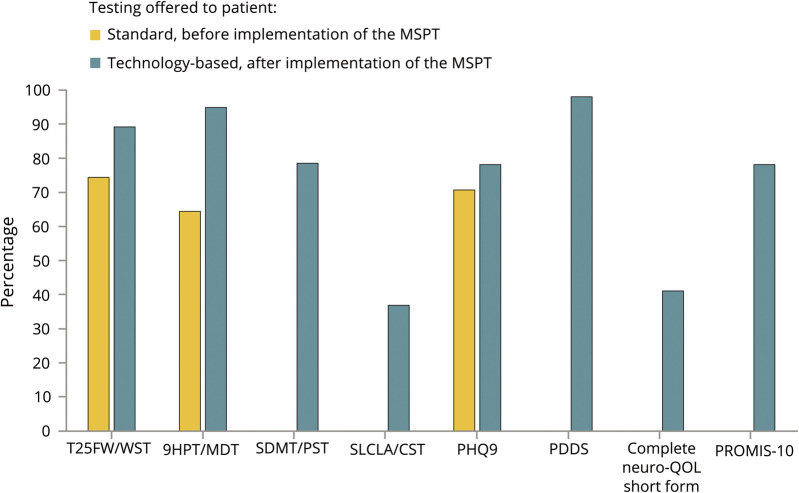
The PDDS, Quality of Life in Neurological Disorder Questionnaire (Neuro-QOL), PROMIS-10, SDMT, and LCLA were not administered before MSPT implementation (January through June 2015). From January to May 2018, participation rates in patients evaluated using the MSPT were WST 89.0%, MDT 94.8%, PST 78.4%, CST 36.7%, PDDS 98.0%, PHQ-9 78.0%, PROMIS-10 78.0%, and Neuro-QOL 41.0% (figure 3).
Figure 3. Percentage of follow-up patients for whom clinical data were obtained before and after implementing technology-enabled data capture.
The preimplementation period included data from follow-up visits between January and June 2015. The postimplementation period included data from follow-up visits scheduled to receive the MSPT between January and May 2018. 9HPT = 9-Hole Peg Test; CST = Contrast Sensitivity Test; MDT = Manual Dexterity Test; MSPT = Multiple Sclerosis Performance Test; Neuro-QOL = Quality of Life in Neurological Disorders; PDDS = Patient Determined Disease Steps; PHQ-9= Patient Health Questionnaire-9; PROMIS-10 = Patient-Reported Outcomes Measurement Information System; PST = Processing Speed Test; SDMT = Symbol-Digit Modalities Test; SLCLA = Sloan Low-Contrast Letter Acuity; T25W = Timed 25-Foot Walk; WST = Walking Speed Test.
Practical aspects of MSPT incorporation into visit flow
Improvement in completion time and rates is illustrated in Figure e-3. The time to complete each NPT decreased with increased exposure to the tests: from 144 to 116 seconds for WST, 284 to 239 seconds for PST, and 420 to 398 seconds for CST (p for trend < 0.001 for all). Time to complete the MDT (281–270 seconds, p for trend = 0.19) did not significantly improve with repeated testing, possibly because most of the testing time is occupied by the timed trials themselves. Repetitive exposure to the MSPT over time was associated with increasing completion rates for the WST (82.2%–95.0%, p for trend < 0.0001) and MDT (88.3%–96.5% p for trend <0.0001), but not the PST (79.8%–81.5%, p for trend = 0.17) and CST (40.2%–40.8%, p for trend = 0.33).
Older (ρ = −0.24, 95% CI −0.27 to −0.21, p < 0.001) and more physically or cognitively impaired patients (PDDS score ρ = −0.24, 95% CI −0.27 to −0.21, PST score ρ = 0.33, 95% CI 0.30 to 0.36, p < 0.001) completed a lower number of assessments per encounter. Older patients required more time to complete each module, particularly the PST (ρ = 0.47, 95% CI 0.44–0.50) and MDT (ρ = 0.32, 95% CI 0.29–0.35; p < 0.001 for all). Patients with higher PDDS scores required more time to complete each module, particularly the MDT (ρ = 0.40, 95% CI 0.37–0.43), PST (ρ = 0.37, 95% CI 0.34–0.40), and WST (ρ = 0.25, 95% CI 0.22–0.29; p < 0.001 for all). PST scores were associated with the time to complete each assessment (particularly for the PST [ρ = −0.68, 95% CI −0.70 to −0.66] and MDT [ρ = −0.56, 95% CI −0.59 to −0.54]; p < 0.001 for all). PHQ-9 scores showed weak or no correlation with the number of modules (ρ = −0.06, p < 0.001) and the time needed to complete each module (ρ = 0.05 to 0.16, except for WST).
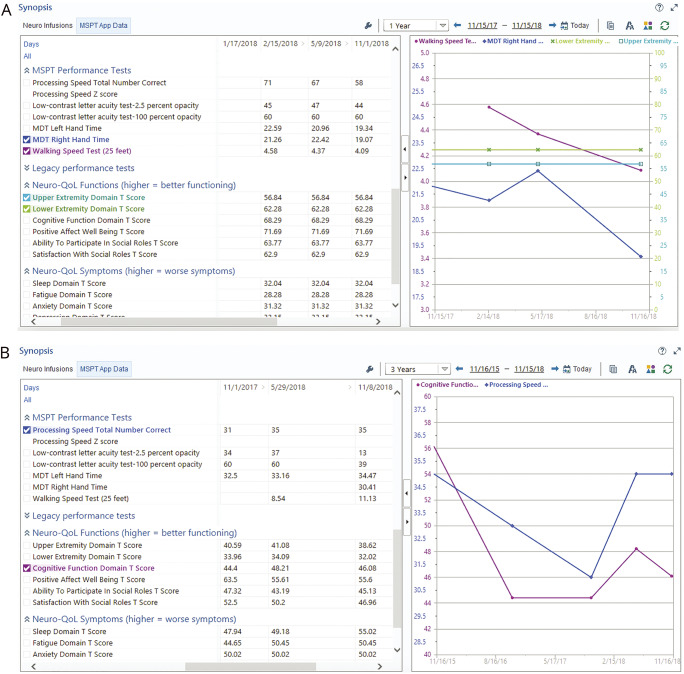
An individual patient's MSPT-derived data over time could be readily visualized in the EHR (figure 4). For clinicians who switched to the MSPT-based template, the mean time spent completing the visit note decreased from 8.5 to 6.2 minutes.
Figure 4. Real-time analysis of patient data during an encounter.
(A) On the left, scores from neuroperformance tests and patient-reported outcomes by date. On the right, graphical representation of selected tests: Walking Speed Test (purple line), Manual Dexterity Test (dark blue line), Neuro-QOL lower extremity domain (green line), and Neuro-QOL upper extremity domain (light blue line). (B) On the left, scores from neuroperformance tests and patient-reported outcomes by date. On the right, graphical representation of selected tests: Processing Speed Test (purple line) and Neuro-QOL cognitive domain (dark blue line). Neuro-QOL = Quality of Life in Neurological Disorders
Discussion
Our results demonstrate the feasibility and efficiency of technology-based self-administered data collection in a large office-based setting. Overall, we observed high completion rates of the MSPT modules. Physical disability measures (WST and MDT) were captured in a substantial proportion of patients, as well as MSPT-enabled evaluation of cognitive function, perceived disability, physical health, mental health, social quality of life, and mood, which was not previously available. Tablet-based testing also allowed measurement of LCLA in one-third of patients. Hence, the range, consistency, and standardization of available data for patient care and research improved substantially. Familiarity with the test, younger age, and less severe disability were associated with higher completion rates and faster completion times, probably due to practice effects and skipping the instructions with subsequent testing. Completion rates were high even at first MSPT encounters, and there were no demographic differences between completers and noncompleters, indicating the feasibility of the test in a broad range of patients.
Self-administration guided by audio and video instructions or assistance from trained personnel allows multiple patients to be assessed simultaneously.
From our experience, technology-enabled assessment provides important benefits for neurologic care. Clinical workflow is enhanced by standardized data acquisition and documentation. Self-administration guided by audio and video instructions or assistance from trained personnel allows multiple patients to be assessed simultaneously. Using a limited number of medical assistants to oversee testing acquisition allows top-of-license practice by clinicians, who can focus on interpreting information, discussing results with patients, and using the data to inform treatment decisions. Rapid automatic integration of PROM and NPT results in visit notes also reduced documentation time. Unburdening providers from data collection, entry, and tabulation has the potential to reduce time spent in EHR documentation, which is associated with burnout.25 Feedback on the users experience from our MS patient focus group was largely positive, although patient/provider satisfaction was not formally studied during this implementation period. Evaluation of patient and provider satisfaction following MSPT implementation is the subject of ongoing work.
The EHR represents a valuable source of patient information and is intended to improve quality and efficiency of care.26 Established approaches to generate structured data from routine visits have limitations. Generating data from office visits using natural language processing to parse text from visit notes is susceptible to variability in data acquisition, completeness, and quality. Moreover, data extracted from the EHR after the visit are not available for use during patient encounters.27 Unstructured data, as typically collected in clinical practice, add work to patient care and create challenges for outcomes, comparative effectiveness, and quality improvement research.2,27 The robust integration of self-administered technology-captured data offers an efficient model to populate EHRs with structured longitudinal data. When reviewed with patients, long-term disability monitoring and visual representation of health information for patients with chronic disease influence decision making.28 Real-time display of the patient's longitudinal data stored in the EHR has the potential to enhance detection of changes in clinical manifestations. Tests of neurologic performance administered via a standardized process decrease the risk of errors in test administration and scoring, thereby minimizing interrater variability.6
Longitudinal data from clinical cohorts obtained by comprehensive standardized testing also can be combined with other information in the EHR and aggregated across centers to address research questions.2 Furthermore, technology-enabled longitudinal data collection in clinical cohorts, as described herein, could be used to conduct pragmatic clinical trials leading to real-world evidence to complement results from randomized controlled trials.29–31
Some limitations in our study should be noted. The inability to obtain reliable disability measures for patients who declined or were unable to complete the MSPT prevented assessment of generalizability of the results, although basic demographics were not different between completers and noncompleters. Moreover, data from our group showed that patients completing testing as part of clinical practice are more disabled than participants in clinical trials, highlighting the broader representation of a real-word MS population.32 Clarification on reason of cancellation of each module was unavailable, but is being incorporated into a future version of the MSPT. In addition, the complexity of the information technology procedures required a consistent effort to detect technical problems and apply changes accordingly. Implementation costs are anticipated to vary depending on specific institution and setting. As health care systems move toward value-based payment structures, it is anticipated that routinely quantifying outcomes will become an advantageous aspect of clinical care and that the nominal cost of implementing technology-enabled patient-administered performance testing could be offset by time saved by providers who would otherwise be required to manually perform testing. Finally, the CST was the most difficult test to implement. No improvement in the completion rate was observed over time with multiple exposures to this test. Although a carryover effect was noted across visits, patients' acceptance of the CST was suboptimal because of its long duration and technical challenges. An improved version of the application is being developed.
The current experience in a large chronic disease patient cohort indicates that technology-enabled clinical evaluation and data capture with automatic integration into the EHR facilitate routine collection of disease characteristics, PROMs, and NPTs. It also allows more accurate phenotyping of individual patients and populations, promotes data-driven patient care and ability to answer research questions from clinical data, and lessens barriers between clinical care and research. Assessing function in multiple domains in a standardized and objective way while incorporating PROMs is a key element of precision medicine and, consequently, more individualized management of complex chronic diseases. Monitoring neurologic function while efficiently collecting data from clinical settings is a priority and should yield higher quality real-world evidence that will inform future management of MS. For any chronic illness needing structured clinical assessment and objective visualization of disease evolution, this model could be used to guide clinical management, quantify therapeutic response, and effectively engage patients and clinicians in decision making.
Acknowledgment
The authors thank the patients of Cleveland Clinic's Mellen Center and their families.
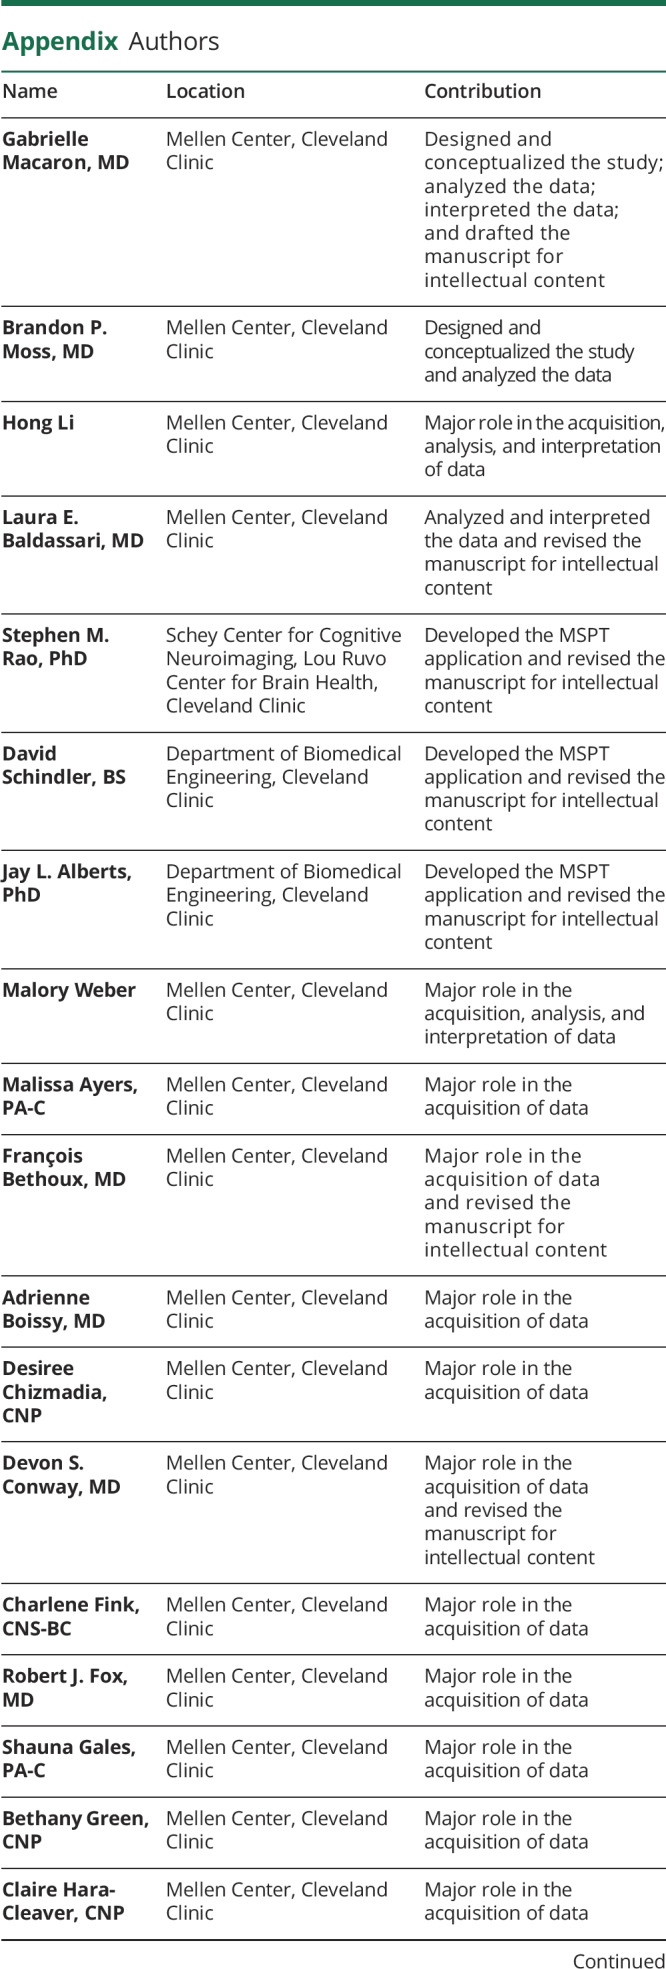
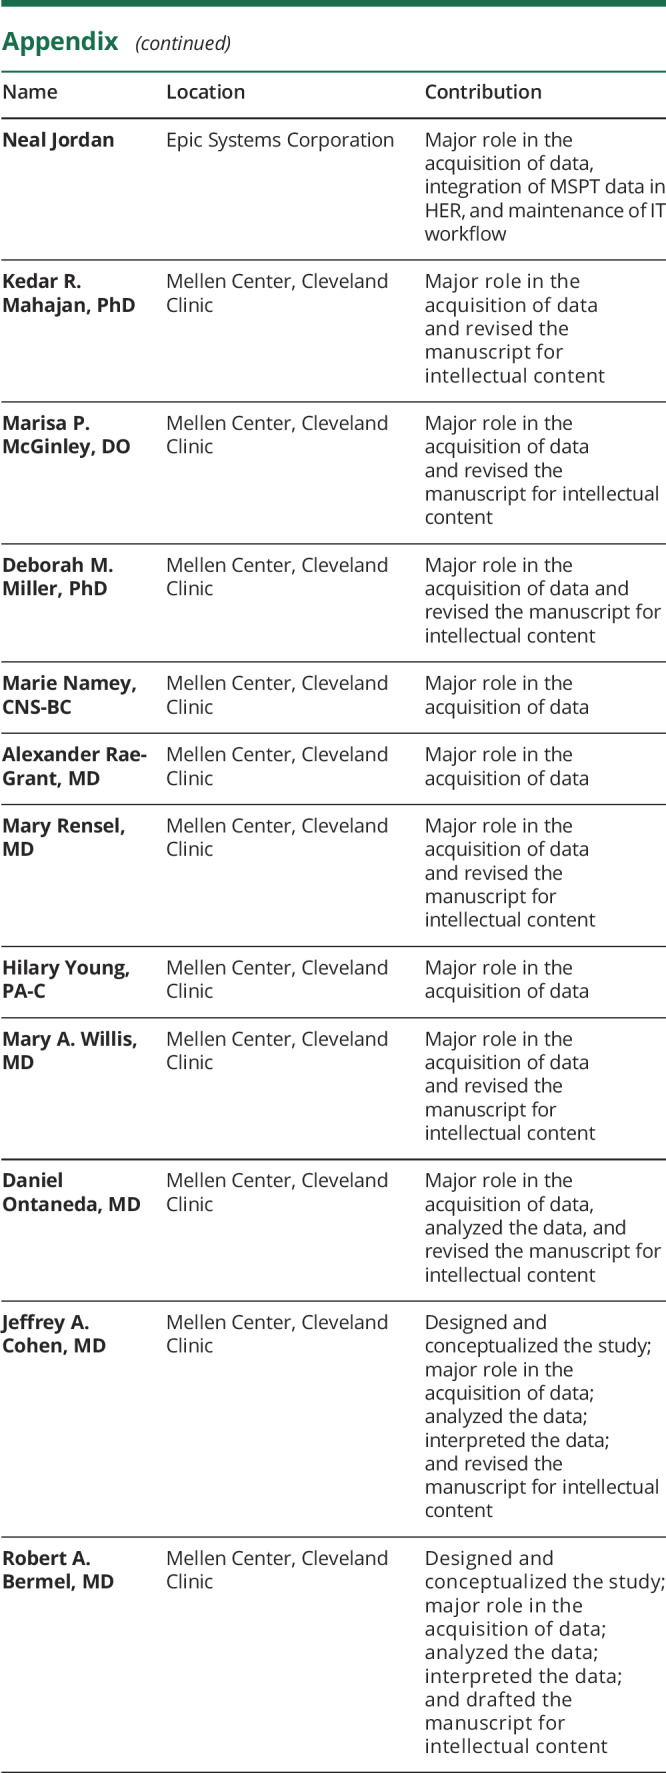
Appendix. Authors
Study funding
No targeted funding reported for this study. The development of the Multiple Sclerosis Performance Test was partly funded by Biogen.
Disclosure
G. Macaron is supported by the National Multiple Sclerosis Society Institutional Clinician Training Award ICT 0002; received fellowship funding from Biogen Fellowship Grant 6873-P-FEL during the study period; and served on an advisory board for Genentech. B.P. Moss received fellowship funding from the National Multiple Sclerosis Society Institutional Clinician Training Award ICT 0002 during the study period and reports personal compensation for consulting for Genentech and speaking for Genzyme. H. Li reports no disclosures. L.E. Baldassari received personal fees for serving on a scientific advisory board for Teva and is supported by a Sylvia Lawry Physician Fellowship Grant through the National Multiple Sclerosis Society (#FP-1606-24540). S.M. Rao received honoraria, royalties, or consulting fees from Biogen, Genzyme, Novartis, American Psychological Association, and International Neuropsychological Society and research funding from the NIH, US Department of Defense, National Multiple Sclerosis Society, CHDI Foundation, Biogen, and Novartis and contributed to intellectual property that is a part of the MSPT, for which he has the potential to receive royalties. D. Schindler received royalties from the Cleveland Clinic for licensing MSPT-related technology and is an employee and stockholder of Qr8 Health. J.L. Alberts received funding from the Department of Defense, NIH, Davis Phinney Foundation, and National Science Foundation and has received royalties from the Cleveland Clinic for licensing MSPT-related technology. M. Weber reports no disclosures. M. Ayers received honoraria from Sanofi Genzyme. F. Bethoux received honoraria or consulting fees from Abide Therapeutics, Biogen, GW Pharma, and Ipsen; received research funding from Adamas Pharmaceuticals; and received royalties from the Cleveland Clinic for licensing MSPT-related technology and from Springer Publishing. A. Boissy and D. Chizmadia report no disclosures. D.S. Conway received research support paid to his institution by Novartis Pharmaceuticals and received personal compensation for consulting for Novartis Pharmaceuticals, Arena Pharmaceuticals, and Tanabe Laboratories. C. Fink received honoraria from Teva and Sanofi Genzyme. R.J. Fox reports personal consulting fees from Actelion, Biogen, EMD Serono, Genentech, Novartis, and Teva; served on advisory committees for Actelion, Biogen Idec, and Novartis; and received clinical trial contract and research grant funding from Biogen and Novartis. S. Gales and B. Green report no disclosures. C. Hara-Cleaver received consulting fees from Novartis, Biogen, and Genentech. N. Jordan reports no disclosures. K.R. Mahajan was funded by a National Multiple Sclerosis Society Clinician Scientist Development Award (FAN-1507-05606) during the study period; received personal fees from Sanofi Genzyme; and served on an advisory board for Genentech. M.P. McGinley received fellowship funding via a Sylvia Lawry Physician Fellowship Grant through the National Multiple Sclerosis Society (#FP-1506-04742) during the study period and served on scientific advisory boards for Genzyme and Genentech. D.M. Miller served as a consultant for Hoffman-Roche, Ltd. and contributed to intellectual property that is a part of the MSPT, for which she has the potential to receive royalties. M. Namey has received consulting fees from Biogen, Sanofi Genzyme, Novartis, and Genentech and received honoraria from Acorda Therapeutics, Biogen, EDM Serono, Genentech, Sanofi Genzyme, Novartis, and Teva. A. Rae-Grant serves as an editor for EBSCO Industries; is the chair of the American Academy of Neurology Guideline Development, Dissemination and Implementation team; receives royalties for book publication from Springer and Demos publishing; and receives consulting fees from the Patient-Centered Outcomes Research Institute. M. Rensel served as a consultant or speaker for Biogen, Teva, EMD Serono, Genzyme, and Novartis and receives grant funding from the National Multiple Sclerosis Society. H. Young reports no disclosures. M. Willis serves on speakers' bureaus for Genzyme, Biogen, Novartis, and Ipsen. D. Ontaneda has received research support from the National Multiple Sclerosis Society, NIH, Patient-Centered Outcomes Research Institute, Race to Erase MS Foundation, Genentech, and Genzyme and has also received consulting fees from Biogen Idec, Genentech/Roche, Genzyme, and Merck. J.A. Cohen received personal compensation for consulting for Alkermes, Biogen, Convelo, EMD Serono, ERT, Gossamer Bio, Novartis, and ProValuate; speaking for Mylan and Synthon; and serving as an Editor of Multiple Sclerosis Journal. R.A. Bermel served as a consultant for Biogen, Genzyme, Genentech, and Novartis; receives research support from Biogen and Genentech; and contributed to intellectual property that is a part of the MSPT, for which he has the potential to receive royalties. Full disclosure form information provided by the authors is available with the full text of this article at Neurology.org/cp.
References
- 1.Capurro D, Yetisgen M, van Eaton E, Black R, Tarczy-Hornoch P. Availability of structured and unstructured clinical data for comparative effectiveness research and quality improvement: a multi-site assessment. EGEMS (Wash DC) 2014;2:1079. [DOI] [PMC free article] [PubMed] [Google Scholar]
- 2.Katzan IL, Rudick RA. Time to integrate clinical and research informatics. Sci Transl Med 2012;4:1–5. [DOI] [PubMed] [Google Scholar]
- 3.Tur C, Moccia M, Barkhof F, et al. Assessing treatment outcomes in multiple sclerosis trials and in the clinical setting. Nat Rev Neurol 2018;14:75–93. [DOI] [PubMed] [Google Scholar]
- 4.Trojano M, Tintore M, Montalban X, et al. Treatment decisions in multiple sclerosis—insights from real-world observational studies. Nat Rev Neurol 2017;13:105–118. [DOI] [PubMed] [Google Scholar]
- 5.Kurtzke JF. Disability rating scales in multiple sclerosis. Ann NY Acad Sci 1983;436:347–360. [DOI] [PubMed] [Google Scholar]
- 6.Rudick R, Miller D, Bethoux F, et al. The multiple sclerosis performance test (MSPT): an iPad-based disability assessment tool. J Vis Exp 2014;88:e51318. [DOI] [PMC free article] [PubMed] [Google Scholar]
- 7.Cohen JA, Cutter GR, Fischer JS, et al. Benefit of interferonß-1a on MSFC progression in secondary progressive MS. Neurology 2002;59:679–687. [DOI] [PubMed] [Google Scholar]
- 8.Rudick R, Polman CH, Cohen JA, et al. Assessing disability progression with the multiple sclerosis functional composite. Mult Scler 2009;15:984–997. [DOI] [PubMed] [Google Scholar]
- 9.Cohen JA, Coles AJ, Arnold DL, et al. Alemtuzumab versus interferon beta 1a as first-line treatment for patients with relapsing-remitting multiple sclerosis: a randomized controlled phase 3 trial. Lancet 2012;380:1819–1828. [DOI] [PubMed] [Google Scholar]
- 10.Kappos L, Radue E-W, O'Connor P, et al. A placebo-controlled trial of oral fingolimod in relapsing multiple sclerosis. N Engl J Med 2010;362:387–401. [DOI] [PubMed] [Google Scholar]
- 11.Cutter G, Baier M, Rudick R, et al. Development of a multiple sclerosis functional composite as a clinical trial outcome measure. Brain 1999;122:871–882. [DOI] [PubMed] [Google Scholar]
- 12.Cohen JA, Cutter GR, Fischer JS, et al. Use of the multiple sclerosis functional composite as an outcome measure in a phase 3 clinical trial. Arch Neurol 2001;58:961–967. [DOI] [PubMed] [Google Scholar]
- 13.Balcer LJ, Baier ML, Cohen JA, et al. Contrast letter acuity as a visual component for the multiple sclerosis functional composite. Neurology 2003;61:1367–1373. [DOI] [PubMed] [Google Scholar]
- 14.Ontaneda D, Larocca N, Coetzee T, Rudick RA. Revisiting the multiple sclerosis functional composite: proceedings from the National Multiple Sclerosis Society (NMSS) task force on clinical disability measures. Mult Scler J 2012;18:1074–1080. [DOI] [PubMed] [Google Scholar]
- 15.Learmonth YC, Motl RW, Sandroff BM, Pula JH, Cadavid D. Validation of patient determined disease steps (PDDS) scale scores in persons with multiple sclerosis. BMC Neurol 2013;13:37. [DOI] [PMC free article] [PubMed] [Google Scholar]
- 16.Kroenke K, Spitzer RL, Williams JBW. The PHQ-9: validity of a brief depression severity measure. J Gen Intern Med 2001;16:606–613. [DOI] [PMC free article] [PubMed] [Google Scholar]
- 17.Cella D, Riley W, Stone A, et al. Initial adult health item banks and first wave testing of the patient-reported outcomes measurement information system (PROMIS) network: 2005–2008. J Clin Epidemiol 2010;63:1179–1194. [DOI] [PMC free article] [PubMed] [Google Scholar]
- 18.Gershon RC, Lai JS, Bode R, et al. Neuro-QOL: quality of life item banks for adults with neurological disorders: item development and calibrations based upon clinical and general population testing. Qual Life Res 2012;21:475–486. [DOI] [PMC free article] [PubMed] [Google Scholar]
- 19.Cella D, Lai JS, Nowinski CJ, et al. Neuro-QOL: brief measures of health-related quality of life for clinical research in neurology. Neurology 2012;78:1860–1867. [DOI] [PMC free article] [PubMed] [Google Scholar]
- 20.Neuro-QoL. Available at: www.healthmeasures.net/explore-measurement-systems/neuro-qol. Accessed July 30, 2018.
- 21.Rao SM, Losinski G, Mourany L, et al. Processing speed test: validation of a self-administered, iPad® -based tool for screening cognitive dysfunction in a clinic setting. Mult Scler J 2017;18:1074–1080. [DOI] [PubMed] [Google Scholar]
- 22.Armitage P. Tests for linear trends in proportions and frequencies. Biometrics 1955;11:375–386. [Google Scholar]
- 23.Gauthier SA, Glanz BI, Mandel M, et al. Incidence and factors associated with treatment failure in the CLIMB multiple sclerosis cohort study. J Neurol Sci 2009;284:116–119. [DOI] [PubMed] [Google Scholar]
- 24.Kister I, Chamot E, Cutter G, et al. Increasing age at disability milestones among MS patients in the MSBase Registry. J Neurol Sci 2012;318:94–99. [DOI] [PubMed] [Google Scholar]
- 25.Arndt BG, Beasley JW, Watkinson MD, et al. Tethered to the EHR: primary care physician workload assessment using EHR event log data and time-motion observations. Ann Fam Med 2017;15:419–426. [DOI] [PMC free article] [PubMed] [Google Scholar]
- 26.Chaudhry B, Wang J, Wu S, et al. Systematic review: impact of health information technology on quality, efficiency, and costs of medical care. Ann Intern Med 2006;144:742–752. [DOI] [PubMed] [Google Scholar]
- 27.Devine EB, Van Eaton E, Zadworny ME, et al. Automating electronic clinical data capture for quality improvement and research: the CERTAIN validation project of real world evidence. EGEMS (Wash DC) 2018;6:8. [DOI] [PMC free article] [PubMed] [Google Scholar]
- 28.Le T, Wilamowska K, Demiris G, Thompson H. Integrated data visualization: an approach to capture older adults' wellness. Int J Electron Heal 2012;7:89–104. [DOI] [PMC free article] [PubMed] [Google Scholar]
- 29.U.S Food & Drug Administration. PDUFA re-authorization performance goals and procedures fiscal years 2018 through 2022. Available at: www.fda.gov/downloads/forindustry/userfees/prescriptiondruguserfee/ucm511438.pdf. Accessed July 30, 2018.
- 30.U.S Food & Drug Administration. 21st century cures act. Available at: www.congress.gov/114/plaws/publ255/PLAW-114publ255.pdf. Accessed August 14, 2018.
- 31.Rocca MA, Amato MP, De Stefano N, et al. Clinical and imaging assessment of cognitive dysfunction in multiple sclerosis. Lancet Neurol 2015;14:302–317. [DOI] [PubMed] [Google Scholar]
- 32.Weber M, Mourany L, Losinski G, et al. Are we underestimating the severity of cognitive dysfunction in MS? ECTRIMS Online Libr 2017;200266:P611. Accessed May 11, 2019. [Google Scholar]
Associated Data
This section collects any data citations, data availability statements, or supplementary materials included in this article.
Data Availability Statement
Anonymized data will be shared with qualified investigators by request to the corresponding author for purposes of replicating procedures and results.


