. 2020 Jun 1;9:e55096. doi: 10.7554/eLife.55096

Figure 2. More than one high affinity MELT motifs are necessary to minimize chromosome loss.

(A) Effects of benomyl on chromosome biorientation. Left: Kinetics of chromosome IV biorientation visualized using a centromere-proximal TetO array. Micrographs depict representative images of cells showing fluorescently labeled TetR-GFP bound to the TetO array and Spindle Pole Bodies (SPB). Scale bar ~3.2 µm. Second from the left: Quantification of the fraction of cells with bioriented chromosome IV. Note that the reduced fraction of untreated cells with bioriented chromosomes 105 min after release from G1 is because most cells complete anaphase by this time. (n = 259, 252 and 398 at 45, 75 and 105 min respectively in normal media, one repeat. n = 855, 816 and 626 respectively at 45, 75 and 105 min in benomyl-containing media from three technical repeats). When the two CENIV foci were unresolvable and localized in the vicinity of one of the two SPBs, they were scored as monopolar attachments. When the two CENIV foci were clearly separated from each other and located along the spindle axies, they were considered to be bioriented. Middle: Representative micrographs of cells grown in benomyl media containing unattached kinetochores recruiting Bub1. Arrow heads indicate the unattached kinetochores with Bub1 localizations. Scale bar ~3.2 µm. Right: Quantification of the number and frequency distribution of unattached kinetochores in yeast cells growing in media containing benomyl. The unattached kinetochore number was estimated by comparing the Spc105-GFP fluorescence from the unattached kinetochore cluster (marked by Bub1-mCherry recruitment) with the total fluorescence from the kinetochores along the spindle axis. (n = 686, 501 and 543 at 45, 75 and 105 min respectively, pooled from two technical repeats). Red dashed line in relative frequency plot indicates the average number of unattached kinetochores observed after 90 min nocodazole treatment of wild type yeast cell (Aravamudhan et al., 2016). (B) Left: Micrograph displays representative cells in metaphase and anaphase in benomyl-containing media. Scale bar ~3.2 µm. Right: Quantification of the number of anaphase cells observed after the indicated time following release from a G1 arrest for the indicated strains. (mean+ s.e.m, n = 1029, 889 and 992 at 45, 75 and 105 min respectively for WT cells, pooled from three experimental repeats. n = 890, 864 and 812 at 45, 75 and 105 min time points respectively for #2,6, pooled from three technical replicates). (C) Top: Schematic of the Spc105 phosphodomain with the amino acid sequence indicated at the top. Bottom: Quantification of the evolution of cell density of the indicated strains in rich media (left) and media-containing benomyl (right). (D–E) Assessment of the sensitivity of yeast strains to benomyl using the spotting assay. Schematics on the left show the active motif number and its position. The blue bar represents the ‘basic patch’ in Spc105, which promotes PP1 recruitment. The photographs on the right show the results of spotting a serial dilution of yeast cells on rich media (YPD) and media containing benomyl (20 or 30 μg/ml). (F) Assessment of chromosome loss by colony sectoring assay. Left: Images of WT, mad1Δ and #4–6 colonies grown in YPD plates. Right: Bar graph shows the rate of loss of SUP11 containing chromosome fragment measured as the number of red/half red colonies (example shown on the right) for every 1000 colonies plated. N = 5081, 4406 and 4965 for WT, mad1Δ and #4–6 respectively, pooled from at least six technical repeats.

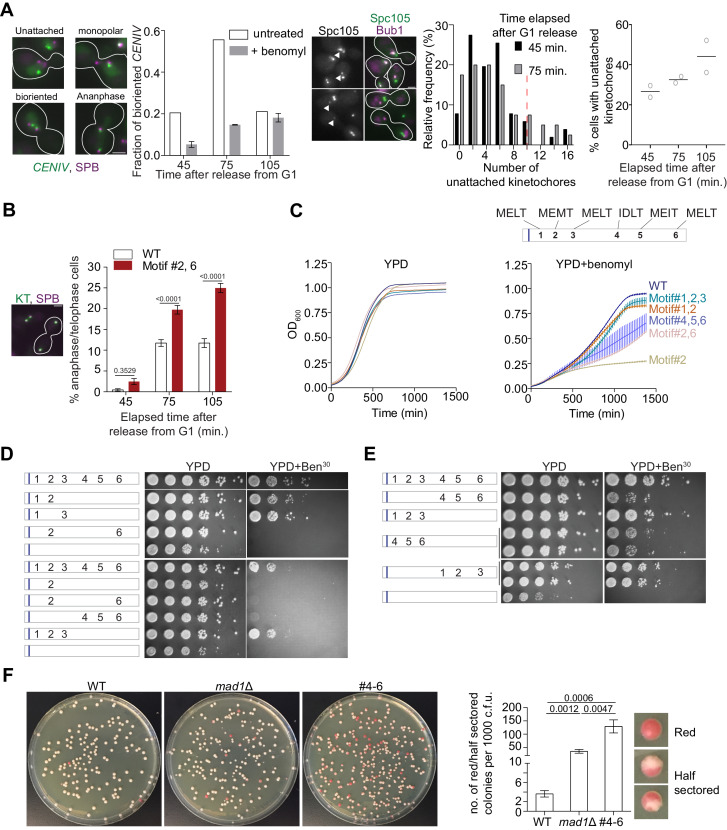
Figure 2—source data 1. Data for graphs depicted in Figure 2A, B, C and F.
Individual pages were created in the excel file for each subfigure.

Figure 2.

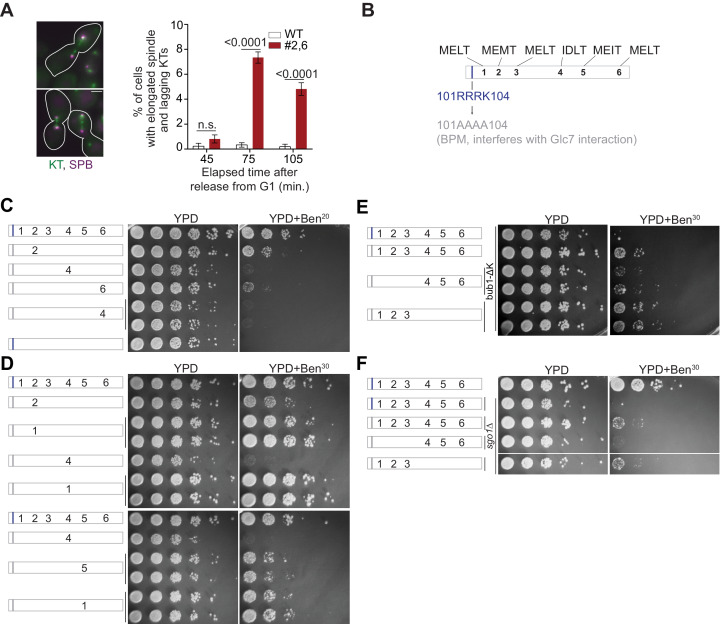
Figure 2—figure supplement 1. Requirements of the MELT motif number per Spc105 and their affinity for survival on media containing benomyl.

Figure 2—figure supplement 1.

(A) Quantification of cells of indicated strains showing an elongated spindle, which is indicative of anaphase onset. (mean+ s.e.m., n = 1029, 889 and 992 at 45, 75 and 105 min respectively for WT, n = 890, 864 and 812 at 45, 75 and 105 min respectively for #2,6, pooled from three technical repeats). n.s. Not significant. (B) Schematic of the Spc105 phosphodomain with the amino acid sequence indicated at the top. The 101-RRRK-104 span is designated as the anterior basic patch of Spc105. It is implicated in the binding of PP1 to Spc105 (Roy et al., 2019). (C–F) Benomyl-sensitivity of the indicated strains. Schematic on the left displays the number and position of active MELT motifs. The gray bar indicates that the basic patch is replaced by non-polar alanine residues (101-RRRK-104::AAAA). This mutation, either abbreviated as BPM or denoted as Spc105BPM, results in reduced PP1 binding to Spc105 (Roy et al., 2019). It does not increase the strength of SAC signaling from unattached kinetochores, but results in a modest SAC silencing defect. Importantly, reduced PP1 binding to Spc105 significantly improves chromosome biorientation. Consequently, even SAC deficient yeast cells can grow on benomyl (Roy et al., 2019). (C) We previously found that mutants expressing Spc105-5A are inviable in presence of benomyl (Aravamudhan et al., 2016). Mutation of the basic patch (gray bar) suppresses that sensitivity of Spc105-5A variants only if the MELT motif possesses the optimal, consensus sequence. The benomyl sensitivity of the sixth MELT motif in this assay is surprising given that this motif possesses the consensus amino acid sequence. We speculate that the lower activity is due to the absence of the negatively charged residue directly downstream from the MELT motif, which contributes to the interaction of the MELT motif with the Bub3-Bub1 complex (Primorac et al., 2013). (D) The activity of a MELT motif is determined by its sequence, but not position. (E–F), The benomyl sensitivity of strains expressing Spc105BPM with either #1–3 or #4–6 motifs as active MELT motifs along with either bub1Δkinase or sgo1Δ. The basic patch mutation is necessary, because it alleviates partially suppresses the lethality of bub1Δkinase and sgo1Δ in benomyl containing media (Roy et al., 2019).
Figure 2—figure supplement 1—source data 1. Data required for the graph shown in Figure 2—figure supplement 1A.
Figure 2—figure supplement 2. Multiple, strong MELT motifs per Spc105 are essential for cell survival when chromosome biorientation is challenged by conditionally disrupting the mitotic Cik1 functions.

Figure 2—figure supplement 2.

(A) Effect of Cik1-CC overexpression (stimulated by the use of galactose as the carbon source) on the indicated strains. (B) Micrographs on the left show the scoring scheme used to identify cells in anaphase and those with elongated spindles, which are indicative of anaphase onset (but cannot be confirmed as anaphase). Bar ~3.2 µm. Scatter and bar plots on the right show quantification. (n = 694 and 476 at 105 and 135 min respectively for WT and 547 and 317 at 105 and 135 min respectively for #2,6 from two repeats).
Figure 2—figure supplement 2—source data 1. Data needed for the plots shown in Figure 2—figure supplement 2B top right and 2B bottom right.
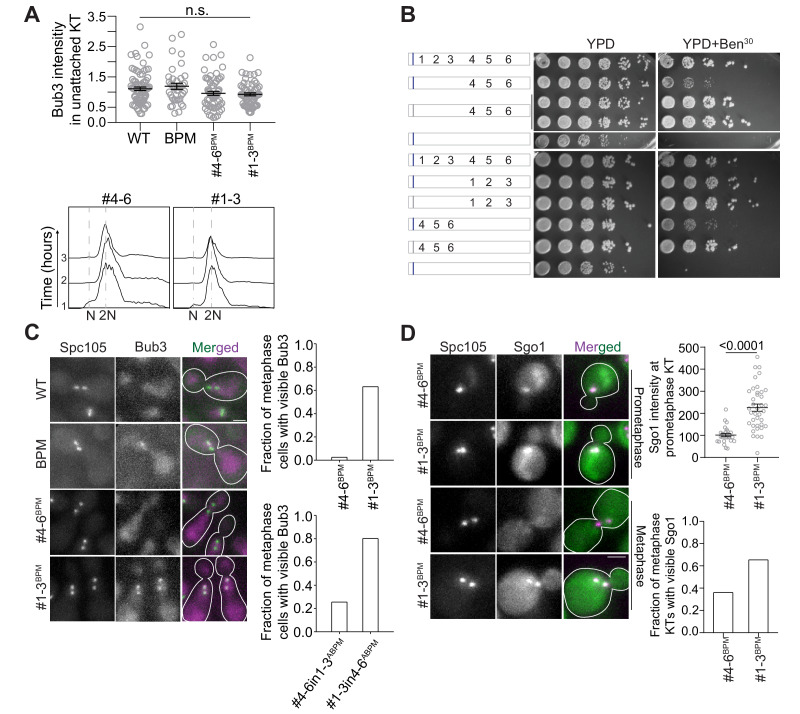
Figure 2—figure supplement 3. The difference in the SAC signaling activities of the first three and last three MELT motifs in Spc105 is detectable in benomyl-containing media, but not in cells treated with nocodazole.

Figure 2—figure supplement 3.

(A) Top left: Scatter plot revealing the intensity of Bub3-mCherry in unattached kinetochores of indicated strains when the cells were treated with nocodazole for 2 hr. (mean+ s.e.m. n = 82, 39, 67 and 59 for WT, BPM, #4-6BPM and #1-3BPM respectively, accumulated from two repeats). Bottom left: Representative flow cytometry-based quantification of the DNA content of the indicated strains during a prolonged exposure to nocodazole. (B) Benomyl spotting assay of indicated strains. Schematic on the left shows the number and position of active MELT motifs. The basic patch at the N-terminus is indicated by the blue bar; gray bar indicates that the basic residues in this patch are replaced by non-polar alanine residues. Mutation of anterior basic patch alleviates the growth of strains expressing Spc105#4-6, independently of the positions of #4–6 in Spc105 phosphodomain. (C) Representative images show the recruitment of Bub3-mCherry to bioriented kinetochore clusters in the indicated strains. Bar ~3.2 µm. Right: Bar graphs show the fraction of metaphase cells with Bub3 recruited at the kinetochores in CDC20 depleted (top) and cycling (bottom) population of the indicated strains. Top: n = 116 and 106 for #4-6BPM and #1-3BPM respectively, pooled from two biological replicates for each strain. Bottom: n = 90 and 96 for #4-6in1-3 and #1-3in4-6 respectively, accumulated from two biological replicates for each strain. n.s. Not significant. (D) Left: Representative micrographs showing the colocalization of Sgo1-GFP with kinetochore clusters undergoing biorientation and after biorientation (kinetochores visualized by Spc105222:mCherry, scale bar ~3.2 μm). Right: Scatter plot at the top displays the quantification of Sgo1-GFP colocalized with prometaphase kinetochores. n = 26 and 38 for #4-6BPM and #1-3BPM respectively, pooled from two technical repeats, p<0.0001, derived from Mann-Whitney test. Bar plot at the bottom displays the scoring of cells wherein Sgo1-GFP visibly colocalizes with bioriented kinetochore clusters. n = 133 and 84 for #4-6BPM and #1-3BPM respectively, pooled from two experimental repeats, p<0.0001, derived from Fisher’s exact test.
Figure 2—figure supplement 3—source data 1. Data required in the graphs mentioned in Figure 2—figure supplement 3A top, C right top, C right bottom, D right top and D right bottom.
Individual pages were created in this file for each subfigure.