Abstract
Theoretical and numerical models were developed to calculate the polariscopic integrated light intensity that forms a projection of the dynamic stress within an axisymmetric elastic object. Although the model is general, this paper addressed its application to measurements of stresses in model kidney stones from a burst wave lithotripter for stone fragmentation. The stress was calculated using linear elastic equations, and the light propagation was modeled in the instantaneous case by integrating over the volume of the stone. The numerical model was written in finite differences. The resulting images agreed well with measured images. The measured images corresponded to the maximum shear stress distribution, although other stresses were also plotted. Comparison of the modeled and observed polariscope images enabled refinement of the photoelastic constant by minimizing the error between the calculated and measured fields. These results enable quantification of the stress within the polariscope images, determination of material properties, and the modes and mechanisms of stress production within a kidney stone. Such a model may help in interpreting elastic waves in structures, such as stones, toward improving lithotripsy procedures.
I. INTRODUCTION
Photoelastic imaging is a well-known method for studying mechanical stress. Certain transparent materials that are optically isotropic when unstressed become anisotropic and, thus, birefringent when stressed. This property allows visualization of stresses in optically transparent solids, such as plastics, using polarized light.1 When light propagates through a stressed material, the state of polarization changes depending on the local stress, and those changes are accumulated from point to point along the optical path. Therefore, the polariscope provides a projection image of the stress field.
Polariscope imaging of transient stress, i.e., dynamic photoelastic imaging, is more challenging as it requires short light exposures to freeze stress patterns during illumination. Dynamic photoelastic imaging has been used in fracture mechanics and related fields for a number of decades already,2 and many authors have applied this technique to study stress created by elastic waves.3–7 Use of such imaging to study stress in kidney stone phantoms created by lithotripter shock waves was first published by Xi and Zhong.8 Such studies have helped identify and confirm the mechanisms leading to stone fracture by this noninvasive technology. In a recent paper by the present authors, the dynamic polariscope was used to study stone fragmentation mechanisms in relation to burst wave lithotripsy.9 Burst wave lithotripsy uses cyclic pulses of focused ultrasound rather than singular shock waves to noninvasively fragment kidney stones.10 The stone fracture, in this case, differs from shock wave lithotripsy, and photoelastic imaging has been a primary method used to identify elastic waves occurring as a result of this acoustic exposure.
Theoretical reconstruction of photoelastic fringe patterns is easier for simplified geometries, e.g., for thin plates or uniformly stressed specimens. Typical examples and the corresponding literature reviews can be found in books on photoelasticity.1,11 In more general cases, such as kidney stones, the analysis may be more cumbersome. Because the image is an integration of light through the volume displayed as a projection, the complex pattern of the image may be impossible to decipher without some type of numerical modeling which can provide additional interpretation of the image in terms of stress. Such elastic wave models have been employed to identify mechanisms of lithotripsy12,13 and are supported by experimental observations of stone fracture.14
In the current paper, we present a theoretical recipe to perform numerical modeling of polariscope images when mechanical stresses are created by a focused ultrasound wave in solid cylindrical objects mimicking kidney stones. A theoretical approach is developed and implemented using finite-difference calculations of acoustical and optical fields, and the theoretically predicted fringe patterns are compared with experimental results. In the experiment, a high-speed camera was used to record images of an epoxy stone model during exposure to ultrasound waves generated by a focused source.
II. MATERIALS AND METHODS
A. Theoretical model of a polariscope
An optical ray propagating through a stressed material is considered. To analyze the case when stresses are inhomogeneous along the optical path, it is convenient to perform the analysis from first principles, based on Maxwell's equations. In many cases, including phenomena studied in the current work, the anisotropy created by mechanical stress is weak, and, thus, the corresponding light propagation can be considered as a process of a slowly accumulating change of the wave polarization. An elegant approach for analyzing such a case was developed by Ginzburg;15 more detail can be found in the literature.11 Here, we implement this theory as finite-difference modeling of mechanical stresses in a cylindrically shaped solid object mimicking a kidney stone.
Maxwell's equations in a dielectric nonmagnetic medium provide and , where is the magnetic field, is the electric field, is the electric displacement field, and is the velocity of light in a vacuum. For harmonic processes , the aforementioned equations result in the following wave equation:
| (1) |
For linear anisotropic media, the electric displacement can be expressed through the electric field by the following three relationships:
| (2) |
where is the permittivity tensor.
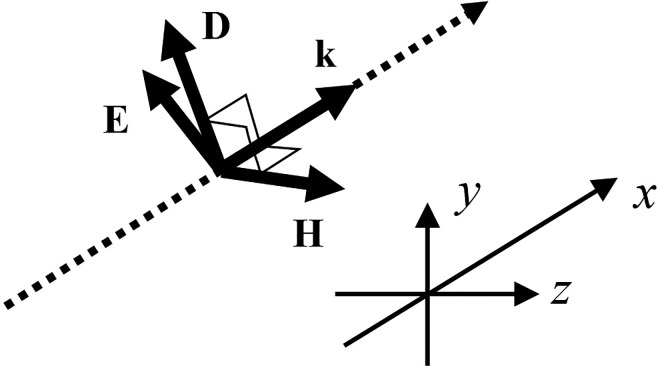
In most practical cases, the characteristic scale of inhomogeneities associated with mechanical stresses is much larger than the optical wavelength. As a result, the propagation of light through a stressed medium can be studied in the geometrical optics approximation, i.e., by considering rays. Moreover, in short distances, the effect of the ray bending (refraction) can be neglected, and, therefore, those rays can be considered as straight lines. Let us consider a collimated light beam entering the object under study. This optical beam can be represented by a family of parallel rays that propagate, say, along the x axis of a Cartesian coordinates system (see Fig. 1, where a ray is shown as a dashed line). The electromagnetic field propagating along a ray can be considered as a plane wave , where vectors and are perpendicular to the wave vector , which is directed along the x axis. In such a wave, the electric field vectors and in Eq. (1) depend only on the propagation coordinate x, and, therefore, Eq. (1) is reduced to the following two equations:
| (3) |
| (4) |
FIG. 1.
Orientation of the electromagnetic wave vectors relative to the coordinate axes.
From , it follows that . Therefore, according to the first of the three equalities of Eq. (2), . The second and third equalities can then be written as follows:
| (5) |
| (6) |
The undisturbed medium is isotropic, i.e., , where is the Kronecker delta, and is the permittivity in the absence of stresses. We assume the anisotropy to be weak, so the non-diagonal tensor components () are small. Neglecting such second-order terms, from the previous equations, we can write
| (7) |
and
| (8) |
Note that Eqs. (7) and (8) follow directly from Eq. (2) if we neglect the longitudinal component of the electric vector, . It is convenient to rewrite Eqs. (7) and (8) in the following forms:
| (9) |
and
| (10) |
Here, the perturbations of diagonal elements , , and the off-diagonal element arise because of mechanical stresses and are small. Equations (3) and (4) then become
| (11) |
and
| (12) |
where is the wavenumber in a non-stressed medium. In the absence of stresses, the right-hand sides of Eqs. (11) and (12) disappear, which gives the solutions in the form of a plane wave: and , where and are constants. When the stresses are present, it is convenient to write the solution in the same form but with the amplitudes varying along the propagation distances , . Substituting these expressions in Eqs. (11) and (12), we obtain
| (13) |
and
| (14) |
These equations are equivalent to Eqs. (11) and (12), but better suited to apply the classical method of the slowly varying amplitude approximation,16 which considers the distortions caused by stress to be small. Indeed, because the right-hand sides of both Eqs. (13) and (14) are small, the first terms on the left-hand side are of the same order of smallness, and, thus, the second terms are even smaller: . Neglecting them, we obtain the following equations:
| (15) |
and
| (16) |
Here,
| (17) |
For an isotropic medium and elastic deformations, the following relationship between the dielectric tensor and the stress tensor holds:1
| (18) |
where is the Kronecker tensor, and and are constants. Taking into account Eq. (18), from Eqs. (15) and (16), we obtain the following equation for the electrical field vector:
| (19) |
where
are renormalized electric field complex amplitudes. Also, , , and is the wavelength of light in a vacuum. Therefore, only the constant plays a role in the change of the polarization; the other constant, , does not influence the process. Note that the constant is marked as in Eq. (1.13) of Ref. 11. With the use of , we have the following expressions for the electric vector components:
| (20) |
The light intensity is proportional to . From Eq. (19), it follows that
i.e., energy is conserved as it should be.
The general solution of Eq. (19) can be expressed in the following form:
| (21) |
where is the Jones matrix,17 and and are the electric vector components at the entrance to the medium. The Jones matrix can be represented in the following way:
| (22) |
where , i.e., is a unitary unimodular matrix.11 The latter expression directly follows from the fact that . In Eq. (22), complex numbers and are functions of the stress distribution between the points of entrance and exit of the corresponding ray that propagates through the stressed specimen. To find and numerically for a known stress field, it is sufficient to consider the propagation of linearly polarized light of vertical polarization and unit amplitude: and . As seen from Eqs. (21) and (22), in such a case at the exit from the medium, and . Once the Jones matrix is found, the propagation of light with arbitrary polarization can be calculated.
Experimental analysis of stresses in a photoelastic object is performed using a polariscope—an optical device in which the object is illuminated by polarized light.11 A specimen under study may be positioned in a bath submerged in a liquid that has the same refractive index as the specimen to minimize reflection and refraction effects at the interfaces.18 The liquid is also chosen to acoustically match to the surrounding water as closely as possible to minimize acoustic effects as well.
The simplest example is a so-called plane polariscope—an arrangement in which the specimen is placed between two linear polarizers (referred to as the polarizer and analyzer on the light transmission and reception sides, respectively). To simulate a plane polariscope, the boundary condition at the point where light enters the specimen should correspond to a linearly polarized light beam created by the polarizer; by taking and , where is the angle between the polarizer axis direction and the vertical axis y, and is the initial wave amplitude. After the ray passes through the sample, the electric vector changes in accordance with Eq. (21), and, in the general case, the wave becomes elliptically polarized. It then passes through the analyzer, i.e., the output electrical vector is projected to the direction of the analyzer axis oriented at an angle relative to the vertical axis. This gives the following expression for the output amplitude: . The corresponding intensity provides the photoelastic image. Light intensity of the undisturbed background follows Malus's law, i.e., intensity is proportional to . In particular, when (the polarizer and analyzer axes are perpendicular), the background is dark.
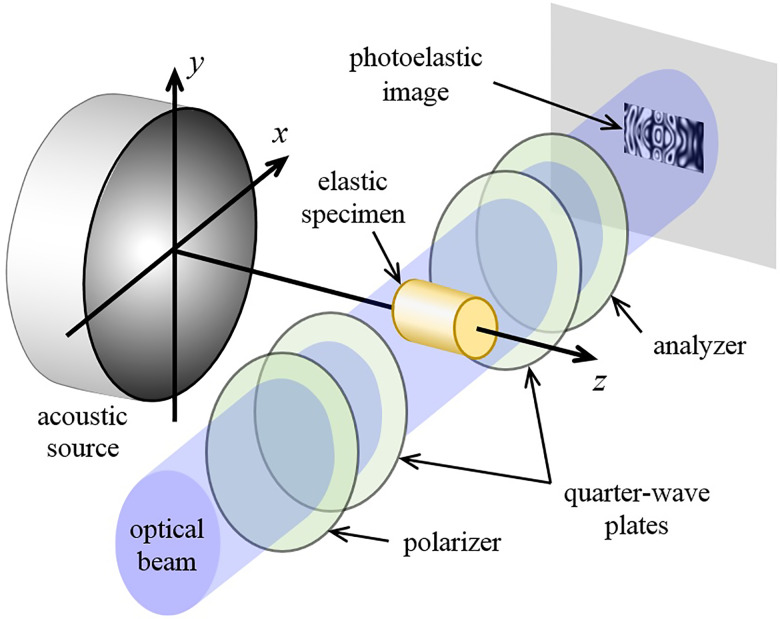
A circular polariscope is another more convenient arrangement, which employs circularly polarized light for the specimen illumination (Fig. 2). To create circularly polarized light, the plane polariscope is modified by adding two properly orientated quarter-wave plates. One of these plates is placed after the polarizer in front of the specimen, and another plate is placed behind the specimen in front of the analyzer. Suppose the polarizer is turned by relative to the vertical axis, then, , . Let the fast axis of the first quarter-wave plate be oriented horizontally, i.e., a 90° phase shift is created between and . Then, for Eqs. (23) and (24), we have the following boundary conditions: and . After passing through the specimen, the electrical field components and are modified in accordance with Eq. (21) and, then, additionally changed by the subsequent quarter-wave plate. If the fast axis of this plate is directed vertically, a 90° phase shift is added to the z component: . The analyzer filters the projection and, thus, provides . From here, for , the output amplitude is . The corresponding intensity distribution provides the photoelastic image. Note that the benefit of the circular polariscope is that the photoelastic image is insensitive to the orientations of the polarizer and analyzer relative to the specimen, and only their mutual orientation plays a role. This setup, therefore, simplifies interpretation of the experimental data.
FIG. 2.
(Color online) Geometry of the experiment. An acoustic source produces a focused ultrasound burst, which propagates along the axis of an elastic specimen (z axis). A photoelastic image is formed with the use of a circular polariscope consisting of a polarizer, two quarter-wave plates, and an analyzer. A collimated optical beam from a pulsed light-emitting diode (LED) is projected onto the specimen along the x axis.
B. Theoretical model for elastic waves in an axisymmetric stone
The equations presented above allow calculation of a photoelastic image in the case where the mechanical stress distribution does not depend on time. This is a reasonable approximation, even for dynamic photoelasticity imaging, because dynamic or time varying stresses are associated with elastic waves, which propagate with velocities that are typically 5–6 orders of magnitude smaller than the speed of light. Therefore, time-dependent photoelastic images can be modeled based on instantaneous distributions of mechanical stress. It is, thus, convenient to perform the calculation of a photoelastic image together with the calculation of the mechanical stress so that optical modeling is performed at every time step of the acoustical modeling.
Mechanical strains and stresses in brittle materials, such as kidney stones, can be calculated using a linear elastic model.12,14 The elastic specimen and immersion liquid are considered as mechanically isotropic media. We consider, here, an axially symmetric case where the specimen (a model kidney stone) has an axisymmetric shape with the axis of symmetry oriented along the direction of acoustic wave propagation. It is, then, convenient to use cylindrical coordinates , where r and z are the radial and axial distances, respectively, is the radial coordinate, and is the azimuth angle. Because of the axial symmetry, the velocity vector has only two components: radial, vr, and axial, vz, and the stress tensor has only four nonzero components: . These six functions describing the mechanical field are governed by the following evolution equations:12
| (23) |
| (24) |
| (25) |
| (26) |
| (27) |
| (28) |
Here, and are the Lamé constants, and is the mass density. In the numerical modeling, it is convenient to consider the liquid and elastic objects as one inhomogeneous medium whose parameters , , and are functions of the coordinate locations. The parameters are related to the longitudinal sound speed, , and shear wave speed, .
Equations (23) and (24) represent Newton's second law of motion, and the remaining four equations, Eqs. (25)–(28), correspond to Hooke's law. Using the stress-strain relation in the form of Hooke's law, we did not take into account the dissipation of elastic energy. Although viscoelastic terms could easily be included in the model, they were omitted in the present study for simplicity. In our previous study, we estimated the acoustic attenuation in epoxy to be approximately 3 dB/cm/MHz.9 With this absorption coefficient, the amplitude of the ultrasonic burst changes by only 25% when passing through a stone 20 mm long. Therefore, it is minimal for a single pass through the specimen. That is, such attenuation will only affect the amplitude of the stresses over a longer period after the ultrasound burst falls on the specimen but will not change the pattern of stresses, which was the main interest in the current study.
To solve Eqs. (23)–(28) in finite differences, the partial differential equations are discretized using a central differencing scheme with staggered grids in both space and time.12,14 Velocity and stress in the elastic specimen and surrounding liquid are initially set to zero. To account for an incident acoustic wave, a proper boundary condition is set at the calculation box boundary and is described as follows.
The calculation region is rectangular on the plane, which corresponds to a cylindrical region in three-dimensional (3D) space. The typical spatial grid steps for the coordinates z and r were 50 μm, and the temporal step was 10 ns, which is sufficient to maintain stability and accuracy. A perfectly matched layer (PML) layer of 1.5-mm thickness is placed at the boundary of the calculation region. A cylindrical elastic specimen is represented by a rectangle placed in the center of the calculation region. The diameter of the specimen and the acoustic and optical parameters of the specimen and immersion liquid are given in Table I.
TABLE I.
Stone dimensions and properties of the materials used in the experiment and modeling. The stone is made from a low-viscosity infusion epoxy (Wessex Resins and Adhesives, Hampshire, UK). The photoelastic constant was estimated from the polariscope images for blue light with a 0.45 μm wavelength. The immersion liquid is Benzyl benzoate (Sigma-Aldrich Corp., MO), which has a refractive index matching the epoxy. Hydrophone measurements were performed in water, and the water values are used to convert the pressures to those obtained in the immersion liquid. Acoustically, the liquid and water are well matched to minimize the effect on the acoustics. The low index of refraction of water also shows why the immersion liquid was needed.
| Parameter | Value |
|---|---|
| Stone length (mm) | 20.8 |
| Stone diameter (mm) | 6.3 |
| Stone density, ρ (kg/m3) | 1100 |
| Stone longitudinal velocity, cl (m/s) | 2440 |
| Stone shear velocity, ct (m/s) | 1295 |
| Stone refractive index, n | 1.58 |
| Stone photoelastic constant, C0 (Pa−1 m−1) | 2.4 × 10⁻⁴ |
| Immersion liquid density, ρ (kg/m3) | 1100 |
| Immersion liquid speed of sound, c (m/s) | 1493 |
| Immersion liquid refractive index, n | 1.58 |
| Water density, ρ (kg/m3) | 1000 |
| Water speed of sound, c (m/s) | 1500 |
| Water refractive index, n | 1.33 |
The problem considered in the modeling is related to burst-wave lithotripsy (BWL)—a method for noninvasive kidney stone fragmentation using focused ultrasound bursts.10 To set the corresponding boundary condition in the numerical model, it is supposed that on the left side of the calculation box at the plane (at the interface of the PML), the normal component of the particle velocity represents a focused beam with a bell-curve distribution of its amplitude in the lateral direction and a tone-burst dependence in time. The acoustic pressure waveform at the focus in the absence of the specimen, , and the corresponding lateral beamwidth at the -6 dB level, , have been measured experimentally. For the considered tone burst at the central frequency of 340 kHz, the beamwidth equals 5.0 mm. These experimental data were used to set the parameters of an equivalent quasi-Gaussian beam, which represents an exact analytical solution of the Helmholtz equation for a continuous wave (CW) field:19
| (29) |
Here, is the complex amplitude of a CW acoustic pressure field and represents the spectral component at circular frequency , where is the axial coordinate, is radial (transversal) coordinate, is the wavenumber, and is the characteristic diffraction length.
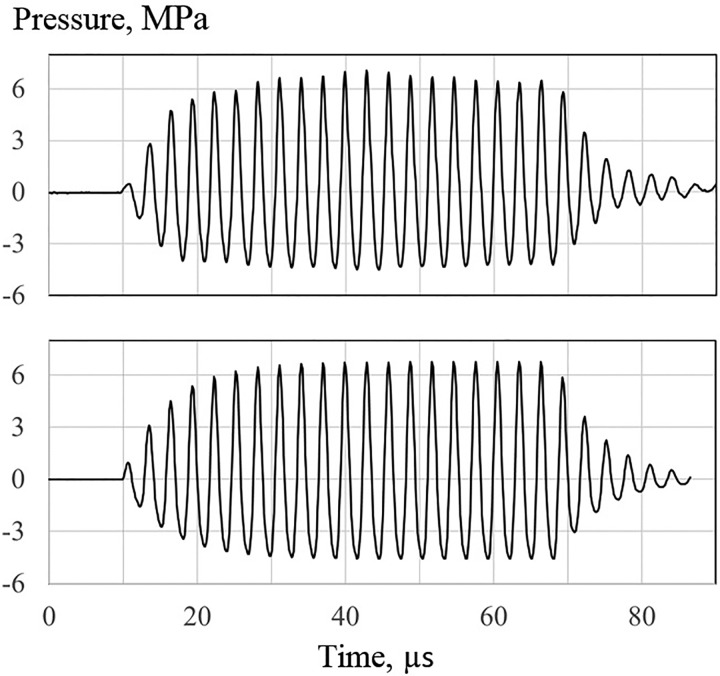
Equation (29) describes an axisymmetric focused beam with its focal waist located at . The focal amplitude of a spectral component at frequency is calculated using the Fourier transform of the experimentally measured focal pressure . According to Eq. (29), for , the radial distribution of the spectral amplitude in the focal plane has the following Gaussian shape: . From here it follows that the radius of the quasi-Gaussian beam in the focal plane is related to the experimentally determined beamwidth as follows: . Once the and are calculated from the experimental measurements, the spectrum of the equivalent quasi-Gaussian beam is completely defined by Eq. (29). The spectral amplitude for the z-component of the particle velocity, , is analytically expressed from the pressure spectral amplitude, , as follows: . The corresponding expression for is somewhat unwieldy and not presented here. The particle velocity at the source boundary is, then, calculated using the inverse Fourier transform of . To check the correctness of the set boundary condition, the focal pressure waveform was calculated by the finite-difference algorithm and compared with the measured waveform in the absence of the elastic specimen. The two waveforms coincided with a high accuracy, which was also an indication of the high precision of the finite-difference algorithm.
C. Coupling of the polariscope operation with the elastic wave model
Finite-difference modeling of Eqs. (23)–(28) provided spatial distributions of stress tensor components in the grid points of the calculation region at every calculation time step. The stress tensor components were used to calculate the corresponding photoelastic image.
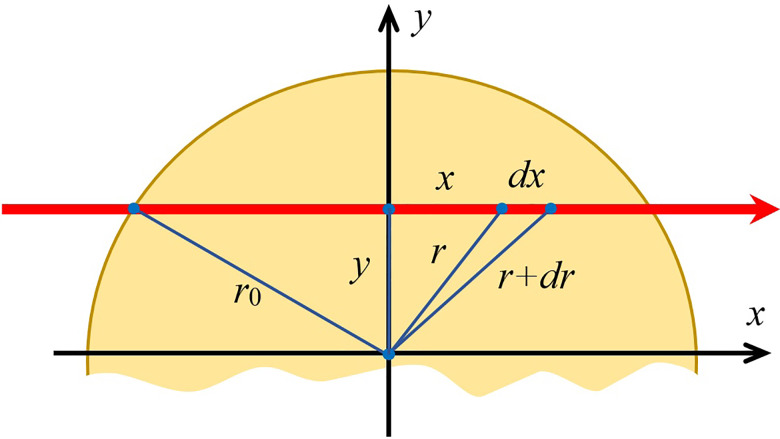
Figure 3 describes the geometry of the problem and the orientation of the light ray relative to the cylindrical specimen.
FIG. 3.
(Color online) The cross-sectional geometry of an optical ray traversing the elastic specimen. The index of refraction of the liquid surrounding the cylinder has been matched to the index of refraction of the cylinder to minimize light refraction.
In the case of axial symmetry of both the specimen and acoustic field, it is convenient to represent the stress tensor in cylindrical coordinates: and , where is the radial coordinate, and is the azimuth angle. For an optical ray directed along the x axis, and . The spatial derivative along the ray is . Equations (19) and (20) can be written, respectively, as follows:
| (30) |
and
| (31) |
and they should be integrated first from to using , and then from to using , where is the radius of the cylindrical specimen (see Fig. 2). As was noted earlier, the Jones matrix elements are calculated by considering linearly polarized light with and .
The square-root terms in Eqs. (30) and (31) create integrable singularities when . In the numerical modeling of Eqs. (30) and (31), at each integration step , it is useful to apply the following analytical expressions for exact differentials:
| (32) |
| (33) |
| (34) |
| (35) |
For Eqs. (23) and (24), we obtain the boundary conditions and . After passing the specimen, the electrical field components and are modified by the subsequent quarter-wavelength plate. If its fast axis is now directed vertically, a phase shift is added to the z component, . The analyzer filters the projection , and so for , the output amplitude is . The corresponding intensity distribution is produced in the photoelastic image.
D. Experimental arrangement
The ultrasound source was a focused piezoelectric transducer, which radiated a tone burst shown in Fig. 4. The transducer was placed in a water bath.
FIG. 4.
Pressure waveform at the focus measured by the fiber-optic hydrophone in water (upper) and obtained using finite-difference modeling (lower).
The test samples were made of an epoxy (INF 114/212; West System, Bay City, MI), which, in addition to optical transparency, is known to exhibit noticeable birefringence under stress. Velocities of elastic waves in the epoxy are 10%–15% below the lower end of the range for human urinary stones, and the epoxy density is also somewhat lower than that of the stones; these differences are not very large, and, therefore, epoxy samples are convenient models for the stones.8,9
Since water has an optical refractive index essentially different from epoxy (1.33 vs 1.58; see Table I), significant refraction would occur on the curved (cylindrical) surface if it is placed in water because of the refraction associated with oblique incidence, and the optical rays would cease to be collimated. To avoid refraction effects, the specimen was immersed in a chamber filled with benzyl benzoate (Sigma-Aldrich Corp., St. Louis, MO)—a liquid having the same refractive index, n = 1.58, as that of the specimen and similar acoustic impedance to water (see Table I). The chamber had plane optically transparent glass windows at its side walls, which also prevented refraction for the normally incident light beam. The proximal side of the chamber facing the ultrasound source, as well as the distal side, were made from a thin plastic film which was acoustically transparent. The specimen was fixed in the middle of the chamber with the use of three thin spring-loaded pins. The chamber was suspended in a degassed water bath using a 3D positioning system, which allowed proper alignment of the specimen, so that its center coincided with the transducer focus.
The light source was a 450-nm, pulsed light-emitting diode (LED). A field-programmable gate array (FPGA) timing board was used to provide timed, staggered flashes of ∼200-ns duration. The LED was strobed once per ultrasound pulse with the delay between the transducer output and the LED flash incremented 100 ns for each ultrasound pulse to capture a different time point in the wave progression in a stroboscopic fashion. Two condenser lenses were used to produce a nearly collimated light beam. This beam was used as a source in the circular polariscope in the brightfield configuration, whose arrangement was described earlier in Sec. II A. A high-speed camera (APX RS; Photron, Tokyo, Japan) was positioned facing the light source and focused on the stone. The camera was triggered to capture one frame for each ultrasound pulse, synchronized so that the exposure of the 200 ns LED flash determined the effective exposure time of each camera frame. More details on the experimental arrangement can be found in our previous publication.9
III. RESULTS
A. Combined modeling of mechanical stresses and photoelastic images
Finite-difference modeling of the elasticity equations, Eqs. (23)–(28), provided instantaneous spatial distributions of the particle velocity and stress tensor components in the specimen and surrounding liquid. To characterize the stresses, it is informative to use the maximum principal tensile stress, ,12 because brittle materials, such as kidney stones, are typically weakest in tension. In the considered axisymmetric case, the three principal stresses are and . The maximum principal tensile stress is, then, . In the immersion fluid, shear stresses are absent, and the maximum principal tensile stress is the opposite of acoustic pressure, where compression not rarefaction is positive. For each calculation time step, light propagation equations (29) and (30) were numerically integrated, which provided a two-dimensional (2D) distribution of the polariscope light intensity. The calculated 2D intensity distributions were collected for the duration of 0.2 μs (to match the experiment) and then averaged. As a result, the numerical algorithm provided a predicted polariscope image to compare with the experimentally measured polariscope image.
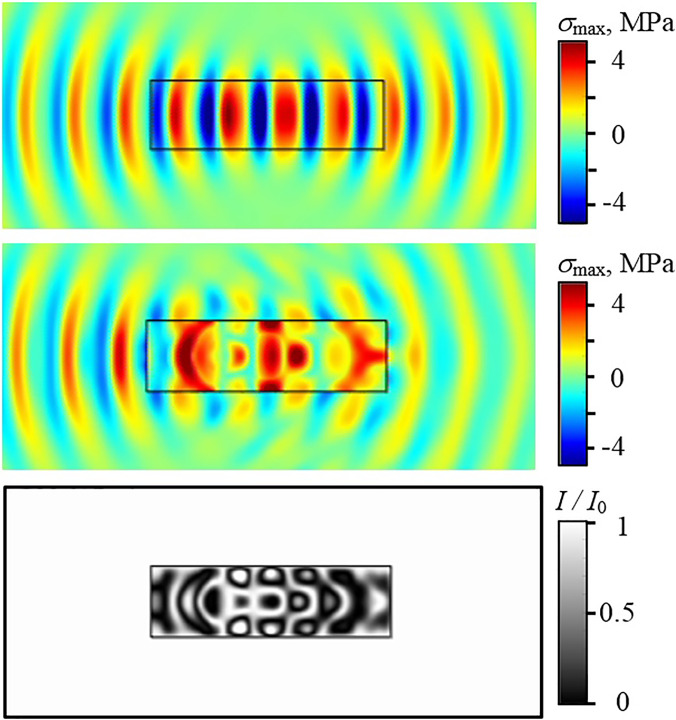
A typical result is shown in Fig. 5. Here, the upper image shows an instantaneous pattern of the maximum principal stress distribution in the absence of the specimen (its border is shown by a rectangle). It is seen that the acoustic wave has a desired form of a focused tone burst with the focal width close to the diameter of the specimen. The center image shows the maximum principal stress in the presence of the specimen. The stress distribution is now different because of reflections from the interface and the generation of longitudinal and shear waves inside the specimen. The lower picture depicts the predicted photoelastic image showing a 2D distribution of the light intensity at the output of the polariscope, I, averaged within a 0.2 μs interval and normalized by the light intensity outside the specimen, I0 (i.e., the background intensity). It is seen that, although the photoelastic image corresponds to the principal stress distribution in the central plane of the specimen, the details of the distributions are somewhat different. However, the photoelastic image clearly reveals the elastic waves inside the specimen and shows the regions of different magnitudes of stress.
FIG. 5.
(Color online) Typical patterns for the finite-difference modeling of the maximum principal mechanical stress, σmax (upper without the specimen, center with the elastic specimen), and the polariscope light intensity normalized by its background value, I/I0 (lower). The acoustic source is positioned at the left-hand side, outside of the presented region. The upper image shows σmax in the liquid in the absence of the stone, and the center image shows the case when the specimen is present. The acoustic pressure in liquid is equal to the inverted σmax.
To facilitate the interpretation of the polariscope images, it is useful to consider other elastic wave quantities in addition to the maximum principal stress. Curl and divergence of the displacement vector may be of interest, and , since these quantities represent purely shear and purely longitudinal bulk waves, respectively. In this sense, and are convenient markers for the location of a particular wave. Both of them are associated with mechanical stress; that is, they play a role in stone comminution. However, the primary cause of stone fragmentation is stress (i.e., not divergence and curl per se), but detailed analysis of the mechanisms is beyond the scope of this paper. With the wave (i.e., nonstatic) method of creating stresses used in lithotripsy, it is important to know which waves create stresses most effectively. As shown in the previous studies on the mechanisms of stone comminution,12,14 shear waves are often the main cause of zones of increased tensile stress. At the same time, other effects, such as spalling, can be caused by longitudinal waves. Thus, the observation of divergence and curl during numerical modeling helps to better understand the generation and dynamics of various types of waves that may cause stone fragmentation.
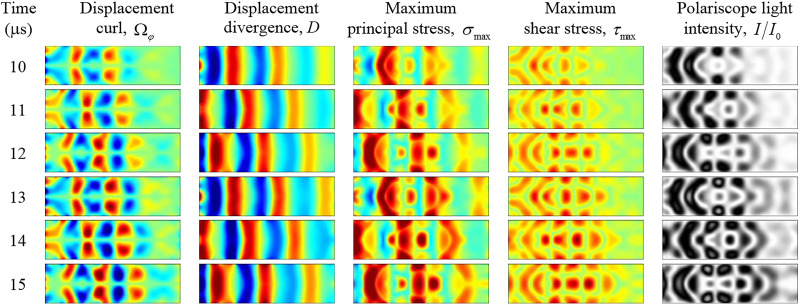
Note that in the axisymmetric case under consideration, there are only radial and axial components of ; therefore, the curl and divergence have only an azimuthal angular component, . In addition to , , and the aforementioned maximum principal stress , it is useful to consider the maximum shear stress, . Figure 6 shows the simulation results for , , , and , along with the corresponding polariscope images of the normalized light intensity distribution, , for several consecutive times. Only the region of the stone is shown since the surrounding liquid does not cause changes in the light polarization, i.e., the measured polariscope image is uniformly bright in the region of the fluid (see Fig. 5). It is seen from Fig. 6 that the image of the maximum shear stress best matches the measured photoelastic image. This can be explained by the fact that , which means that is expressed through the same combination of and shear stress that forms the right-hand side of the electromagnetic wave propagation equation [Eq. (19)]. The fact photoelastic visualization best represents the maximum shear stress is an important point to take into account when interpreting the polariscope images because brittle objects often break in shear.
FIG. 6.
(Color online) Instantaneous distributions of various parameters of elastic perturbations in the specimen at consecutive time points. Time is counted from the moment the ultrasound pulse propagating to the right arrives at the proximal left face of the specimen. The value of the corresponding quantity on the color pictures changes from dark blue to dark red with the green color corresponding to the zero level. The color bar limits are ±0.0015 (), ±0.0005 (D), and ±3.5 MPa ( and ). The normalized light intensity changes from 0 (black) to 1 (white). The polariscope images best correlate with the maximum shear stress distribution.
B. Refinement of the photoelastic constant and dynamic polariscope imaging
The photoelastic constant that enters in the equation of electromagnetic wave propagation, Eq. (19), depends on the material and is not always exactly known. In addition, polymeric materials, such as epoxy or acrylic, are highly dispersive in their mechanical and electrical properties due to the relaxation phenomena associated with the delayed response of long polymer chains to a sudden external action. One of the known effects is stiffening of such materials under the dynamic load. The photoelastic constant also depends on the elastic wave frequency. For example, Clark and Sanford20 measured several types of epoxy polymers where it was shown that for a 200-μs pulse propagating in a test beam (which corresponds to a cyclic load of approximately 5 kHz), the photoelastic constant decreased by up to 20% compared to its static value. In another study21 using acrylic, it was experimentally shown that for a pulse of 50 μs duration (equivalent frequency of 20 kHz), the dynamic photoelastic constant was half of that found under static conditions. These studies show that the photoelastic constant measured under the static load can be significantly larger than the constant in the dynamic process, especially when the frequency of elastic waves far exceeds the kilohertz range.
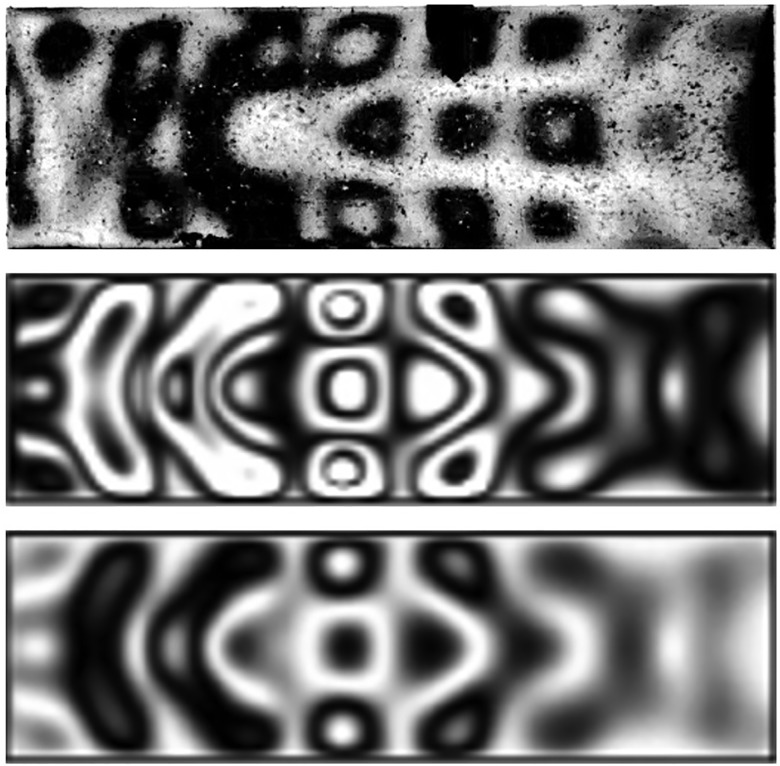
According to Ramesh1 (p. 42), the static stress fringe value of epoxy is approximately equal to 12 N/mm/fringe, which corresponds to 5 × 10⁻⁴ Pa−1 m−1. Based on the known material properties of the media and the measured focal pressure waveform in water, it is possible to account for the dispersion and refine the photoelastic constant to the used tone burst frequency (340 kHz) by comparison of the experimental and numerical polariscope images. Representative images are shown in Fig. 7. The upper image shows an experimental polariscope pattern 14 μs after the acoustic pulse front impacts the front side of the stone. The center image represents the modeling result with the use of 5.3 × 10⁻⁴ Pa−1 m−1. It is seen that the number of fringes in the stressed spots does not agree with the observation. To refine the photoelastic constant, modeling was performed for a set of different values of , and the most appropriate constant was found. The bottom image corresponds to the modeling with the use of the constant 2.4 × 10⁻⁴ Pa−1 m−1, which provided much better correspondence to the experiment. Note that this procedure of finding the photoelastic constant by matching the predicted and observed polariscope images under a known transient load has been employed as a method of measuring a dynamic photoelastic constant accepted in dynamic photoelasticity.20,21
FIG. 7.
Comparison of an experimental photoelastic image (upper) with the corresponding theoretical images calculated using different photoelastic constants: 5.3 × 10⁻⁴ Pa−1 m−1 (center) and 2.4 × 10⁻⁴ Pa−1 m−1 (lower). The ultrasound burst center frequency is 340 kHz, and the peak negative pressure at the focus in the absence of the stone is 4.5 MPa. The image represents mechanical stresses in the stone 14 μs after the burst enters the stone.
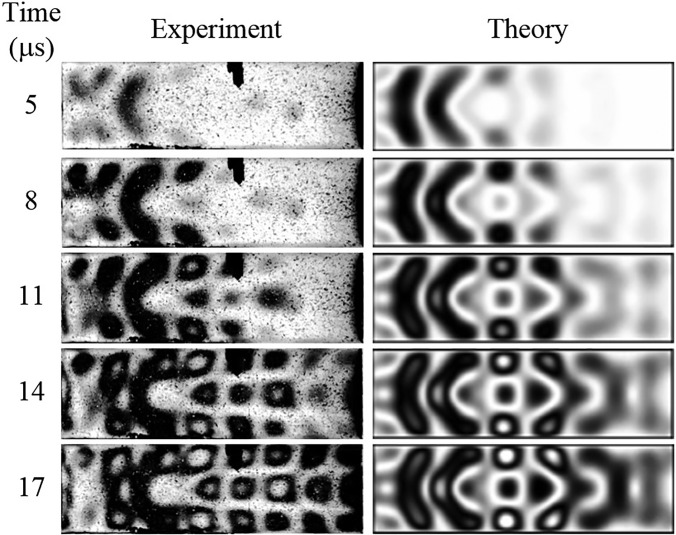
Figure 8 illustrates the ability of the polariscope to follow the propagation of elastic waves in the specimen. Consecutive frames are shown for the measured (left) and modeled (right) polariscope light intensity patterns. It is seen that the two images agree well.
FIG. 8.
A sequence of photoelastic images representing wave propagation through the specimen at 3-μs snapshots (roughly one period of the 340 kHz tone burst) starting 5 μs after the ultrasound pulse reaches the specimen. The left column shows experimentally measured data, and the right column shows numerically calculated results obtained using the photoelastic constant, 2.4 × 10⁻⁴ Pa−1 m−1.
IV. DISCUSSION AND CONCLUSIONS
Unlike liquids and gases, it is impossible to place and translate an acoustic sensor in the volume of a solid medium. Optical imaging techniques can partially circumvent this difficulty in optically transparent media, such as plastic and glass, but techniques for fluids, such as shadowgraphy (schlieren) and interferometry, which rely on variation in acoustic density to change the optical refractive index, are not particularly useful in solids. In elastic media, there is another mechanism for the optical sensing of acoustic waves in addition to a change in density, which is the optical anisotropy under mechanical stress. This allows visualization of anisotropy using polarized light, which is the subject of photoelasticity. Photoelastic imaging is a convenient direct method for studying mechanical stresses in optically transparent elastic bodies. This approach allows one not only to visualize the stress field, but also to estimate the absolute stress level by measuring the change in light intensity or, at higher stress levels, by counting the number of fringes in the image. Since the stress is a tensor, that is, it consists of many components, it is important to know what is represented by the photoelastic image, which is a specific projection of a complex 3D distribution of stress. As shown in Fig. 6, the simulation results indicate that circular polariscope images are best correlated with the maximum shear stress distribution. Note that in the case of shadowgraphy, the corresponding pattern will show the distribution of the displacement divergence (second column in Fig. 6) because it describes the density changes.
It is difficult to directly relate the image to the 3D transient stress distribution that occurs in the sample volume during the propagation of an ultrasonic pulse. Theoretical analysis is often based on simplified approaches, such as ray tracing, the assumption of a plane wave, the approximation of a thin uniformly stressed plate, and others.8,9 The finite-difference simulation allows a more accurate and objective description of the phenomenon of propagation of electromagnetic waves in the presence of transient stress created by longitudinal and shear waves caused by an acoustic pulse incident on the sample from an immersion liquid. In the present work, such an approach was developed and illustrated in the case of axial symmetry of the acoustic field. However, the description is more general and can be applied to the general 3 D case. Applied to the fragmentation of kidney stones in burst wave lithotripsy, the model captures several features observed experimentally.9 For instance, the generation and convergence of shear waves from the proximal corners of the model can be seen in Figs. 6 and 8. Also captured is the generation of periodic stresses within the cylinder near the center of the stone. Interestingly, there appear to be some differences near the distal end of the stone, where the experiment shows continuous propagation of the periodic mode, but the model shows an obscuring of the mode. This may be due to the absence of attenuation in the finite-difference simulation or non-axisymmetric effects in the experiment that cannot be captured in the present model but may be present in a full 3D simulation. Nevertheless, the model can further aid in interpreting the photoelastic images and their relationship to the stress fields.
Photoelastic imaging has several limitations. As already mentioned, it can only be used in homogeneous optically transparent samples. In addition, it shows only a specific 2D projection of a 3D stress field and is sensitive to only part of the stress. However, the importance of such a visualization is greater than the visualization itself if the polariscope measurements are combined with a finite-difference theoretical model for elastic waves. As shown in this paper, the theoretical parameters of the model can be checked and tuned based on the polariscope data, for example, the photoelastic constant, elastic wave velocities, and absorption coefficients can be verified. After checking the model, it can be used to calculate the full stress and strain tensors. Such a polariscopic adjustment of the numerical model makes the latter an accurate tool for studying elastic waves in kidney stones or other samples. In shock wave or burst wave lithotripsy, it can be used to interpret the mechanisms of stone fragmentation and, on the basis of this, to create more advanced devices for ultrasonic stone comminution.
ACKNOWLEDGMENTS
We gratefully acknowledge support for this work from the National Institutes of Health (NIH) National Institute of Diabetes and Digestive and Kidney Diseases (NIDDK) Grant Nos. P01 DK043881 and K01 DK104854, and RFBR Grant No. 20-02-00139. We thank our colleagues for these grants and our departments for making this study possible.
References
- 1. Ramesh K., Digital Photoelasticity: Advanced Techniques and Application ( Springer, Berlin, 2000). [Google Scholar]
- 2. Kuske A., “ Photoelastic research on dynamic stresses,” Exp. Mech. 6(2), 105–112 (1966). 10.1007/BF02326229 [DOI] [Google Scholar]
- 3. Wyatt R. C., “ Visualization of pulsed ultrasound using stroboscopic photoelasticity,” Non-destructive Test. 5(6), 354–358 (1972). 10.1016/0029-1021(72)90064-3 [DOI] [Google Scholar]
- 4. Li H. U. and Negishi K., “ Visualization of Lamb mode patterns in a glass plate,” Ultrasonics 32(4), 243–248 (1994). 10.1016/0041-624X(94)90001-9 [DOI] [Google Scholar]
- 5. Pawlak A. and Galeski A., “ Photoelastic method of three-dimensional stress determination around axisymmetric inclusions,” Polymer Eng. Sci. 36(22), 2736–2749 (1996). 10.1002/pen.10673 [DOI] [Google Scholar]
- 6. Nam Y. H. and Lee S. S., “ A quantitative evaluation of elastic wave in solid by stroboscopic photoelasticity,” J. Sound Vib. 259(5), 1199–1207 (2003). 10.1006/jsvi.2002.5201 [DOI] [Google Scholar]
- 7. Nguyen T. T. P., Tanabe R., and Ito Y., “ Laser-induced shock process in under-liquid regime studied by time-resolved photoelasticity imaging technique,” Appl. Phys. Lett. 102(12), 124103 (2013). 10.1063/1.4798532 [DOI] [Google Scholar]
- 8. Xi X. and Zhong P., “ Dynamic photoelastic study of the transient stress field in solids during shock wave lithotripsy,” J. Acoust. Soc. Am. 109(3), 1226–1239 (2001). 10.1121/1.1349183 [DOI] [PubMed] [Google Scholar]
- 9. Maxwell A. D., MacConaghy B., Bailey M. R., and Sapozhnikov O. A., “ An investigation of elastic waves producing stone fracture in burst wave lithotripsy,” J. Acoust. Soc. Am. 147(3), 1607–1622 (2020). 10.1121/10.0000847 [DOI] [PMC free article] [PubMed] [Google Scholar]
- 10. Maxwell A. D., Cunitz B. W., Kreider W., Sapozhnikov O. A., Hsi R. S., Harper J. D., Bailey M. R., and Sorensen M. D., “ Fragmentation of renal calculi in vitro by burst wave lithotripsy,” J. Urology 193(1), 338–344 (2015). 10.1016/j.juro.2014.08.009 [DOI] [PMC free article] [PubMed] [Google Scholar]
- 11. Aben H. and Guillemet C., Photoelasticity of Glass ( Springer, Berlin, 1993). [Google Scholar]
- 12. Cleveland R. O. and Sapozhnikov O. A., “ Modeling elastic wave propagation in kidney stones with application to shock wave lithotripsy,” J. Acoust. Soc. Am. 118(4), 2667–2676 (2005). 10.1121/1.2032187 [DOI] [PubMed] [Google Scholar]
- 13. Wijerathne M. L. L., Hori M., and Sakaguchi H., “ Simulation of dynamic crack growth in shockwave lithotripsy with PDS-FEM,” J. Appl. Mech. 13, 253–262 (2010). [Google Scholar]
- 14. Sapozhnikov O. A., Maxwell A. D., MacConaghy B., and Bailey M. R., “ A mechanistic analysis of stone fracture in lithotripsy,” J. Acoust. Soc. Am. 112(2), 1190–1202 (2007). 10.1121/1.2404894 [DOI] [PubMed] [Google Scholar]
- 15. Malykin G. B., “ VL Ginzburg's helical elliptically polarized modes and their application,” Physics-Uspekhi 59(12), 1245–1248 (2016). 10.3367/UFNe.2016.11.037984 [DOI] [Google Scholar]
- 16. Ginoux J.-M., “ Van der Pol's method: A simple and classic solution,” In History of Nonlinear Oscillations Theory in France (1880–1940), 275–289 (Springer, Cham, 2017). 10.1007/978-3-319-55239-2_10 [DOI] [Google Scholar]
- 17. Goldstein D. H., Polarized Light, 3rd ed. ( CRC Press, Boca Raton, FL, 2011). [Google Scholar]
- 18. Smolik O. and Bellow D. G., “ On the mixing of photoelastic immersion liquids,” Exp. Mech. 14(10), 400–402 (1974). 10.1007/BF02324943 [DOI] [Google Scholar]
- 19. Sapozhnikov O. A., “ An exact solution to the Helmholtz equation for a quasi-Gaussian beam in the form of a superposition of two sources and sinks with complex coordinates,” Acoust. Phys. 58(1), 41–47 (2012). 10.1134/S1063771012010216 [DOI] [Google Scholar]
- 20. Clark A. B. J. and Sanford R. J., “ A comparison of static and dynamic properties of photoelastic materials,” Exp. Mech. 3(6), 148–151 (1963). 10.1007/BF02327230 [DOI] [Google Scholar]
- 21. Marshall D. F., “ The dynamic stress-optic coefficient of Perspex,” Proc. Phys. Soc. (Sec. B) 70(11), 1033–1039 (1957). 10.1088/0370-1301/70/11/302 [DOI] [Google Scholar]


