Abstract
Recent reports have revealed oligodendrocyte precursor cell (OPC) heterogeneity. It remains unclear if such heterogeneity reflects different subtypes of cells with distinct functions, or rather transiently acquired states of cells with the same function. By integrating lineage formation of individual OPC clones, single-cell transcriptomics, calcium imaging and neural activity manipulation, we show that OPCs in the zebrafish spinal cord can be divided into two functionally distinct groups. One subgroup forms elaborate networks of processes and exhibits a high degree of calcium signalling, but infrequently differentiates, despite contact with permissive axons. Instead, these OPCs divide in an activity and calcium dependent manner to produce another subgroup with higher process motility and less calcium signaling, which readily differentiates. Our data show that OPC subgroups are functionally diverse in responding to neurons and reveal that activity regulates proliferation of a subset of OPCs that is distinct from the cells that generate differentiated oligodendrocytes.
Introduction
In the central nervous system (CNS) of vertebrates, oligodendrocyte precursor cells (OPCs, also referred to as NG2 cells) comprise an abundant cell population that tiles the CNS throughout life 1. OPCs are the cellular source for new myelin during development, in response to neuronal activity in the context of myelin plasticity, and during regeneration of damaged myelin 2–5. We have a relatively robust understanding of the cell intrinsic signalling cascades and transcriptional changes that govern OPC differentiation into myelinating oligodendrocytes 6,7. However, there are more OPCs in the CNS than ever differentiate. Whether all OPCs equally contribute to myelin formation, or if subsets of OPCs exist with different fates and functions, remains a major question.
Various attempts to compartmentalise OPC properties have revealed that these cells are indeed not a uniform population with equal properties 8–13. OPCs in different regions show different responsiveness to growth factors 14 and vary in their capacity to differentiate when transplanted into other CNS areas 15, while disease-specific OPC phenotypes have been identified in mouse models of multiple sclerosis (MS) and human MS patients 16,17. Furthermore, physiological properties of OPCs have been found to increasingly diversify over time 18, and OPCs can themselves modulate neuronal firing 19. Despite these findings, it remains unclear whether the reported diversity of OPC properties represent subtypes of OPCs with distinct functions, either in the same or in different microenvironments; or if they reflect different states of cells with the same function as they progress along their lineage. The reason for this is that it is inherently difficult to definitively monitor the dynamics of OPC lineage progression and function from single time-point analyses, including those of sequencing datasets. So far, no study has carried out a systematic analysis of cell dynamics within the oligodendrocyte lineage over time, whilst probing the function and molecular states of subsets of OPCs in vivo. Such an analysis would help advance our understanding of how oligodendrocyte lineage cells relate to each other. Specifically, it would reveal if the different functions that are attributed to OPCs apply to all cells at a particular time point, or if their lineage progression may be less linear, with specialisations of subgroups of OPCs that have distinct functions.
This analysis would, for example, help resolve open questions as to how neuronal activity affects OPC fates. OPCs integrate neuronal activity from surrounding axons by expression of a wide range of neurotransmitter receptors and voltage-gated ion channels 20–25. However, the role of neural activity in regulating OPC fate decisions is still unclear, because enhanced activity increases both proliferation and differentiation at the population level 2,3,26–28. This may be because subgroups of OPCs exhibit different electrophysiological properties and therefore differ in their sensitivity to axonal signals, or because they show differential cell fates in response to activity. In any case, analysis of physiology, gene expression, or cell fate alone, are not sufficient to reveal direct causality between heterogeneity in OPC properties and fates.
Here, we have addressed the diversity of OPC fates in an integrated approach by combining single-cell RNA sequencing in zebrafish, live cell imaging of OPC properties and fates, calcium imaging, and manipulation of physiology to reveal how neural activity affects OPC subgroups in their ability to divide and differentiate.
Results
OPCs form a network throughout the CNS that is composed of cells with distinct morphologies and dynamics
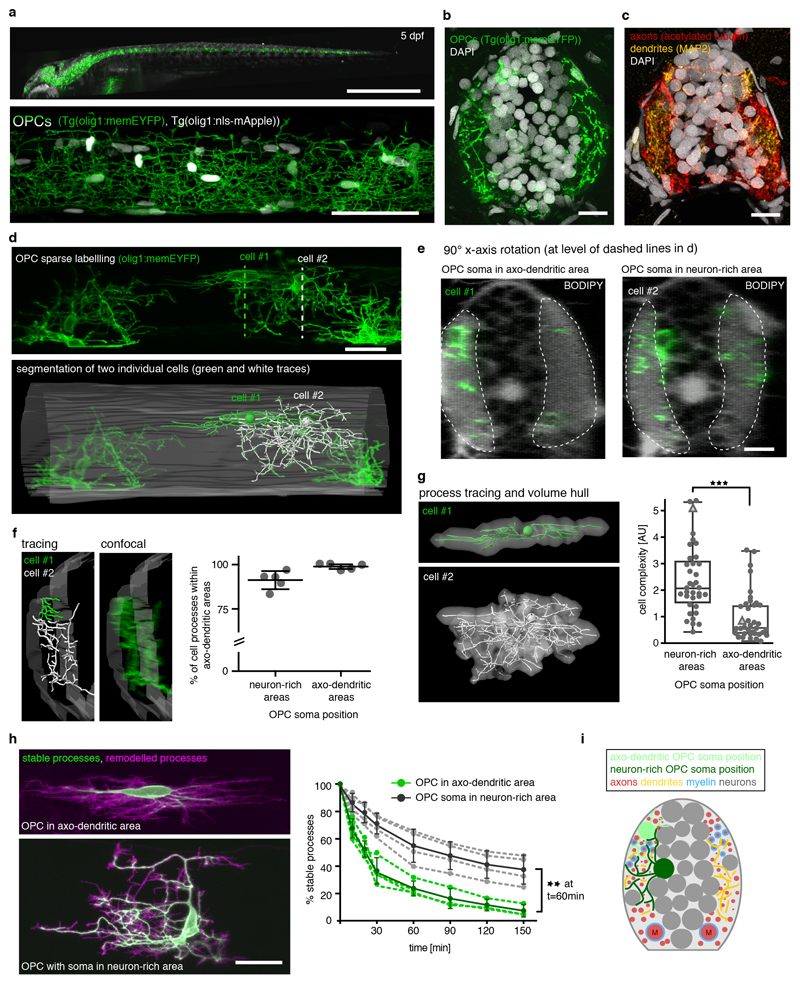
We have generated transgenic zebrafish that specifically label oligodendrocyte precursor cells (OPCs) using olig1 regulatory sequences (Fig. 1, Supplementary Video 1) 29,30. Whole animal and high-resolution imaging of OPC reporter animals showed that labelled cells form a network of cellular processes that extends throughout the CNS (Fig. 1a). Cross-sectional views at the level of the spinal cord revealed that OPC processes were almost exclusively found within the lateral spinal cord and much less in the neuron-dense regions of the medial spinal cord (Fig. 1b). The regions of the lateral spinal cord contained myelinated and unmyelinated axons, as well as dendrites and synapses (Fig. 1c, Extended Data Fig. 1b, c). The OPC process network that intersperses these axo-dendritic areas persisted long-term while OPC differentiation steadily increased, as shown by our analysis of OPC and myelinating oligodendrocyte numbers (Extended Data Fig. 1a, d, e).
Figure 1. Characteristics of oligodendrocyte precursor cells (OPCs) in zebrafish.
a) Top: Image of whole Tg(olig1:memEYFP) transgenic animal at 5 days post-fertilization (dpf). Scale bar: 1mm. Bottom: confocal image of a Tg(olig1:memEYFP), Tg(olig1:nls-mApple) zebrafish at the level of the spinal cord at 5 dpf. Scale bar: 50 μm. Representative images from 4 animals in 2 independent experiments.
b) Cross-sectional view of the spinal cord showing the distribution of OPC processes in Tg(olig1:memEYFP) at 7 dpf (n=33 animals / 11 experiments). Scale bar: 10 μm.
c) Cross-sectional view of the spinal cord showing the distribution of axons and dendrites at 7 dpf (anti-acetylated tubulin and anti-MAP2; n=7 animals / 2 experiments). Scale bar: 10 μm.
d) Top: sparse labelling of olig1:memEYFP expressing OPCs at 4 dpf. Bottom: Tracing of two neighbouring examplary OPCs and the spinal cord outlines (n numbers in panel g). Dotted lines indicate the position of the y-axis rotations shown in e.
e) 90° y-axis rotations at the level of the soma of each of the two cells shown in panel d with a BODIPY counterstain to reveal the position of OPC somata in axo-dendritic (cell #1) and neuron-rich (cell#2) regions (n=12 BODIPY stained animals / 4 experiments). Dotted lines indicate axo-dendritic areas. Scale bar: 10 μm.
f) High-magnification view showing the proximity of the processes made by the two OPCs shown in panel d within axo-dendritic areas. Quantification shows the percentage of cell processes resident in axo-dendritic areas formed by OPCs with their soma in neuron-rich and axo-dendritic regions at 4-5 dpf (mean 91.3% ± 2.3 SD neuron-rich vs. 98.9% ± 0.7 SD axo-dendritic; n=5 cells/condition from 6 animals).
g) Morphology reconstructions of the two OPCs shown in panels d-f. Quantification shows relative cell complexities of individual OPCs at 4 dpf with their soma in different areas. Triangles indicate example cell#1 and #2. Data are expressed as median ± 25/75% interquartile percentiles, whiskers indicate min/max values (2.1±1.5/3.2 for OPCs in neuron-rich areas vs. 0.6±0.4/1.5 in axo-dendritic areas, p<0.001 (Mann-Whitney U test, U=211; n=36/38 cells from 23 animals in 11 experiments).
h) Projections of 60 minutes time-lapse imaging to show remodelled and stable processes of OPCs with their soma in different areas. Quantification shows stable processes over time. Dashed lines connect data points of individual cells. Data points connected by continuous lines represent mean ± SD within the groups. At t=60 minutes: 56.3±12.2 % stable processes for OPCs in neuron-rich areas vs. 25.0±5.5 % in axo-dendritic areas; p=0.001 between groups (two-way repeated-measures ANOVA of time-points 0-60 min, F(1,6)=32); n=4 cells per group from 8 animals in 8 experiments). Scale bar: 20 μm.
i) Schematic overview depicting the positioning of OPCs in the zebrafish spinal cord.
In order to investigate how individual OPCs form this process network, we carried out OPC sparse labelling and three-dimensional morphometry of individual cells (Fig. 1d, g, Extended Data Fig. 1f, g; Supplementary Video 2). Our analysis revealed that OPC somata reside either within the neuron-rich areas of the medial spinal cord, or within the axo-dendritic areas of the lateral spinal cord (Fig. 1e). Despite these different soma positions, the processes of each cell extended into axo-dendritic territories of the lateral spinal cord (Fig. 1e, f). Although the vast majority of all OPC processes could thus be found in the same local microenvironment, OPCs had distinct properties with regard to size and dynamics of their processes, which correlated with the soma position of the respective cell. OPCs with their soma within neuron-rich areas of the medial spinal cord formed a much more elaborate process network compared to OPCs that entirely resided within lateral axo-dendritic territories (Fig. 1g). Furthermore, OPCs showed highly different process dynamics, depending on the position of the respective cell body. Time-projections showed that OPCs in axo-dendritic areas almost completely remodelled their entire process network within one hour, whereas OPCs that reside with somas in neuron-rich areas only remodelled their process tips whilst retaining stable major branches (Fig. 1h, Supplementary Videos 3-6). Together, these data show that OPCs in the zebrafish spinal cord segregate into two entities. The processes of all cells reside within the same local tissue, but branching complexity and process dynamics differ and correlate with the position of the respective cell body (Fig. 1i).
Single-cell RNA sequencing reveals distinct molecular signatures of OPCs
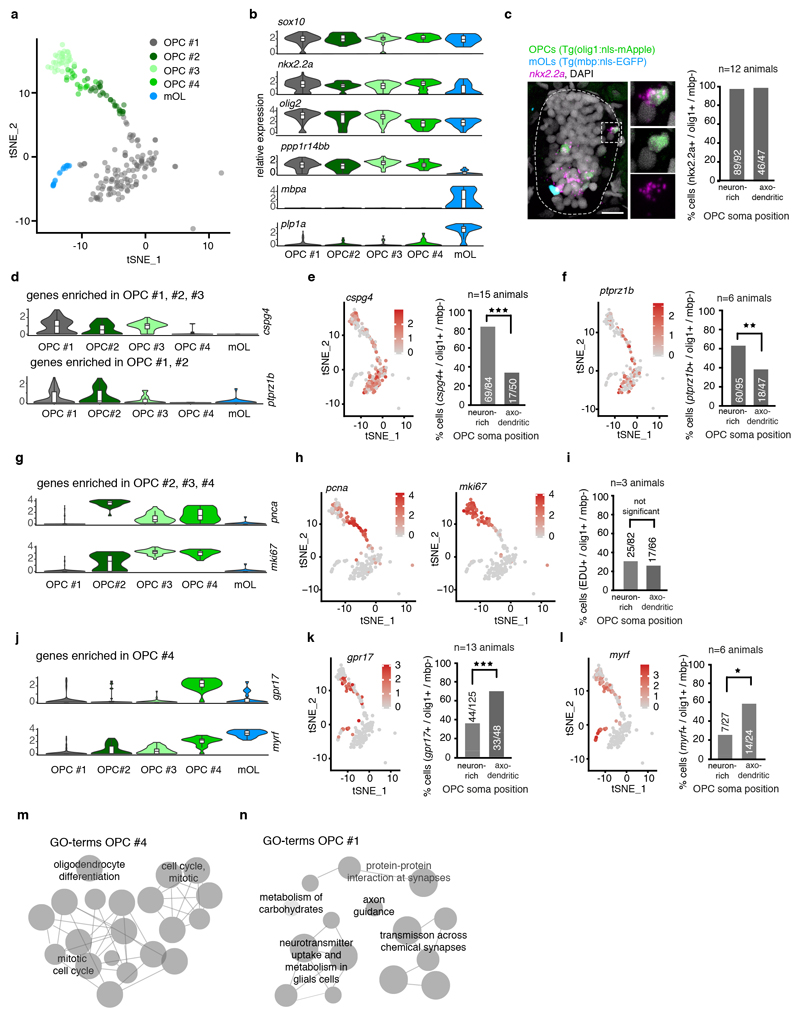
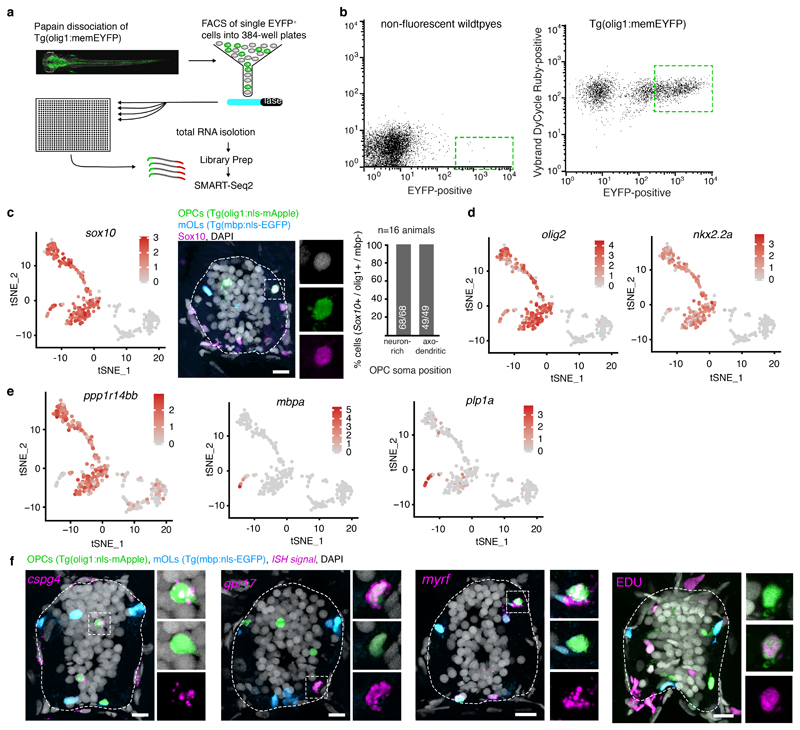
As we could distinguish OPCs with different properties relating to soma position, morphology and process dynamics, we carried out transcriptome analysis of single OPCs using SmartSeq2 31 to determine the molecular signatures that underlie the observed differences between OPCs (Fig. 2, Extended Data Fig. 2, Supplementary Fig. 1). Clustering analysis of 310 cells that were isolated from OPC reporter animals at 5 days post fertilisation led to the identification of five clusters (#1 - #5) with oligodendrocyte lineage identity, based on the co-expression of the key lineage transcription factors sox10, nkx2.2a, and olig2 (Fig. 2a, b, Extended Data Fig. 2c, d). We confirmed oligodendrocyte lineage identity of cells labelled in our transgenic lines by in-situ hybridization and immunohistochemistry and found that almost all OPCs detected by the transgene co-expressed Sox10 and nkx2.2a (Fig. 2c, Extended Data Fig. 2c). Two additional clusters (#6 and #7) were negative for oligodendrocyte lineage markers and thus not investigated further (Supplementary Fig. 1a, Extended Data Fig. 2c-e). Among the five oligodendrocyte clusters, #1 to #4 expressed markers for OPCs, such as ppp1r14bb and no markers of mature differentiated oligodendrocytes like plp1a and mpba, which were only present in cluster #5 (Fig. 2b, Extended Data Fig. 2e). Therefore, clusters #1 to #4 likely represent the OPCs investigated in our imaging studies.
Figure 2. Single cell RNA sequencing of zebrafish OPCs.
a) TSNE plots of olig1:memEYFP sorted cells with oligodendrocyte lineage identity (cells per cluster: #1=110, #2=28, #3=33, #4=18, #5=19; cells came from 2300 animals at 5 dpf (1 experiment).
b) Log(TPM) expression levels of key oligodendrocyte lineage markers in the clusters shown in panel a. Data are expressed as median with interquartile ranges and a violin shape to represent data distribution.
c) In situ hybridisation for nkx2.2a on transversal spinal cord sections of 7 dpf Tg(olig1:nls-mApple), Tg(mbp:nls-EGFP) animals and quantification of nkx2.2a-expressing OPCs (olig1:nls-mApple-positive, mbp:nls-EGFP-negative) in neuron-rich and axo-dendritic areas (97% (89/92) vs. 98% (46/47) pos. cells, n=12 animals / 3 experiments). Dotted lines in the image indicate the outlines of the spinal cord. Scale bar:10 μm.
d) Violin plots as in panel b with relative expression levels of cspg4 and ptprz1b.
e) TSNE plots (see panel a for n numbers) of cspg4 expression and quantification of cspg4-positive cells as described in panel c (82% (69/84) vs. 34% (17/50) pos. cells, p<0.001 (two-tailed Fisher’s exact test), n=15 animals / 4 experiments).
f) TSNE plots as in panel e of ptprz1b expression and quantification of ptprz1b-positive cells as described in panel c (63% (60/95) vs. 38% (18/47) pos. cells, p=0.007 (two-tailed Fisher’s exact test), n=6 animals / 2 experiments).
g) Violin plots as in panel b with relative expression levels of pcna and mki67.
h) TSNE plots as in panel e of pcna and mki67 expression.
i) Quantification of proliferative OPCs using EDU incorporation (olig1:nls-mApple-positive, mbp:nls-EGFP-negative) in neuron-rich and axo-dendritic areas (30% (25/82) vs. 26% (17/66) pos. cells, p=0.585 (two-tailed Fisher’s exact test), n=3 animals / 2 experiments).
j) Violin plots as in panel b with relative expression levels of gpr17 and myrf.
k) TSNE plots as in panel e of gpr17 expression and quantification of gpr17-positive cells as described in panel c (35% (44/125) vs. 69% (33/48) pos. cells, p<0.001 (two-tailed Fisher’s exact test), n=13 animals / 3 experiments).
l) TSNE plots as in panel e of myrf expression and quantification of myrf-positive cells as described in panel c (26% (7/27) 58% (14/24) pos. cells, p=0.025 (two-tailed Fisher’s exact test), n=6 animals / 2 experiments).
m) Gene ontology (GO) terms of top 30 significantly expressed genes in cluster OPC #4.
n) GO terms of top 30 significantly expressed genes in cluster OPC #1.
In order to determine how the OPC clusters identified by transcriptomic analysis correlate with the cells seen by live cell imaging, we carried out in-situ hybridizations of genes that were differentially expressed between clusters and determined the position of the respective OPC soma. The bona fide OPC marker cspg4 was enriched in clusters #1, #2 and #3 (Fig. 2d, e). In situ, 82% of OPC somata (olig1:nls-mApple-positive, mbp:nls-EGFP-negative) in neuron-rich areas of the medial spinal cord were cspg4-positive, and only about a third of OPCs in axo-dendritic areas (Fig. 2e, Extended Data Fig. 2f). Another OPC marker, ptprz1b, which predominantly clustered to OPC #1 and #2, was also expressed by more OPCs within neuron-rich areas than in axo-dendritic areas (Fig. 2d, f). Clusters #2 and #3 expressed the OPC marker cspg4, but additionally expressed cell cycle genes. Here, cluster #2 contained genes specific for S-phase like pcna, whereas cluster #3 was enriched for genes specific for M-phase like mki67 (Fig. 2g, h, Supplementary Fig. 1e, f). To determine where proliferative OPCs predominantly localise, we assessed incorporation of the thymidine analogue EDU, and found comparable amounts of dividing OPCs in the medial and lateral spinal cord (Fig. 2i, Extended Data Fig. 2f).
In contrast to clusters #1 - #3, cluster #4 expressed only low levels of cspg4 mRNA, but instead high levels of gpr17, which is a marker for a subset of OPCs and early differentiating oligodendrocytes in mammals (Fig. 2j) 32,33. Furthermore, cluster #4 contained genes associated with oligodendrocyte differentiation, such as myrf, suggesting a committed oligodendrocyte precursor (COP) identity (Fig. 2j) 10,34. However, these cells still expressed proliferation-related genes (Fig. 2g, Supplementary Fig. 1e, f), meaning that they are not post-mitotic differentiating oligodendrocytes. In-situ hybridization showed that gpr17 and myrf predominantly labelled OPCs within axo-dendritic areas (Fig. 2k, l, Extended Data Fig. 2f). In line with our marker analysis, gene ontology (GO) term analysis of genes enriched in cluster #4 contained genes involved in early differentiation, along with proliferation genes (Fig. 2m, Supplementary Table 1). In contrast, OPC cluster #1 comprised terms related to neurotransmitter sensing, but lacked markers associated with differentiation (Fig. 2n, Supplementary Table 1).
In summary, our data show that proliferative OPCs (#2, #3, #4) were present in both regions of the spinal cord. Quiescent OPCs characteristic for cluster #1 were predominantly found in neuron-rich areas of the medial spinal cord, where OPCs are characterized by an elaborate process network with slow process dynamics. OPCs with genes indicative for differentiation as well as proliferation in cluster #4 were predominantly found within axo-dendritic areas of the lateral spinal cord, where cells with a simpler process network and rapid remodeling dynamics reside. Therefore, our data indicate that OPCs with their soma in axo-dendritic and neuron-rich areas have different capacities to integrate signals from axons and to differentiate towards myelinating oligodendrocytes.
Fates of OPC subpopulations
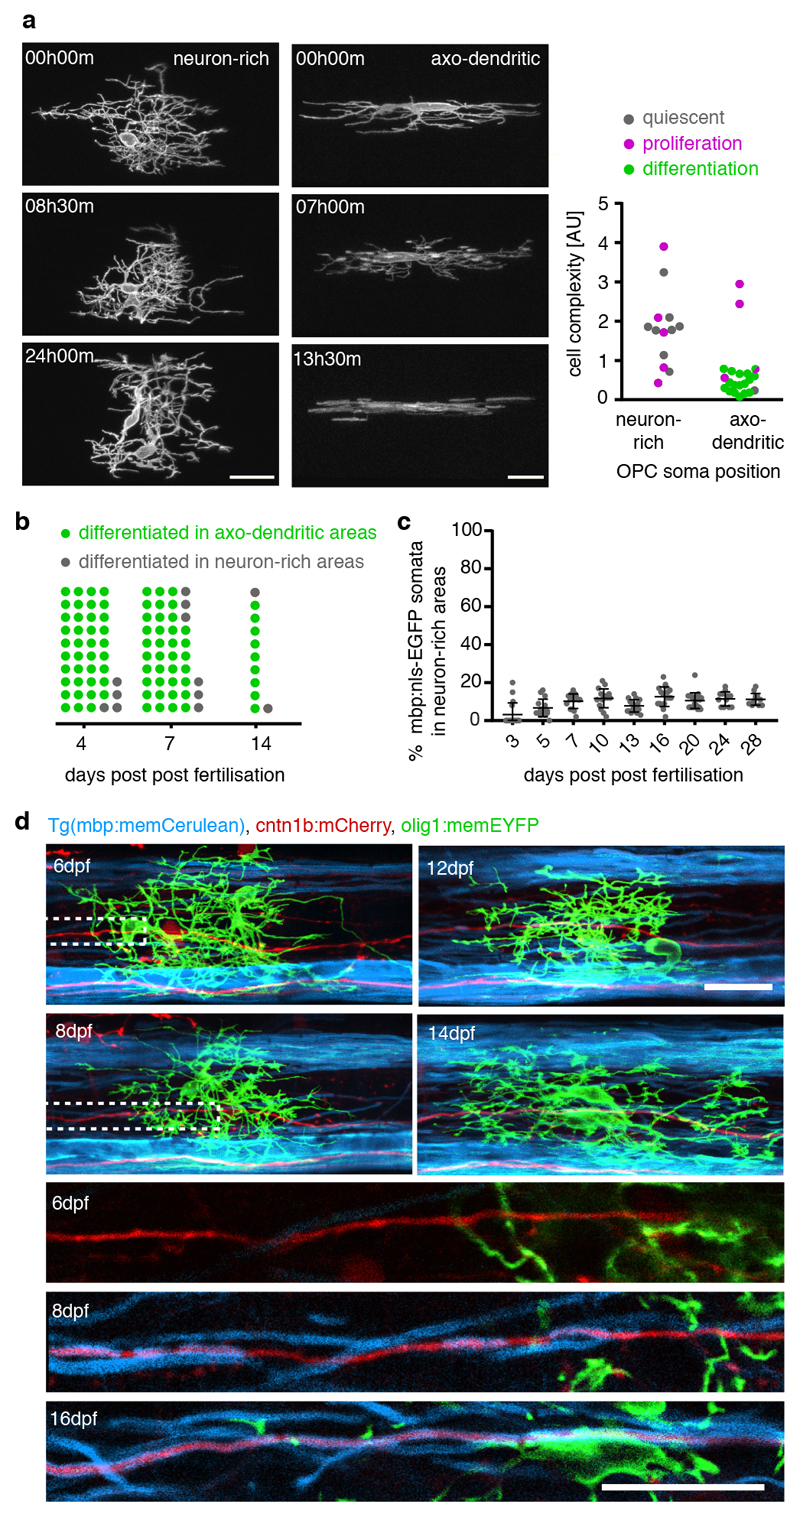
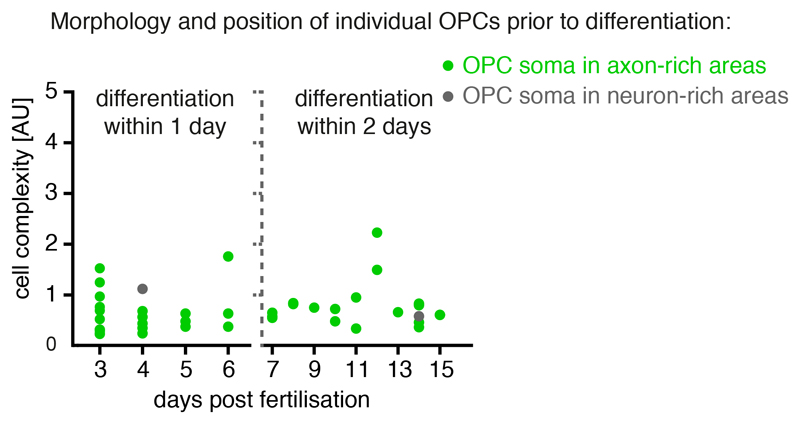
Having identified OPCs with distinct characteristics and soma positions, which correlate with different molecular profiles of OPC sequencing clusters, we wanted to confirm their differentiation fates using time-lapse imaging. As predicted from our sequencing data, OPC divisions occurred in all areas of the spinal cord (Fig. 3a). However, within 24 hours of investigation, the vast majority of OPCs within axo-dendritic areas started to differentiate and to ensheath axons, whereas none of the OPCs with their soma in the neuron-rich areas did so during the same time (Fig. 3a, Supplementary Videos 7 and 8). To exclude that OPCs located in the neuron-rich areas would simply differentiate at later stages, we carried out long-term analysis of individual OPCs up until 14 dpf. A retrospective inspection of 95 differentiated oligodendrocytes as determined by the formation of myelin sheaths showed that, independent of animal age, the vast majority of differentiated OPCs resided within axo-dendritic areas (Fig. 3b). Most of these later differentiating cells also showed the characteristic morphology of fast remodelling OPCs with low process complexity (Extended Data Fig. 3). Population analysis further confirmed that the relative proportion of myelinating cells residing with their soma in neuron-rich areas always remained a minority of no more than 11% of all myelinating oligodendrocytes throughout the period of analysis (Fig. 3c). Here, it is important to note that all OPC processes extend into the same axo-dendritic territories, regardless of the position of the respective cell body (Fig. 1f). Therefore, all OPCs can contact myelination-competent axons, especially because a single OPC can span the entire dorso-ventral and medio-lateral dimensions of the spinal cord (Extended Data Fig. 1f, g). Indeed, triple labelling of individual axons and OPCs in a transgenic line that has all myelin labelled showed that a single OPC could persist undifferentiated over long time periods, while its processes were in close proximity to an axon that became increasingly myelinated during the same time (Fig. 3d). Therefore, these data show that OPCs that reside with their soma in neuron-rich areas can remain undifferentiated despite extending their processes into areas with axons permissive for myelination.
Figure 3. Differentiation properties of individual OPCs.
a) Example time-lapses of individually labelled olig1:memEYFP cells with their soma in neuron-rich (left) and axo-dendritic (right) spinal cord between 3 and 5 dpf. Quantification shows proliferation / differentiation fate within 24 h. 38% (5/13) vs. 19% (4/21) cells proliferated in neuron-rich vs. axo-dendritic areas, p=0.254 (two-tailed Fischer’s exact test); 0% (0/13) vs. 81% (17/21) cells differentiated, p<0.001 (two-tailed Fischer’s exact test), n=11 animals / 8 experiments. Scale bar: 20 μm.
b) Frequency distribution of OPC soma positioning before differentiation at different developmental stages (% cells in axo-dendritic areas: 90.7% (39/43) at 4 dpf, 86.0% (37/43) at 7 dpf, 81.8%(9/11) at 14 dpf, n=18/16/4 animals in 3/6/3 experiments).
c) Myelinating oligodendrocyte numbers with their soma in neuron-rich areas at different developmental stages. Data are expressed as mean percentage ± SD (3.1±6.2 vs. 6.7±4.7 vs. 10.3±3.9 vs 11.8±5.0 vs. 7.8±3.3 vs. 12.7±5.2 vs. 10.6±4.2 vs. 11.5±3.8 vs. 11.3±3.1 at 3/5/7/10/13/16/20/24/28 dpf, n animals/experiments=17/2, 15/3, 15/3, 16/3, 17/2, 17/2, 20/3, 12/3, 13/3).
d) Example images of an individual OPC with its soma in neuron-rich areas between 6 and 16 dpf, while a cntn1b:mCherry labelled axon in close proximity becomes ensheathed with mbp:memCerulean labelled myelin (observation from one animal). Dotted boxes indicate the position of magnified views (bottom 3 panels). Scale bar: 20 μm.
Interrelationships between OPC subpopulations
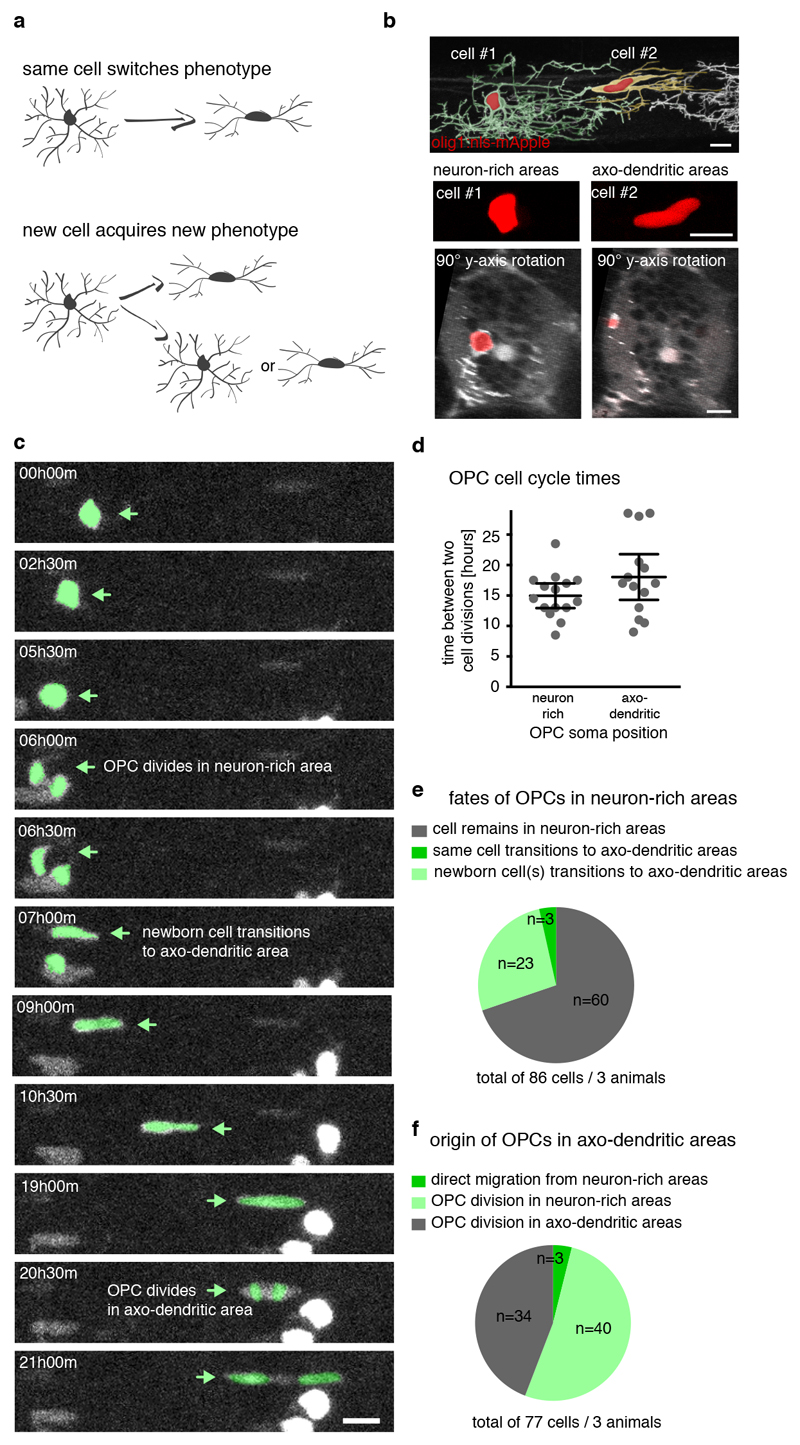
The finding that one subset of OPCs frequently differentiates while another rarely does so, raised the question of how these two populations relate to each other. Where do readily differentiating OPCs within axo-dendritic areas come from? One possibility is that slowly remodelling/ high complexity OPCs migrate into axo-dendritic areas, where they acquire a phenotype of fast remodelling OPCs typically found within these regions. In such a case, the same OPC would switch phenotype (Fig. 4a). Alternatively, new OPCs could arise in axo-dendritic areas from cell divisions of OPCs with their soma in neuron-rich areas, in which case one or two new cells with a different phenotype would emerge (Fig. 4a).
Figure 4. Interrelationships between OPC populations.
a) Schematic overview delineating possible scenarios of OPC interrelations.
b) Example image of two neighbouring OPCs showing that OPCs with their soma in neuron-rich (cell #1) and axo-dendritic areas (cell #2) can be distinguished by the shape of their cell body (n>10 animals / >3 experiments). Scale bar: 10 μm.
c) Selection of time-lapse images over 21 hours acquired at 30 minutes intervals in Tg(mbp:nls-EGFP), Tg(olig1:nls-mApple) zebrafish at 3 dpf showing an OPC division in neuron-rich areas that gives rise to a daughter OPC in axo-dendritic areas, followed by another cell division (n=3 animals / 2 experiments). Scale bar: 10 μm.
d) Times between two cell divisions by OPCs with their soma in neuron-rich and axo-dendritic areas as shown in panel c. Data expressed as mean ± 95% confidence interval (15.0±0.9 hours vs. 18.0±1.7 hours, n=15/14 cells from 3 animals in 2 experiments).
e) Quantification of the fates of OPCs found in neuron-rich areas as shown in panel c (n=86 cells from 3 animals in 2 experiments).
f) Quantification of the origin of OPCs found in axo-dendritic areas as shown in panel c (n=77 cells from 3 animals in 2 experiments).
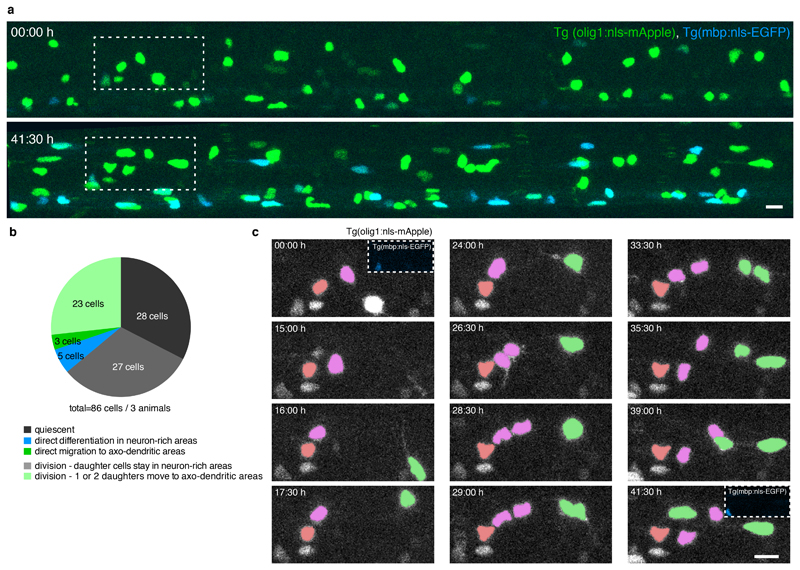
To address these two possible scenarios, we used time-lapse analysis of transgenic animals expressing fluorescent reporters targeted to the nucleus of each OPC (Extended Data Fig. 4, Supplementary Video 9). The nuclear label allowed us to trace the entire OPC population within tissue volumes and to simultaneously determine OPC phenotype, based on the simple observation that the shape of the OPC nucleus appeared round when located within neuron-rich areas, and elongated within axo-dendritic areas of the lateral spinal cord (Fig. 4b). Proliferative OPCs were present in both neuron-rich and axo-dendritic areas and they divided with similar cell cycle times, further confirming their precursor state (Fig. 4c, d). During the time of analysis, 70% of OPCs with their soma in neuron-rich areas retained their position (Fig. 4e, Extended Data Fig. 4b), whereas 27% divided and one or both daughter cells subsequently emerged in axo-dendritic areas (Fig. 4c, e). For only 3% of OPCs, we observed direct soma migration from neuron-rich to axo-dendritic areas that we could not link to a cell division (Fig. 4e). Likewise, in a retrospective analysis on the origin of OPCs in axo-dendritic areas, we found that 52% of cells arose from divisions of OPCs in neuron-rich areas, and 44% from OPC divisions within axo-dendritic areas (Fig. 4c, f). Direct, proliferation-independent, migration of the same OPC was only observed in three cases (Fig. 4e, f). These data indicate that OPCs do not switch states by changing their soma position, but that this process is tightly linked to cell divisions and thus the formation of a new cell.
Long-term contribution to myelination by OPCs in neuron-rich areas
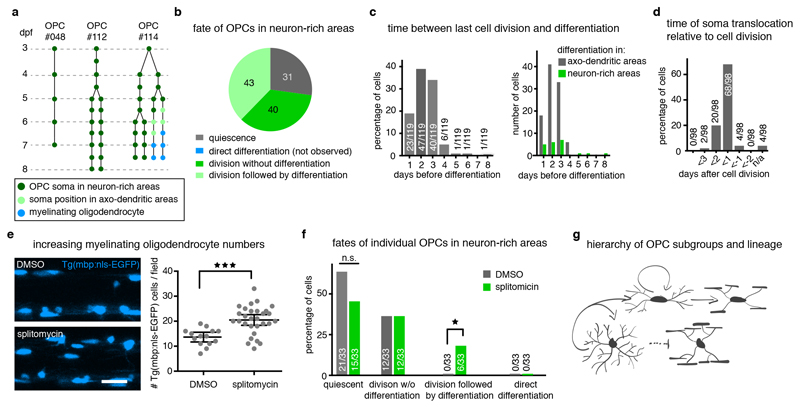
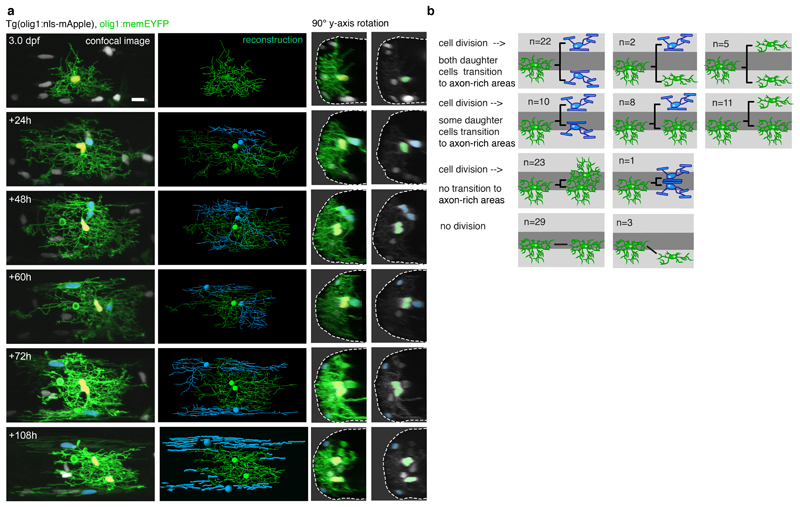
To investigate how OPCs in neuron-rich areas contribute to the generation of myelinating oligodendrocytes, we followed their fates over several days beginning at different time-points between 3 and 21 dpf (Fig. 5a, Extended Data Fig. 5, Supplementary Fig. 2). Amongst all cells analysed, 73% of the starting population divided, while the rest remained quiescent (Fig. 5b). None of the non-dividing cells differentiated to myelinating oligodendrocytes (Fig. 5b). However, we did observe the formation of new myelinating oligodendrocytes from daughter cells in 52% of the dividing OPCs (Fig. 5b). 92% of myelinating oligodendrocytes that formed from the starting population differentiated within three days after a cell division (Fig. 5c). Most of these newly formed myelinating cells localised within axo-dendritic areas, where they appeared within a day following the cell division (Fig. 5d). Interestingly, about 18% of oligodendrocytes differentiated whilst retaining their soma in neuron-rich areas, and these differentiation events also occurred within three days after a cell division (Fig. 5c). In order to test the importance of a recent cell cycle to form new OPCs that are more competent to differentiate, we experimentally enhanced oligodendrocyte differentiation using the previously described Sir2p inhibitor splitomicin 35, which enhanced myelinating oligodendrocyte numbers by 50% (Fig. 5e). Cell fate analysis of individual OPCs with their soma in neuron-rich areas over three consecutive days showed that myelinating oligodendrocytes arose from dividing OPCs in all cases (Fig. 5f). None of the quiescent, non-proliferative OPCs directly gave rise to myelinating oligodendrocytes in either condition (Fig. 5f).
Figure 5. Long-term contribution to myelinating oligodendrocytes through proliferation-mediated generation of new OPCs.
a) Example trees of OPC fates with their cell body in neuron-rich areas (n=114 starting cells from 45 fish of 9 experiments between 3 and 26 dpf, which expanded to 270 cells of which 119 differentiated, see also Extended Data Fig. 5b and Supplementary Fig. 2).
b) Frequency distribution of proliferation and differentiation events observed by individual OPCs in neuron-rich areas over at least 4 days, unless all cells of this clone differentiated earlier (n=114 cells, see panel a).
c) Quantification of the time between last cell division prior to OPC differentiation as percentage for all cells analysed (left) and as absolute numbers for cells with their cell body in neuron-rich and axo-dendritic areas (right) (n=119 cells, see panel a).
d) Quantification of the timing of cell body translocation from neuron-rich to axon-rich areas relative to a cell division (n=98 cells, see panel a).
e) Representative images and quantification of increased oligodendrocyte differentiation at 4 dpf upon splitomicin treatment. Data shown as mean ± 95% confidence interval (13.6±0.9 cells/field vs. 20.4±1.0 cells/field, p<0.001 (two-tailed unpaired t-test, t=4.184, df=41), n=14/29 animals / 4 experiments). Scale bar: 20 μm.
f) Fates of OPCs in neuron-rich areas between 3-5 dpf in presence and absence of splitomicin (control vs. splitomicin: 64% (21/33) vs. 45% (15/33) quiescent, p=0.22 (two-tailed Fisher’s exact test); 0% (0/33) vs. 18% (6/33) differentiation following division, p= 0.02 (two-tailed Fisher’s exact test); n=23 animals per group / 6 experiments).
g) Schematic representing the fates of OPCs following a cell division event.
From these cell fate analyses, we conclude that a hierarchy between the two OPC subgroups exists. OPCs with high process complexity and slow remodeling dynamics located with their soma in neuron-rich areas likely do not differentiate directly, but they can divide to produce daughter cells with higher cell motility and higher likelihood to differentiate to myelinating oligodendrocytes (Fig. 5g).
OPC subgroups show different degrees of calcium signaling activity
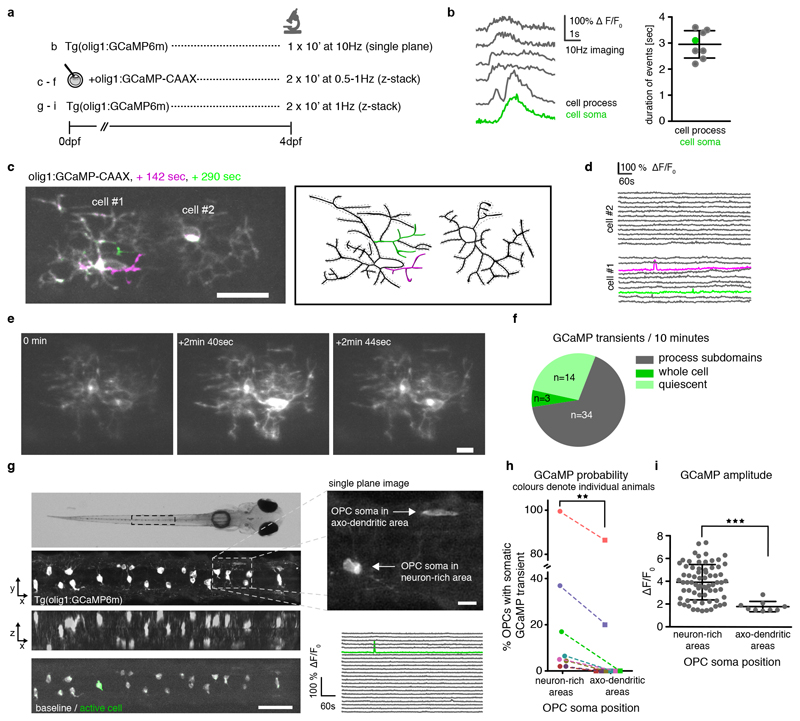
Because the infrequently differentiating OPCs (OPC #1) with their soma in neuron-rich areas were strongly enriched in genes important for neurotransmitter signaling, we wondered if these cells communicate with axons in a distinct manner to OPCs within axo-dendritic areas that are more likely to myelinate. In such a scenario, rarely differentiating OPCs with high process complexity and slow remodelling dynamics might act as cohort of cells with sensory functions to integrate signals from neurons. To test this, we expressed the genetically encoded calcium indicator GCaMP6m in OPCs, as it was previously shown that OPCs respond to neural activity with intracellular calcium rises 22,36–38 (Fig. 6). Fast (10Hz) imaging showed that GCaMP transients in OPCs lasted on average several seconds (Fig. 6b). Using membrane associated GCaMP6m-CAAX, we detected two different types of GCaMP transients (Fig. 6c-f, Supplementary Videos 10 and 11). Most OPCs showed transients that were restricted to process subdomains (Fig. 6c, d, f, Supplementary Video 10). In some cases, however, GCaMP transients spread throughout the entire cell (Fig. 6e, f, Supplementary Video 11). We also noticed that neighbouring OPCs did not necessarily show the same transients during the recording (Fig. 6c, e). To investigate if subgroups of OPCs show differential calcium signalling activity, we carried out population analysis of somatic calcium rises in spinal cord volumes of full transgenic OPC GCaMP reporter animals (Fig. 6g, Extended Data Fig. 6, Supplementary Video 12). Somatic GCaMP transients could either remain restricted to single OPCs (Fig. 6g), affect groups of cells, and even all cells (Extended Data Fig. 6d). However, in all animals investigated, OPCs within axo-dendritic areas had a 30% lower probability to show GCaMP transients when compared to OPCs that extend their processes into axon-dendritic areas, but which reside with their soma in the medial spinal cord (Fig. 6h). Furthermore, the amplitudes of somatic GCaMP transients were significantly lower amongst OPCs within axo-dendritic areas (Fig. 6i). In conclusion, the OPC subgroup that is less likely to differentiate directly, but which can divide to produce a myelinating daughter cell, shows higher rates of calcium signaling activity.
Figure 6. In vivo calcium imaging of individual OPCs.
a) Overview of imaging conditions.
b) Example traces of GCaMP transients in cell processes and soma of Tg(olig1:GCaMP6m) animals at 4 dpf (average duration=2.95±0.5 SD; n=6 ROI from 2 animals).
c) Projection of three timepoints of two olig1:GCaMP-CAAX expressing cells at 4 dpf showing transients restricted to process subdomains (example from 27 animals in 23 experiments). Scale bar: 20 μm. Measured ROI are indicated by the dotted lines around the reconstructed cells. Active ROI are highlighted in green and magenta.
d) ΔF/F0 GCaMP transients of the different ROI shown in c.
e) Different time points of two individual olig1:GCaMP-CAAX expressing cells showing transients spreading throughout the cells (example from cells as in panel c). Scale bar: 10 μm.
f) Quantification of different types of GCaMP transients observed during an observation period of 10 minutes in individual olig1:GCamP-CAAX expressing cells (n numbers as in panel c).
g) Top: Dorsal widefield view of a zebrafish at 4 dpf (example of 8 animals in 8 experiments). Below: z-projection and z-rotation of Tg(olig1:GCaMP6m) in the spinal cord as indicated by the boxed area above. Bottom: projection of 2 timepoints showing a GCaMP transient restricted to a single cell in the volume. Scale bar: 50 μm. Top right: the inset depicts a single plane image taken as indicated by boxed area showing individual OPCs with their soma in neuron-rich and axo-dendritic areas. Scale bar: 10 μm. Bottom right: ΔF/F0 GCaMP transients of all cells (green trace depicts active soma).
h) Probability of somatic GCaMP transients of OPC in neuron-rich and axo-dendritic areas at 4 dpf (26% (73/285 cells) vs. 19% (9/48 cells), p=0.007 (two-tailed Wilcoxon matched-pairs signed rank test, W=-36); n=8 animals in 8 experiments.
i) Quantification of GCaMP amplitudes measured in somata of OPCs in neuron-rich and axo-dendritic areas at 4 dpf. Data are expressed as mean ± SD (3.9±1.5 ΔF/F0 vs. 1.8±0.4 ΔF/F0, p<0.001 (two-tailed Welch’s t test, t= 8.894, df= 39.67), n=81/9 cells from 8 animals in 8 experiments).
Manipulation of neural activity and OPC calcium signalling primarily affects proliferation
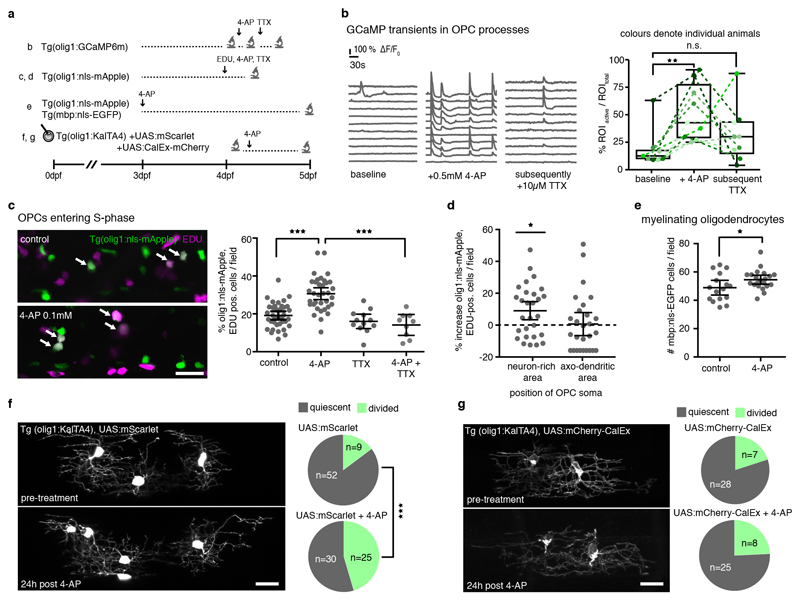
If the subgroup of non-myelinating OPCs in neuron-rich areas is most responsive to axonal firing, as suggested by our GCaMP imaging data, we wondered how manipulation of neuronal activity affects the proliferation and differentiation behaviour of OPC subgroups. We enhanced neural activity using bath application of the voltage-gated potassium channel blocker 4-aminopyridine (4-AP) (Fig. 7a). Single plane confocal imaging of OPC GCaMP6m transients revealed that acute application of 0.5 mM 4-AP enhanced the frequency of GCaMP rises in OPC processes within 15 minutes, which was partially reversible by subsequent incubation with the voltage-gated sodium channel blocker Tetrodotoxin (TTX) (Fig. 7b). These manipulations suggest that a proportion of the increased OPC GCaMP transients induced by 4-AP are mediated by alterations in neuronal activity.
Figure 7. Manipulation of neural activity and OPC calcium signalling changes proliferation of OPCs in neuron-rich areas.
a) Overview of experimental paradigms.
b) Example GCaMP traces in Tg(olig1:GCaMP6m) at 4 dpf before drug application, after treatment with 4-AP, and after addition of TTX to the same animal. Quantification of GCaMP events (ROI active / ROI total) per fish in the different treatment conditions. Data are expressed as median ± interquartile range, whiskers represent min/max values (12.5%±9.5/18.3 active ROI before 4-AP vs. 42.8%±28.6/78.0 after 4-AP, p=0.004 vs. 30%±14.1/44.1 after 4-AP and subsequent TTX, p=0.23 (Friedman with Dunn’s multiple comparison test, test statistics=11.09), n=9 animals in 5 independent experiments).
c) Representative confocal images of Tg(olig1:nls-mApple), EDU-labelled OPCs at 4 dpf. Arrows indicate double positive cells. Quantification shows olig1:nls-mApple/EDU double-positive cells in different treatment conditions. Data expressed as mean ± 95% confidence interval (19.1±1.1% in control vs. 30.6±1.5% in 4-AP vs. 14.1±2.2% in 4-AP+TTX; p<0.001 (control vs. 4-AP), p<0.001 (4-AP vs. 4-AP+TTX) (one-way ANOVA with Tukey’s multiple comparisons test, F(3,89)=22.44), n=37/35/9 animals from 3 experiments). Scale bar: 50 μm.
d) Percentage increase in EDU-positive OPCs located in neuron-rich and axo-dendritic areas after 4-AP treatment. Data are expressed as mean ± 95% confidence interval (9±3.1% vs. 0.08±3.5% increase, p=0.02 in neuron-rich areas (two-tailed unpaired t-test, t=2.431, df=53), n=28 animals in 3 experiments).
e) Myelinating oligodendrocyte numbers with and without 4-AP treatment. Data are expressed as mean ± 95% confidence interval (48.9±2.4 cells/field in control vs. 54.6±1.5 in 4-AP, p=0.047 (two-tailed unpaired t-test, t=2.058, df=35), n=16/21 animals / 4 experiments).
f) Confocal images of individual OPCs at 4 dpf and 24h post 4-AP treatment. Scale bar: 20 μm. Pie charts show the frequency of cell divisions observed in the different conditions (15% (9/61 cells) in control vs. 45% (25/55 cells) in 4-AP-treated group), p<0.001 (two-tailed Fisher’s exact test), n=18/24 animals).
g) Confocal images of individual CalEx expressing OPCs at 4 dpf and 24h post 4-AP treatment. Scale bar: 20 μm. Pie charts show the frequency of cell divisions observed in the different conditions (20% (7/35 cells) control vs. 24% (8/33 cells) 4-AP, p=0.77 (two-tailed Fisher’s exact test), n=11/24 animals).
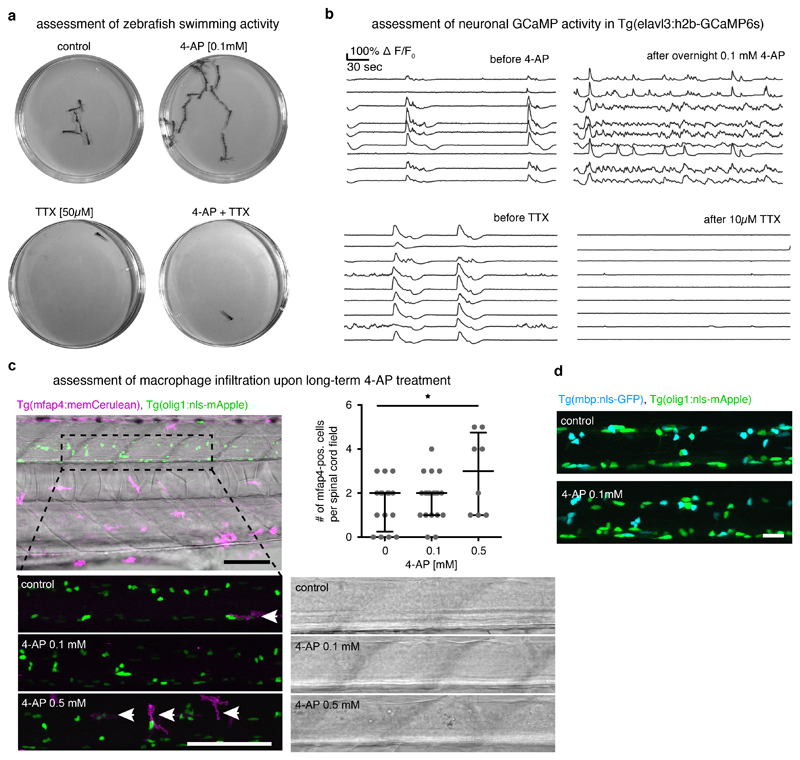
In order to investigate how changes in neural activity and OPC calcium signalling affect cell behaviour, we developed a protocol for chronic 4-AP treatment, which enhanced swimming behaviour and GCaMP activity in neurons, without inducing detectable deleterious effects on tissue integrity or inflammation as assessed by macrophage recruitment (Extended Data Fig. 7a-c). Six hours of 4-AP incubation resulted in a significant increase in EDU incorporation, which was blocked in the presence of TTX (Fig. 7c). This increase in EDU-positive OPCs was mainly caused by cells that reside in neuron-rich areas, whereas the number of EDU-positive OPCs within axo-dendritic areas remained unaltered (Fig. 7d). We also detected a small increase in the number of myelinating oligodendrocytes after two days of 4-AP incubation, which was, however, much less pronounced (Fig. 7e, Extended Data Fig. 7d).
Lastly, we tested whether intracellular calcium signaling is necessary for 4-AP triggered proliferation by expressing the calcium exporting pump hPMCA2w/b (referred to as CalEx), in order to reduce OPC calcium signaling as was recently established in astrocytes 39. Single mCherry-CalEx expressing OPCs showed similar division rates as control cells (Fig. 7f, g). However, in contrast to control OPCs, where 4-AP application triggered cell divisions (Fig. 7f), mCherry-CalEx expressing OPCs did not show increased proliferation upon 4-AP incubation (Fig. 7g). Therefore, these data indicate that neural activity differentially affects the proliferation of distinct OPC subgroups, and that the OPC divisions triggered by 4-AP application require intracellular calcium signalling.
Discussion
Various differences have been assigned to OPC subsets, depending on origin, age, and local environment in the healthy and diseased brain 8,40. A major remaining question is, however, to what extent the observed differences represent subtypes of OPCs with different functions, or rather different states of cells which all have the same function. Our results reveal that the zebrafish spinal cord is comprised of OPC subtypes with distinct functions relating to regulating OPC numbers and to differentiating into myelinating oligodendrocytes. Such specialisations could either be intrinsically determined, or be induced by extrinsic factors. In the zebrafish spinal cord, no different regional sources have been identified to our knowledge. However, regardless of their developmental origin, our data do not argue for an intrinsic but rather an acquired diversity, mostly because the determining criterium for the acquisition of distinct functional properties is the positioning of the respective OPC soma. Importantly, once OPCs acquired a respective phenotype/function, the same OPC did not switch its role, meaning that the observed diversity of OPC properties reflects subtypes of cells that have functionally segregated rather than transitional states of the same cell. The absence of intrinsic determinants of OPC diversity are in line with previous sequencing studies which reported that OPCs are initially a rather homogenous population, despite their different developmental origins, and that diversification rather occurs with time 10,12,18. Our study extends these findings by showing that one subgroup of OPCs does not fully progress along its lineage, but instead indirectly contributes to the formation of myelinating oligodendrocytes by cell divisions to form a new OPC with a higher likelihood to differentiate.
What controls the differentiation of OPCs? In the mammalian CNS, the most notable differences in OPC differentiation capacities have been assigned to grey and white matter, which represent environments with differential permissiveness for differentiation, believed to be due to differing availability of myelination-competent axons 9. In our system, the processes of all OPCs contact the same cohort of axons and only the OPC cell bodies reside in areas of different cellular densities. Axonal parameters such as caliber, presence/absence of inhibitory signals, or activity-dependent secreted factors are well-established regulators of axon ensheathment fate 41. However, our data argue that these axonal signals are not sufficient to trigger OPC differentiation, a process that likely precedes axon choice for myelination. Our data highlight the importance of the local surroundings of the OPC cell body for the determination of its behavioural subtype and likelihood to differentiate. This finding is of relevance to other models where nuclear densities and axo-dendritic composition differ locally, including different layers of the mammalian cortex, where some OPCs differentiate while others do not for yet unclear reasons. Future studies will be required to identify the nature of how the local environment of the OPC cell body affects its overall behaviour, which could involve signaling molecules or local mechanical forces 42.
Our data have revealed the importance of a recent cell division for OPC differentiation. The link between division and differentiation has previously been documented during mouse cortical development, where OPC differentiation occurs shortly after its last division 43,44. Other studies, however, report direct differentiation of OPCs in the adult mouse cortex, particularly in response to sensory enrichment and learning associated oligodendrogenesis 2,4,28. It remains to be determined whether these differences represent peculiarities of developmental and adult myelination; whether differentiating OPCs in the adult are recently divided cells and therefore intrinsically relatively young; or whether the enhanced oligodrogenesis in adults results from enhanced integration of differentiating cells rather than the triggering of differentiation. Although our data indicate that the likelihood to differentiate decreases as OPCs remain quiescent within the tissue, our study does not rule out that long-persisting OPCs can still differentiate. We found that OPCs committed to differentiate co-expressed markers of proliferation and differentiation, as shown by the appearance of myrf mRNA - a circumstance that is not established in mammals, albeit having been noted 18. We can only speculate about the reasons. One may be that we detected comparably low levels of myrf mRNA and a functional protein might not yet be present. Furthermore, due to the fast development of zebrafish, and the high temporal resolution of our analysis, we may have detected transitional stages of OPC differentiation that are extended over longer periods of time in slower developing animals and have therefore not been noted yet.
In our work, enhanced neural activity primarily increased OPC divisions. We cannot rule out that 4-AP also acts directly on OPCs, although the partial reversal of 4-AP induced OPC GCaMP transients by TTX argues that this effect is at least partially induced by neurons. Activity-dependent stimulation of OPC proliferation has previously been observed following optogenetic stimulation of axonal firing, and in reverse by TTX injections to silence axons 3,26. We found that OPCs that were most sensitive to neural activity were not the cells that likely differentiate to myelinating oligodendrocytes, but which instead divide in response to activity. It is intriguing that the OPCs that most effectively integrate neural activity show elaborate process networks with major stable branches, in contrast to OPCs that readily differentiate and which remodel their entire process network within a short time. Synaptic contacts have been described between axons and OPCs 45 and it would make sense for such synaptic contacts to be localized along OPC processes that remain stable for some time. In line with this, it has been reported that synaptic connections between axons and OPCs are rapidly lost as OPCs differentiate 21,46, and that axonal vesicle release regulates myelination via non-synaptic axon-OPCs contacts 47. These published and our own findings suggest that synaptic axon-OPC contacts are not directly involved in regulating myelination, for example by serving as a signaling hub to define the site of future ensheathment, because the OPCs that likely form synapses with axons are rarely the same cells that ultimately ensheath axons. What is the role of activity integration by OPCs? Our study shows that one function is to control OPC numbers. However, because our data also show that a significant proportion of OPCs are not directly involved in generating new myelin, it raises the question of how else OPCs might use information from neurons to affect the brain, which remains to be addressed in future studies.
Methods Details
Zebrafish lines and husbandry
We used the following existing zebrafish lines and strains: Tg(mbp:nls-EGFP) 48, Tg(mbp:EGFP-CAAX)ue2Tg 49, Tg(mbpa:MA-Cerulean)tm101Tg 30 (here referred to as Tg(mbp:memCerulean), Tg(elavl3:HSA.h2b-GCaMP6s)jf5Tg 50 (here referred to as Tg(elavl3:h2b-GCaMP6s), nacre and AB. The following lines were newly generated for this study: Tg(mfap4:memCerulean), Tg(olig1:GCaMP6m), Tg(olig1:KalTA4), Tg(olig1:memEYFP), Tg(olig1:nls-Cerulean), Tg(olig1:nls-mApple), Tg(mbp:KillerRed), Tg(elavl3:synaptophysin-tagRFP). The olig1 gene regulatory sequence used drives reporter gene expression in OPCs; as OPCs differentiate to myelinating oligodendrocytes, reporter expression is downregulated. All animals were kept at 28.5 degrees with a 14/10 hour (h) light/dark cycle according to local animal welfare regulations. All experiments carried out with zebrafish at protected stages have been approved by the government of Upper Bavaria (animal protocols AZ55.2-1-54-2532-199-2015 and AZ55.2-1-54-2532-200-2015 to T.C.).
Transgenesis constructs
Sequences for all primers used are listed in Supplementary Table 2. In order to generate the middle entry clones pME_GCaMP6m, pME_GCaMP6m-CAAX and pME_mCherry-CalEx, the respective coding sequences were PCR amplified from template plasmids (pGP-CMV-GCaMP6m 51(gift from Douglas Kim & GENIE project, Addgene plasmid #40754); pZAC2.1_GfaABC1D mCherry-hPMCA2w/b 39 (gift from Baljit Khakh)) and recombined with pDONR221 using BP clonase (Invitrogen). The middle entry clone pME_synaptophysin-nostop was generated by BP reaction of the synaptophysin coding sequence that was PCR amplified from an existing template 52 and recombined with pDONR221.
The middle entry clone pME_mScarlet was generated by BP recombination of mScarlet 53, of which the coding sequence with appropriate sites for recombination with pDONR221 was commercially synthesized by BioCat. The middle entry clone pME_KalTA4 has been published previously 54. The middle entry clones pME_nls-Cerulean and pME_nls-mApple were a kind gift of Kristen Kwan (Univeristy of Utah) 55. The 5’ entry clone p5E_mfap4 was generated by PCR amplification of a 1.5 kb DNA fragment of mfap4 upstream regulatory sequence 56 from AB genomic DNA and subsequent BP recombination into pDONRP4P1R (Invitrogen). The 5’ entry clone p5E_elavl3 has been published previously 57.
The expression constructs pTol2_10xUAS:mScarlet, pTol2_10xUAS:mCherry-CalEx, pTol2_olig1(4.2):nls-Cerulean, pTol2_olig1(4.2):nls-mApple, pTol2_olig1(4.2):KalTA4 were generated using the entry clones described above and additional entry clones of the Tol2Kit 55 using Multisite LR recombination reactions. The expression constructs pTol2_olig1(4.2):memEYFP 30, pTol2_mbp:KillerRed 30, and pTol2_cntn1b:mCherry 58 have been published previously.
DNA microinjection for sparse labelling and generation of transgenic lines
Fertilised zebrafish eggs were microinjected with 1nl of an injection solution containing 5-25ng/μl DNA, 25-50ng/μl Tol2 transposase mRNA and 10% phenol red. Injected F0 animals were either used for single cell analysis, or raised to adulthood to generate full transgenic lines. For this, adult F0 animals were outcrossed with wildtype zebrafish and F1 offspring was screened for germline transmission of the fluorescent transgene.
Pharmacological treatments
Zebrafish embryos at 3 and 4 days post fertilisation (dpf) were incubated in 4-aminopyridine (4-AP, Sigma-Aldrich) and/or Tetrodotoxin (TTX, Abcam) in Danieau’s solution. For long-term treatments (6-48 hours), 4-AP was used at 0.1 mM and TTX was used at 50 μM. For short-term treatments (<1 hour), 4-AP was used at 0.5 mM and TTX at 10 μM. Splitomicin (Sigma Aldrich) was incubated from 2 dpf at 4-5 μM until analysis.
Tissue preparation and cryosectioning for histology
5-7 days old zebrafish larvae were euthanised with 4mg/ml MS-222 and immersion fixed overnight at 4°C in 4% paraformaldehyde (PFA). Fixed animals were cryoprotected for a minimum of three days in an increasing concentration of sucrose (10%, 20%, 30%), embedded in TissueTek and stored at -80°C until sectioning. Transversal sections of 14-16 μm thickness were cut using a Leica CM1850UV cryostat and subsequently stored at -80°C until further use.
In-situ hybridisation
RNA probes against zebrafish nkx2.2a (NM_001308640), cspg4 (ENSDART00000112782), myrf (ENSDART00000157117), ptprz1b (XM_005164526.4), and gpr17 (ACD product #504601) were purchased from ACD. We used the RNAscope Multiplex Fluorescent v2 kit (ACD) on cryosections according to the manufacturer’s protocol for fixed-frozen samples. Signals were detected using TSA-conjugated Opal dyes as listed in Supplementary Table 3 (Perkin Elmer). After RNA hybridisation, immunohistochemistry was carried out to detect transgenically expressed fluorescent proteins as described.
Immunohistochemistry
All antibodies used are listed in Supplementary Table 3. First, sections were blocked for 1.5 h at room temperature in PBS, 0.1% Tween20, 10% FCS, 0.1% BSA and 3% normal goat serum. Primary antibodies were incubated overnight at 4°C in blocking solution. Afterwards, sections were washed three times in PBS, 0.1% Tween20 and then incubated with appropriate Alexa Fluor-conjugated secondary antibodies (Invitrogen). Stained sections were washed two times in PBS, 0.1% Tween20 and once in PBS and subsequently mounted with ProLong Diamond Antifade Mountant with DAPI (Thermo Fisher Scientific). Sections were stored at 4°C.
EDU incorporation assay
At 4 dpf Tg(olig1:nls-mApple) zebrafish embryos were incubated in 0.4 mM 5-ethynyl-2’-deoxyuridine (EDU) in Danieau’s solution. After 6 h incubation, embryos were incubated for 15 minutes in 2mg/ml Pronase (Sigma Aldrich) and subsequently fixed for 2h in 4% PFA. Whole embryos and transverse spinal cord sections were stained for EDU using the Click-IT™ Alexa Fluor™ 647 Imaging Kit (ThermoFisher Scientific) as detailed in the kit protocol, with the exception of a 1.5h ClickIT reaction incubation time. Afterwards, immunofluorescence staining was performed for transgene detection.
Mounting of embryonic and larval zebrafish for live cell microscopy
Animals were either anaesthetized with 0.2 mg/ml MS-222 (PHARMAQ, UK), or (in case of GCaMP imaging) immobilized with 0.5 mg/ml of the non-depolarizing neuromuscular junction blocker mivacurium chloride (Abcam). For confocal microscopy, animals were mounted laterally in 1% ultrapure low melting point agarose (Invitrogen) on a glass coverslip. The coverslip was flipped over on a glass slide with a ring of high-vacuum grease filled with a drop of Danieau’s solution to prevent drying out of the agarose. For lightsheet microscopy, embryos were mounted upright in low melting point agarose in a U-shaped glass capillary (Leica). After imaging, the animals were either sacrificed or released from the agarose using microsurgery blades and kept individually until further use.
Confocal microscopy
12-bit confocal images were acquired on Leica TCS SP8 laser scanning microscopes. We used 405 nm wavelength for excitation of DAPI; 448 and 458 nm for excitation of Cerulean; 488 nm for EGFP and Alexa Fluor(AF) 488; 514 nm for EYFP; 552 and 561 nm for mApple, mScarlet, mCherry, tagRFP, and AF555; 633 nm for AF633, AF647, Opal650 and BODIPY630/650. For fast confocal live cell imaging of cell motility and GCaMP transients, we used an 8 kHz resonant scanner. All other acquisitions were carried out with a Galvo scanner. For overview images and analysis of cell numbers (i.e. nuclear transgenes and EDU), we used 10x/0.4NA (acquisition with 568nm pixel size (xy), 2 μm z-spacing) and 20x/0.7NA (acquisition with 142nm pixel size (xy), 1 μm z-spacing) objectives. For analysis of stained cryosections, we used 63x/1.2NA H2O, and 63x/1.3NA glycerol objectives and acquired images with at least 100nm pixel size (xy) and 1 μm z-spacing. For all other analysis, images were acquired using a 25x/0.95NA H2O objective with 114-151nm pixel size (xy) and 1 μm z-spacing. When images were acquired for subsequent deconvolution, x/y/z parameters were increased closer to Nyquist resolution to be compatible for processing with Huygens software.
Lightsheet microscopy
Lightsheet images were acquired at a Leica TCS SP8 DLS using a 2.5x/0.07NA illumination objective and 10X/0.3NA and 25X/0.95NA detection objectives with 2.5 mm deflection mirrors. Timelapses of GCaMP fluorescence were acquired using 488 nm excitation wavelength. A ROI was drawn around either individual cells or a portion (5-7 somites) of whole zebrafish spinal cord tissue. Time-lapses of z-stacks were taken with a frame rate of 0.5-1Hz for 2x10 minutes, with a break of 10 minutes in between.
Assessment of zebrafish swimming behaviour
Single 4 dpf zebrafish were placed in a 3 cm dish in 3 ml Danieau’s solution (± 0.1 mM 4-AP and/or 50 μM TTX) and imaged for two minutes at 16 frames per second using a Hamamatsu Orca-05G equipped with a Kowa LM35JC10M objective.
Fluorescence activated cell sorting of single zebrafish OPCs
Approximately 2000 Tg(olig1:memEYFP) at 5 dpf were euthanised and de-yolked by repetitive pipetting embryos in de-yolking buffer (55 mM NaCl, 1.2 mM KCl, 1.25 mM NaHCO3) with a P1000 pipette tip. Following two wash steps in Danieau’s buffer and centrifugation for 1’ at 300 g, tissues were digested for 30 minutes at 37°C in a shaking incubator using the Papain Dissociation Kit (Worthington Biochemical Corporations) according to manufacturer’s instructions. The obtained cell pellet was resuspended in FACSmax Cell Dissociation Buffer (Amsbio) with 5-10% FCS and filtered through a 30 μm Filcon syringe (BD Bioscience) before sorting. Sorting of olig1:memEYFP cells followed a two-step protocol using a MoFlo XDP cell sorter (Beckman Coulter). First, approximately 100,000 EYFP-positive / propidium iodide (Thermo Fisher Scientific)-negative cells were sorted to exclude dead cells. The obtained cell suspension was then sorted again for EYFP-positive / Vybrant DyeCycle™Ruby (Thermo Fisher Scientific) -positive cells. Single cells were sorted into each well of a 384-well plate containing RNA lysis buffer for Smart-Seq2 (provided by ESCG of the Karolinska Institutet, Stockholm), as described in previously published work 31. Plates were stored at -80°C until further processing.
Single-cell RNA sequencing
Single cell sequencing was performed on an Illumina HiSeq2500 instrument with the following specifications. The run was on a high-output flow cell with 50 bp single-read, clustered on a cBot with V4 kit. Reads were trimmed with Cutadapt 1.8.0 59 and aligned to the reference genome GRCz11 using STAR 2.5.1.b 60 and using ENSEMBL94 transcript annotations, with the following parameters: --sjdbFileChrStartEnd SJ.out.tab --sjdbScore 0, --outFilterMatchNmin 10, --outSAMunmapped Within, --quantMode TranscriptomeSAM, including the splicing junction database calculated by STAR on the same single cells in a first alignment. Aligned single cell reads were sorted and transformed to bam files using Samtools 1.3. Gene expression was calculated with Salmon 0.9.1 61 using the sorted bam files as input; from the outputs we used the TPM gene expression values to build the expression matrix for the 384 cells. Alignment resulted in an average 800.000 reads per cell and an average of 4959 detected genes per cell.
Cells were clustered with Seurat 3 62 and filtered based on the distribution of gene expression (minimum 500 genes detected per cell) and mitochondrial gene expression (maximum 0.05%). The remaining 310 cells were log-normalized individually with a scale of factor of 10,000. For downstream analyses we used the top 2000 variable genes. The shared-nearest neighbour (SNN) graph was constructed on cell-to-cell distance matrix from top 50 PCs. The SNN graph with resolution 1 was used as an input for the smart local moving (SLM) algorithm to obtain cell clusters, and visualized with t-distributed stochastic neighbour embedding (t-SNE). We identified 5 cell clusters where significantly differentially expressed genes (Wilcoxon rank sum test, min.pct = 0.25, thresh.use = 0.25, test.use = “wilcox”) list for each of the clusters allowed us to identify 2 VLMC clusters, 1 OL cluster, and 2 OPC clusters. Analysis of individual genes involved in proliferation and differentiation, such as top2a, myrf and gpr17, indicated further segregated expression of these genes in subsets of cells within one of the OPC clusters. Specific markers for visualization on the t-SNE allowed us to identify 3 subclusters of OPCs that were later subset based on gene marker expression. Further increase in clustering resolution, using findclusters function from Seurat v3 resolution 2, allowed to corroborate the 3 OPC subclusters in an unsupervised manner (Supplementary Fig. 1a-c).
In order to measure the possible effect of the cell cycle genes in the dataset, we retrieved all cell cycle genes from Gene Ontology annotations from Biomart and the human gene lists from Seurat v3 for S phase and G2M phase genes (Supplementary Fig. 1d-g). The human gene symbol and ENSEMBL annotations were transformed to zebrafish ortholog gene name symbols using Biomart. For each of the cells a score was calculated based on S phase and G2m phase gene expression, Seurat v3 Addmodulescore function. The cell cycle scoring predicted the phase of each cell, where some of the OPC subclusters, OPC_3 and OPC_4, were assigned to G2m phase and OPC_2 to S and G2m phases (Supplementary Fig. 1h). To test potential effects of cycle genes in our clustering, the data preprocessing was repeated regressing out the cell cycle scores during the data scaling, where the cell cycle PCs were removed. The final PCA did not show segregation based on cell cycle (Supplementary Fig. 1i).
For subsequent analysis, we used the expression matrix including the cell cycle genes. Shared-nearest neighbour (SNN) graph was constructed on cell-to-cell distance matrix from top 10 PCs, with the top 2000 variable genes. The SNN graph with resolution 1 was used as an input for the smart local moving (SLM) algorithm to obtain cell clusters, and visualized with t-distributed stochastic neighbour embedding (t-SNE). The resulting clusters overlay with the previously defined clusters. Comparison between cell cycle regress (regressing out the cell cycle scores during the data scaling) and non-regress did not lead to major changes on the main cell type clusters (Supplementary Fig. 1d).
GO Term analysis of the different clusters was performed with ClueGo 63 using the top 30 upregulated genes within each cluster compared to all other clusters. We selected the following parameters: significant terms p<0.05 (Right-sided hypergeometric test for Enrichment, Benjamin-Hochberg p value correction) from the following databases: GO/Biological Processes (27-02-2019), GO/Molecular_Function (27-02-2019), Reactome/Pathways (27-02-2019) for all GO Tree intervals using GO term fusion. Genes from each cluster must represent at least 1% of all genes within a GO term (with a minimal absolute number of n=2 for cluster OPC #1, n=3 for OPC #4, n=6 for OPC #2, and n=7 for OPC #3) to be assigned to this cluster. The kappa score was always set to 0.4.
Analysis and presentation of imaging data
All data were analysed using Fiji 64, Imaris 8.4.2 (Bitplane), Huygens Essential, Matlab, Microsoft Excel, Graphpad Prism, Adobe Photoshop and Illustrator. The Imaris Filament Tracer was used for three-dimensional reconstructions of OPC morphology. First, by tracing of the entire process network of individual OPCs we obtained information on total process length and branch point number of a cell. Second, we constructed a 3-dimentional hull around the filament network to obtain a measure for the volume of a cell using the Surface Tool in Imaris. Cell complexity was expressed as product of branch point density (branch point number divided by summed process length) and volume.
To analyse process remodelling dynamics of individual cells, cumulative maximum intensity time-projections of inverted greyscale images of OPC timelapses were generated to obtain a measure of the percentage of stable cell proportion at each time point relative to the starting time point. Measurements were done using the FIJI-plugin NeuronJ 65.
To trace GCaMP transients, regions of interest (ROI) were drawn using the Fiji ROI manager around the somata and/or processes of single cells. Traces of individual ROI are shown as ΔF/F0 by expressing the maximum fluorescent intensity at each time point normalised to the first 100 frames of each ROI using a custom written Matlab script. GCaMP transients were counted as events when they were above 40% ΔF/F0 for the frequency of somatic transients, and 30% ΔF/F0 for all other analyses. The duration of GCaMP transients is given as the half-width of the maximum ΔF/F0 for each event. To analyse changes in GCaMP frequency after pharmacological treatments, we used mean intensity of GCaMP fluorescence traces in ROI that were drawn around the same cells/processes in each treatment condition (baseline, after 4-AP, after TTX). For each ROI, fluorescence was normalised to the first 100 frames, and GCaMP events were determined using a threshold of 30% above average fluorescence change using the spike detrend function (https://de.mathworks.com/help/finance/tsmovavg.html).
Statistics and Reproducibility
For analysis that involved cohorts of animals or treatment groups, zebrafish embryos of all conditions were derived from the same clutch and selected at random prior to treatment. No additional randomisation was used during data collection. For time-lapse and cell fate analyses of OPCs, zebrafish were screened for single cell labelling before imaging and all animals with appropriate expression were used in the experiment. Data collection and analysis were not performed blind to the conditions of the experiments. No data were excluded from the analysis.
We selected sample sizes based on similar sample sizes we and others have previously reported for similar experiments 38,58,66–68. No statistical analysis was used to pre-determine sample sizes. Analysis was done with Microsoft Excel and Graphpad Prism. All data were tested for normal distribution using the Shapiro-Wilk normality test before statistical testing. In the figures, normally distributed data are shown as mean ± standard deviation (SD) or 95% confidence intervals (CI), whereas non-normally distributed data are given as median with the 25% and 75% percentiles. For statistical tests of normally distributed data comparing two groups, we used unpaired t tests. Non-normally distributed data were tested for statistical significance using Mann-Whitney U test (unpaired data) and Wilcoxon signed-rank test (paired data). To compare multiple (>2) groups, ANOVA was used in combination with Tukey’s (parametric) or Dunn’s (non-parametric) multiple comparisons test (Friedman for paired, Kruskal-Wallis for unpaired data). To analyse contingency tables, we used Fisher’s exact test. Statistical significance is given as p-value in the figure legends, and indicated as *(p < 0.05), **(p < 0.01), ***(p < 0.001) in the figures.
Extended Data
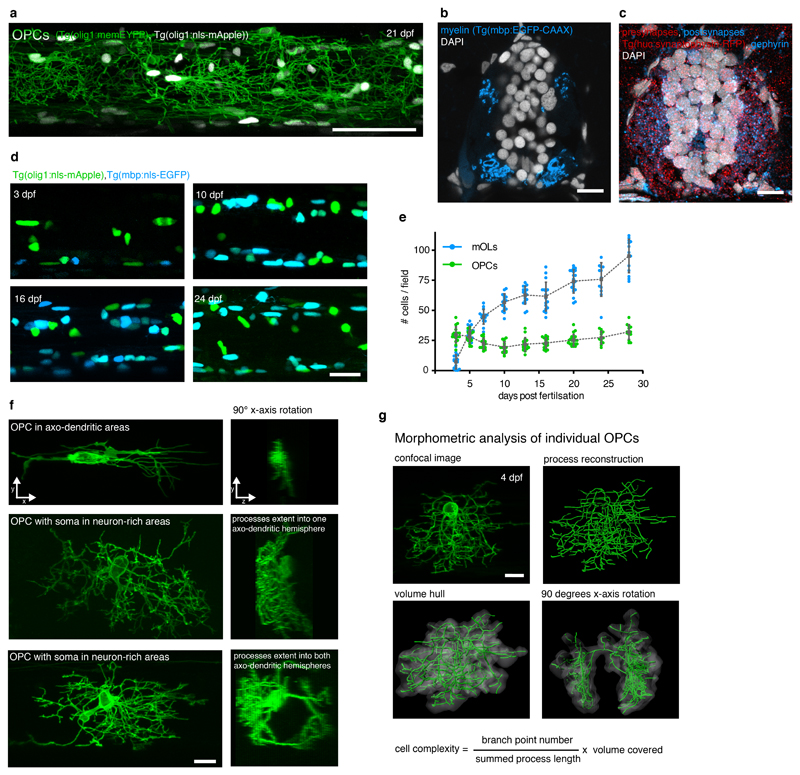
Extended Data Fig. 1. Characterisation of OPCs in the zebrafish spinal cord.
a) Confocal image of a Tg(olig1:memEYFP), Tg(olig1:nls-mApple) zebrafish at the level of the spinal cord at 21 dpf (example of 3 animals from 1 experiment). Scale bar: 50 μm.
b) Cross-sectional view of the spinal cord showing the distribution of myelin in Tg(mbp:EGFP-CAAX) at 7 dpf (example of 12 animals from 4 experiments). Scale bar: 10 μm.
c) Cross-sectional view of the spinal cord showing the distribution of pre- and postsynapses (Tg(elavl3:synaptophysin-RFP), anti-mCherry, anti-gephyrin) at 7 dpf (example of 12 animals from 4 experiments). Scale bar: 10 μm.
d) Confocal images of Tg(mbp:nls-EGFP), Tg(olig1:nls-mApple) transgenic animals between 4 and 28 days post fertilization (n numbers as in panel e). Scale bar: 20 μm.
e) Cell numbers of OPCs (olig1: nls-mApple-pos., mbp:nls-EGFP-neg.) and myelinating oligodendrocytes (mbp:nls-EGFP-pos.) in the spinal cord. Data are expressed as mean cells/field ± SD at 3/5/7/10/13/16/20/24/28 dpf (OPCs: 29.6±6.4 vs. 28.1±5.2 vs. 22.3±4.3 vs.19.3±4.5 vs. 21.7±5.4 vs. 22.6±4.2 vs. 25.3±4.6 vs. 27.3±5.1 vs. 32.0±5.9; mOLs: 7.3±5.7 vs. 31.1±5.5 vs. 44.7±6.0 vs. 56.6±6.9 vs. 62.6±7.2 vs. 61.5±11.6 vs. 74.1±9.4 vs. 75.7±13.3 vs. 95.2±13.4; n animals / experiments=17/2, 15/3, 15/3, 16/3, 17/2, 17/2, 20/3, 12/3, 13/3).
f) Example images of individual OPCs labelled showing a range of morphologies. The soma can be localised within axo-dendritic (top) or neuron-rich areas (middle, bottom). The process network of an individual cell can be restricted to one side of the spinal cord (top and middle cells), but it can also reach to both sides of the spinal cord (bottom cell) (n numbers as in panel g). Scale bar: 10 μm.
g) OPC morphometry using three-dimensional process tracing and creation of a volume hull around the reconstructed filaments (n=228 cells from 56 animals between 3 and 16 dpf in 24 experiments). Scale bar: 10 μm.
Extended Data Fig. 2. Analysis of scRNA sequencing clusters.
a) Schematic overview of cell isolation, sorting and sequencing.
b) Flow cytometry plots of olig1:memEYFP-sorted cells and wildtype control animals. Dotted lines indicate the gating used (example from two independent experiments).
c) TSNE plot showing expression of sox10 (total sample size n=310 cells). Immunohistochemistry for Sox10 on transversal spinal cord sections of 7 dpf Tg(olig1:nls-mApple), Tg(mbp:nls-EGFP) animals and quantification of Sox10-expressing OPCs (olig1:nls-mApple-positive, mbp:nls-EGFP-negative) in neuron-rich and axo-dendritic areas (100% (68/68) vs 100% (49/49) pos cells, n=16 animals / 4 experiments). Dotted lines in the image indicate the outlines of the spinal cord. Scale bar:10 μm.
d) TSNE plot showing expression of olig2 and nkx2.2a (sample size as in panel c).
e) TSNE plot showing expression of ppp1r14bb, mbpa, and plp1a (sample size as in panel c).
f) Confocal images with in situ hybridisations for cspg4, gpr17, myrf, and labelling of EDU incorporated cells on transversal spinal cord sections of 7 dpf Tg(olig1:nls-mApple), Tg(mbp:nls-EGFP) animals (see Fig. 2e, 2i, 2k, 2l for respective n numbers). Scale bar: 10 μm.
Extended Data Fig. 3. Quantification of OPC morphology and position prior to differentiation.
Quantification OPC complexity and soma position from imaging timelines between 3 and 15 dpf. Measured is the last timepoint as OPC prior to differentiation, as assessed by myelin sheath formation (imaging intervals of 1d between 3 and 7 dpf, and 2d between 7 and 15 dpf). N=10/6/3/3/3/2/1/2/2/2/1/5/1 cells at 3/4/5/6/7/8/9/10/11/12/13/14/15 dpf. Data from 23 animals in 6 experiments.
Extended Data Fig. 4. Time-lapse imaging of OPC population dynamics.
a) Overview images of transgenic zebrafish labelling nuclei of OPCs (olig1:nls-mApple) and myelinating oligodendrocytes (mbp:nls-EGFP) at the beginning and end of a timelapse between 3-5 dpf. Dashed boxes indicate the areas shown in panel c (n=3 animals in 2 experiments). Scale bar: 10 μm.
b) Quantification of the fates of OPCs found in neuron-rich areas – detailed breakdown of data shown in Fig 4e.
c) Zoom-ins and false colouring of the timelapse shown in panel a showing potential behaviours of OPCs in neuron-rich areas by either remaining quiescent (red cell), generation of new OPCs in neuron-rich areas (magenta cells), or the generation of new OPCs in axo-dendritic areas (green cells). The insets at first and last timepoint show the absence of myelin markers (mbp:nls-EGFP) in the cells studied (n=3 animals in 2 experiments). Scale bar: 10 μm.
Extended Data Fig. 5. Cell Fate Analysis of OPCs with their soma in neuron-rich areas.
a) Time series of an individual OPC with its soma in neuron-rich areas that gives rise to myelinating oligodendrocytes by proliferation-mediated generation of daughter OPCs in axo-dendritic areas. Left panel: Confocal images. Middle panel: Reconstructions of the starting cell and individual daughter cells (cells that will differentiate are shown in blue). Right panels: Y-axis rotations showing olig1:nls-mApple cell body positions within the hemi-spinal cord. Dashed lines depict the outline of the spinal cord. One of 8 examples from 7 animals in 6 experiments. Scale bar: 10 μm.
b) Graphical summary of cell fates from the data analysed in Figures 5a-d. See also Supplementary Figure 2.
Extended Data Fig. 6. Characterisation of OPC GCaMP reporter lines.
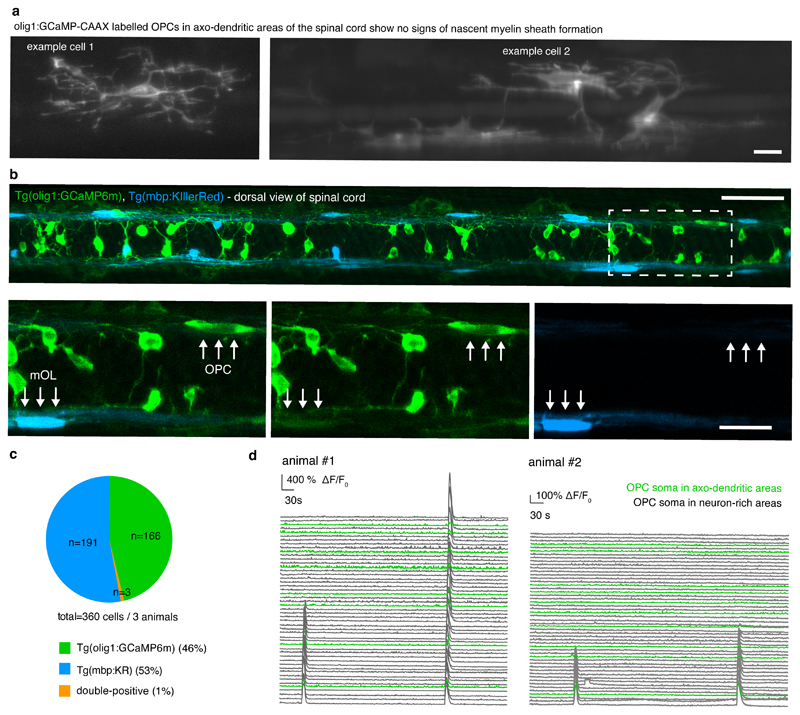
a) Example images of individual olig1:GCaMP-CAAX labelled OPCs in axo-dendritic areas of the zebrafish spinal cord at 4 dpf. The absence of nascent ensheathments indicates that these cells are not early differentiating oligodendrocytes (n=9 independent experiments). Scale bar: 10 μm.
b) Dorsal views of Tg(olig1:GCaMP6m), Tg(mbp:KillerRed) transgenic zebrafish at 4 dpf to label OPCs and differentiated oligodendrocytes. Dotted box indicates position of zoom-ins in bottom row (n=3 animals in 1 experiment). Scale bars: 50 μm (top) and 20 μm (bottom).
c) Quantification of single and double-positive cells from images as shown in b.
d) ΔF/F0 GCaMP transients of individual cells in two Tg(olig1:GCaMP6m) zebrafish. Green traces depict cells in axo-dendritic areas, grey traces depict cells in neuron-rich areas (total of 8 animals in 8 experiments).
Extended Data Fig. 7. Effects of chronic 4-AP incubation on zebrafish.
a) Minimum intensity projections of a two-minute time-lapse of fish freely swimming in a 3 cm petri dish in different treatment conditions (n=6/7/3/3 animals in control/4-AP/TTX/4-AP+TTX, 3 independent experiments).
b) Traces of GCaMP transients Tg(elavl3:h2b-GCaMP6s) zebrafish at 4 dpf and after overnight incubation in 0.1 mM 4-AP, and before / after 10 μM TTX (7 animals per conditions in 2 experiments).
c) Confocal images of Tg(mfap4:memCerulean), Tg(olig1:nls-mApple) zebrafish at 4 dpf after treatment with 0.1 mM 4-AP, 0.5 mM 4-AP, or Danieau’s solution as control. Transmitted light images to show spinal cord morphology and tissue integrity following drug treatment. Scale bars: 100 μm. The graph shows that number of macrophages which accumulate in 400 μM length of spinal cord of Tg(mfap4:memCerulean) zebrafish after 1 day of control (2±0.25/2 cells), 0.1 mM (2±1/2 cells), and 0.5 mM (3±0.25/2 cells) 4-AP treatment (median (25%/75% percentiles); p=0.43 (control vs. 0.1mM 4-AP), p=0.03 (control vs. 0.5 mM 4-AP) (Kruskal-Wallis test, test statistic=3.003), n=16/19/8 animals in 3 experiments.
d) Representative images of Tg(mbp:nls-EGFP), Tg(olig1:nls-mApple) zebrafish in control and after 2 days of 0.1 mM 4-AP treatment (see Fig 7g for n numbers). Scale bar: 20 μm.
Supplementary Material
Acknowledgements
We are grateful to Rafael Almeida, David Lyons, Thomas Misgeld, Mikael Simons, and all members of the Czopka lab for their comments and suggestions during the assembly of the data and their presentation in this manuscript. We want to thank Baljit Khakh (Dept of Physiology, UCLA) for the CalEx plasmid prior to publication, Kristen Kwan (Dept of Human Genetics, University of Utah) for providing pME_nls-Cerulean and pME_nls-mApple plasmids, and Douglas Kim (HMNI Janilia Research Campus) for the GCaMP6m plasmid. We thank Single Cell Genomics Facility, Science for Life Laboratory, the National Genomics Infrastructure (NGI) and Uppmax for providing assistance in massive parallel sequencing and computational infrastructure. The bioinformatics computations were performed on resources provided by the Swedish National Infrastructure for Computing (SNIC) at UPPMAX, Uppsala University. E.A. is funded by European Union, Horizon 2020, Marie-Skłodowska Curie Actions, grant SOLO, number 794689. Work in G.C.-B.’s research group was supported by Swedish Research Council (grant 2015-03558), European Union (Horizon 2020 Research and Innovation Programme/ European Research Council Consolidator Grant EPIScOPE, grant agreement number 681893), Swedish Brain Foundation (FO2017-0075), Ming Wai Lau Centre for Reparative Medicine and Karolinska Institutet. Work in T.C.’s research group was funded by a Starting Grant of the European Research Council (ERC StG MecMy, grant agreement number 714440), the Deutsche Forschungsgemeinschaft (DFG, German Research Foundation) under its Emmy Noether programme for young investigators (ENP CZ226/1-1), and the DFG’s Excellence Strategy within the framework of the Munich Cluster for Systems Neurology (EXC 2145 SyNergy – ID 390857198).
Footnotes
Data availability
Raw sequence data, gene expression and cell type annotation tables have been deposited in the Gene Expression Omnibus (GEO) under accession number GSE132166. A webresource is available at https://ki.se/en/mbb/oligointernode.
The data that support the findings of this study are available from the corresponding author upon reasonable request.
Life Sciences Reporting Summary
Additional information on experimental design and reagents is available in the Nature Research Reporting Summary linked to this article.
Accession codes
Raw sequence data, gene expression and cell type annotation tables have been deposited in the Gene Expression Omnibus (GEO) under accession number GSE132166.
Author Contributions
Experiments were designed by T.H., R.M., L.J.H., W.B., G.C.B. and T.C.. Experiments were conducted by T.H., R.M., L.J.H., W.B. and F.A. Imaging data were analysed by T.H., R.M., L.J.H. and T.C.. E.A. and G.C.B. did the bioinformatic analysis of RNA sequencing data. T.C. conceived the project and wrote the manuscript with input from all authors.
Competing Interests Statement
The authors declare no competing interests.
References
- 1.Bergles DE, Richardson WD. Oligodendrocyte Development and Plasticity. Cold Spring Harb Perspect Biol. 2015;8:a020453. doi: 10.1101/cshperspect.a020453. [DOI] [PMC free article] [PubMed] [Google Scholar]
- 2.Hughes EG, Orthmann-Murphy JL, Langseth AJ, Bergles DE. Myelin remodeling through experience-dependent oligodendrogenesis in the adult somatosensory cortex. Nat Neurosci. 2018;21:696–706. doi: 10.1038/s41593-018-0121-5. [DOI] [PMC free article] [PubMed] [Google Scholar]
- 3.Gibson EM, et al. Neuronal Activity Promotes Oligodendrogenesis and Adaptive Myelination in the Mammalian Brain. Science. 2014;344 doi: 10.1126/science.1252304. 1252304. [DOI] [PMC free article] [PubMed] [Google Scholar]
- 4.McKenzie IA, et al. Motor skill learning requires active central myelination. Science. 2014;346:318–322. doi: 10.1126/science.1254960. [DOI] [PMC free article] [PubMed] [Google Scholar]
- 5.Zawadzka M, et al. CNS-resident glial progenitor/stem cells produce Schwann cells as well as oligodendrocytes during repair of CNS demyelination. Cell Stem Cell. 2010;6:578–590. doi: 10.1016/j.stem.2010.04.002. [DOI] [PMC free article] [PubMed] [Google Scholar]
- 6.Emery B, Lu QR. Transcriptional and Epigenetic Regulation of Oligodendrocyte Development and Myelination in the Central Nervous System. Cold Spring Harb Perspect Biol. 2015;7:a020461. doi: 10.1101/cshperspect.a020461. [DOI] [PMC free article] [PubMed] [Google Scholar]
- 7.Liu J, Moyon S, Hernandez M, Casaccia P. Epigenetic control of oligodendrocyte development: adding new players to old keepers. Current Opinion in Neurobiology. 2016;39:133–138. doi: 10.1016/j.conb.2016.06.002. [DOI] [PMC free article] [PubMed] [Google Scholar]
- 8.Foerster S, Hill MFE, Franklin RJM. Diversity in the oligodendrocyte lineage: Plasticity or heterogeneity? Glia. 2019;25:2411. doi: 10.1002/glia.23607. [DOI] [PubMed] [Google Scholar]
- 9.Viganò F, Dimou L. The heterogenic nature of NG2-glia. Brain Res. 2015;1638:129–137. doi: 10.1016/j.brainres.2015.09.012. [DOI] [PubMed] [Google Scholar]
- 10.Marques S, et al. Oligodendrocyte heterogeneity in the mouse juvenile and adult central nervous system. Science. 2016;352:1326–1329. doi: 10.1126/science.aaf6463. [DOI] [PMC free article] [PubMed] [Google Scholar]
- 11.Emery B, Barres BA. Unlocking CNS cell type heterogeneity. Cell. 2008;135:596–598. doi: 10.1016/j.cell.2008.10.031. [DOI] [PubMed] [Google Scholar]
- 12.Marques S, et al. Transcriptional Convergence of Oligodendrocyte Lineage Progenitors during Development. Developmental Cell. 2018;46:504–517.e7. doi: 10.1016/j.devcel.2018.07.005. [DOI] [PMC free article] [PubMed] [Google Scholar]
- 13.Richardson WD, Young KM, Tripathi RB, McKenzie I. NG2-glia as Multipotent Neural Stem Cells: Fact or Fantasy? Neuron. 2011;70:661–673. doi: 10.1016/j.neuron.2011.05.013. [DOI] [PMC free article] [PubMed] [Google Scholar]
- 14.Hill RA, Patel KD, Medved J, Reiss AM, Nishiyama A. NG2 cells in white matter but not gray matter proliferate in response to PDGF. Journal of Neuroscience. 2013;33:14558–14566. doi: 10.1523/JNEUROSCI.2001-12.2013. [DOI] [PMC free article] [PubMed] [Google Scholar]
- 15.Viganò F, Möbius W, Götz M, Dimou L. Transplantation reveals regionaldifferences in oligodendrocytedifferentiation in the adult brain. Nat Neurosci. 2013;16:1370–1372. doi: 10.1038/nn.3503. [DOI] [PubMed] [Google Scholar]
- 16.Falcão AM, et al. Disease-specific oligodendrocyte lineage cells arise in multiple sclerosis. Nat Med. 2018;24:1837–1844. doi: 10.1038/s41591-018-0236-y. [DOI] [PMC free article] [PubMed] [Google Scholar]
- 17.Jäkel S, et al. Altered human oligodendrocyte heterogeneity in multiple sclerosis. Nature. 2019;566:543–547. doi: 10.1038/s41586-019-0903-2. [DOI] [PMC free article] [PubMed] [Google Scholar]
- 18.Spitzer SO, et al. Oligodendrocyte Progenitor Cells Become Regionally Diverse and Heterogeneous with Age. Neuron. 2019;101:459–471.E5. doi: 10.1016/j.neuron.2018.12.020. [DOI] [PMC free article] [PubMed] [Google Scholar]
- 19.Sakry D, et al. Oligodendrocyte precursor cells modulate the neuronal network by activity-dependent ectodomain cleavage of glial NG2. Plos Biol. 2014;12:e1001993. doi: 10.1371/journal.pbio.1001993. [DOI] [PMC free article] [PubMed] [Google Scholar]
- 20.Bergles DE, Roberts J, Somogyl P, Jahr C. Glutamatergic synapses on oligodendrocyte precursor cells in the hippocampus. Nature. 2000;405:187–191. doi: 10.1038/35012083. [DOI] [PubMed] [Google Scholar]
- 21.De Biase LM, Nishiyama A, Bergles DE. Excitability and synaptic communication within the oligodendrocyte lineage. Journal of Neuroscience. 2010;30:3600–3611. doi: 10.1523/JNEUROSCI.6000-09.2010. [DOI] [PMC free article] [PubMed] [Google Scholar]
- 22.Kukley M, Capetillo-Zarate E, Dietrich D. Vesicular glutamate release from axons in white matter. Nat Neurosci. 2007;10:311–320. doi: 10.1038/nn1850. [DOI] [PubMed] [Google Scholar]
- 23.Orduz D, et al. Interneurons and oligodendrocyte progenitors form a structured synaptic network in the developing neocortex. Elife. 2015;4:e06953. doi: 10.7554/eLife.06953. [DOI] [PMC free article] [PubMed] [Google Scholar]
- 24.Káradóttir R, Cavelier P, Bergersen LH, Attwell D. NMDA receptors are expressed in oligodendrocytes and activated in ischaemia. Nature. 2005;438:1162–1166. doi: 10.1038/nature04302. [DOI] [PMC free article] [PubMed] [Google Scholar]
- 25.Chittajallu R, Aguirre A, Gallo V. NG2-positive cells in the mouse white and grey matter display distinct physiological properties. The Journal of Physiology. 2004;561:109–122. doi: 10.1113/jphysiol.2004.074252. [DOI] [PMC free article] [PubMed] [Google Scholar]
- 26.Barres BA, Raff MC. Proliferation of oligodendrocyte precursor cells depends on electrical activity in axons. Nature. 1993;361:258–260. doi: 10.1038/361258a0. [DOI] [PubMed] [Google Scholar]
- 27.Makinodan M, Rosen KM, Ito S, Corfas G. A Critical Period for Social Experience-Dependent Oligodendrocyte Maturation and Myelination. Science. 2012;337:1357–1360. doi: 10.1126/science.1220845. [DOI] [PMC free article] [PubMed] [Google Scholar]
- 28.Xiao L, et al. Rapid production of new oligodendrocytes is required in the earliest stages of motor-skill learning. Nat Neurosci. 2016;19:1210–1217. doi: 10.1038/nn.4351. [DOI] [PMC free article] [PubMed] [Google Scholar]
- 29.Schebesta M, Serluca FC. olig1 Expression identifies developing oligodendrocytes in zebrafish and requires hedgehog and notch signaling. Dev Dyn. 2009;238:887–898. doi: 10.1002/dvdy.21909. [DOI] [PubMed] [Google Scholar]
- 30.Auer F, Vagionitis S, Czopka T. Evidence for Myelin Sheath Remodeling in the CNS Revealed by In Vivo Imaging. Current Biology. 2018;28:549–559.e3. doi: 10.1016/j.cub.2018.01.017. [DOI] [PubMed] [Google Scholar]
- 31.Picelli S, et al. Smart-seq2 for sensitive full-length transcriptome profiling in single cells. Nat Meth. 2013;10:1096–1098. doi: 10.1038/nmeth.2639. [DOI] [PubMed] [Google Scholar]
- 32.Chen Y, et al. The oligodendrocyte-specific G protein-coupled receptor GPR17 is a cell-intrinsic timer of myelination. Nat Neurosci. 2009;12:1398–1406. doi: 10.1038/nn.2410. [DOI] [PMC free article] [PubMed] [Google Scholar]
- 33.Viganò F, et al. GPR17 expressing NG2-Glia: Oligodendrocyte progenitors serving as a reserve pool after injury. Glia. 2015;64:287–299. doi: 10.1002/glia.22929. [DOI] [PubMed] [Google Scholar]
- 34.Emery B, et al. Myelin gene regulatory factor is a critical transcriptional regulator required for CNS myelination. Cell. 2009;138:172–185. doi: 10.1016/j.cell.2009.04.031. [DOI] [PMC free article] [PubMed] [Google Scholar]
- 35.Early JJ, et al. An automated high-resolution in vivo screen in zebrafish to identify chemical regulators of myelination. Elife. 2018;7 doi: 10.7554/eLife.35136. [DOI] [PMC free article] [PubMed] [Google Scholar]
- 36.Kirischuk S, Scherer J, Möller T, Verkhratsky A, Kettenmann H. Subcellular heterogeneity of voltage-gated Ca2+ channels in cells of the oligodendrocyte lineage. Glia. 1995;13:1–12. doi: 10.1002/glia.440130102. [DOI] [PubMed] [Google Scholar]
- 37.Pende M, Holtzclaw LA, Curtis JL, Russell JT, Gallo V. Glutamate regulates intracellular calcium and gene expression in oligodendrocyte progenitors through the activation of DL-alpha-amino-3-hydroxy-5-methyl-4-isoxazolepropionic acid receptors. Proceedings of the National Academy of Sciences of the United States of America. 1994;91:3215–3219. doi: 10.1073/pnas.91.8.3215. [DOI] [PMC free article] [PubMed] [Google Scholar]
- 38.Krasnow AM, Ford MC, Valdivia LE, Wilson SW, Attwell D. Regulation of developing myelin sheath elongation by oligodendrocyte calcium transients in vivo. Nat Neurosci. 2017;93:1–28. doi: 10.1038/s41593-017-0031-y. [DOI] [PMC free article] [PubMed] [Google Scholar]
- 39.Yu X, et al. Reducing Astrocyte Calcium Signaling In Vivo Alters Striatal Microcircuits and Causes Repetitive Behavior. Neuron. 2018;99:1–28. doi: 10.1016/j.neuron.2018.08.015. [DOI] [PMC free article] [PubMed] [Google Scholar]
- 40.Dimou L, Simons M. Diversity of oligodendrocytes and their progenitors. Current Opinion in Neurobiology. 2017;47:73–79. doi: 10.1016/j.conb.2017.09.015. [DOI] [PubMed] [Google Scholar]
- 41.Simons M, Lyons DA. Axonal selection and myelin sheath generation in the central nervous system. Current Opin. Cell Biol. 2013;25:512–519. doi: 10.1016/j.ceb.2013.04.007. [DOI] [PubMed] [Google Scholar]
- 42.Tsai E, Casaccia P. Mechano-modulation of nuclear events regulating oligodendrocyte progenitor gene expression. Glia. 2019;67:1229–1239. doi: 10.1002/glia.23595. [DOI] [PMC free article] [PubMed] [Google Scholar]
- 43.Zhu X, et al. Age-dependent fate and lineage restriction of single NG2 cells. Development. 2011;138:745–753. doi: 10.1242/dev.047951. [DOI] [PMC free article] [PubMed] [Google Scholar]
- 44.Hill RA, Patel KD, Goncalves CM, Grutzendler J, Nishiyama A. Modulation of oligodendrocyte generation during a critical temporal window after NG2 cell division. Nat Neurosci. 2014;17:1518–1527. doi: 10.1038/nn.3815. [DOI] [PMC free article] [PubMed] [Google Scholar]
- 45.Bergles DE, Jabs R, Steinhäuser C. Neuron-glia synapses in the brain. Brain research reviews. 2010;63:130–137. doi: 10.1016/j.brainresrev.2009.12.003. [DOI] [PMC free article] [PubMed] [Google Scholar]
- 46.Kukley M, Nishiyama A, Dietrich D. The fate of synaptic input to NG2 glial cells: neurons specifically downregulate transmitter release onto differentiating oligodendroglial cells. Journal of Neuroscience. 30:8320–8331. doi: 10.1523/JNEUROSCI.0854-10.2010. [DOI] [PMC free article] [PubMed] [Google Scholar]
- 47.Wake H, et al. Nonsynaptic junctions on myelinating glia promote preferential myelination of electrically active axons. Nat Commun. 2015;6:7844. doi: 10.1038/ncomms8844. [DOI] [PMC free article] [PubMed] [Google Scholar]
- 48.Karttunen MJ, Czopka T, Goedhart M, Early JJ, Lyons DA. Regeneration of myelin sheaths of normal length and thickness in the zebrafish CNS correlates with growth of axons in caliber. PLoS ONE. 2017;12:e0178058. doi: 10.1371/journal.pone.0178058. [DOI] [PMC free article] [PubMed] [Google Scholar]
- 49.Almeida RG, Czopka T, Ffrench-Constant C, Lyons DA. Individual axons regulate the myelinating potential of single oligodendrocytes in vivo. Development. 2011;138:4443–4450. doi: 10.1242/dev.071001. [DOI] [PMC free article] [PubMed] [Google Scholar]
- 50.Freeman J, et al. Mapping brain activity at scale with cluster computing. Nat Meth. 2014;11:941–950. doi: 10.1038/nmeth.3041. [DOI] [PubMed] [Google Scholar]
- 51.Chen T-W, et al. Ultrasensitive fluorescent proteins for imaging neuronal activity. Nature. 2013;499:295–300. doi: 10.1038/nature12354. [DOI] [PMC free article] [PubMed] [Google Scholar]
- 52.Meyer MP, Smith SJ. Evidence from in vivo imaging that synaptogenesis guides the growth and branching of axonal arbors by two distinct mechanisms. Journal of Neuroscience. 2006;26:3604–3614. doi: 10.1523/JNEUROSCI.0223-06.2006. [DOI] [PMC free article] [PubMed] [Google Scholar]
- 53.Bindels DS, et al. mScarlet: a bright monomeric red fluorescent protein for cellular imaging. Nat Meth. 2017;14:53–56. doi: 10.1038/nmeth.4074. [DOI] [PubMed] [Google Scholar]
- 54.Almeida RG, Lyons DA. Intersectional Gene Expression in Zebrafish Using the Split KalTA4 System. Zebrafish. 2015;12:377–386. doi: 10.1089/zeb.2015.1086. [DOI] [PMC free article] [PubMed] [Google Scholar]
- 55.Kwan KM, et al. The Tol2kit: a multisite gateway-based construction kit for Tol2 transposon transgenesis constructs. Dev Dyn. 2007;236:3088–3099. doi: 10.1002/dvdy.21343. [DOI] [PubMed] [Google Scholar]
- 56.Walton EM, Cronan MR, Beerman RW, Tobin DM. The Macrophage-Specific Promoter mfap4 Allows Live, Long-Term Analysis of Macrophage Behavior during Mycobacterial Infection in Zebrafish. PLoS ONE. 2015;10:e0138949. doi: 10.1371/journal.pone.0138949. [DOI] [PMC free article] [PubMed] [Google Scholar]
- 57.Mensch S, et al. Synaptic vesicle release regulates myelin sheath number of individual oligodendrocytes in vivo. Nat Neurosci. 2015;18:628–630. doi: 10.1038/nn.3991. [DOI] [PMC free article] [PubMed] [Google Scholar]
- 58.Czopka T, Ffrench-Constant C, Lyons DA. Individual oligodendrocytes have only a few hours in which to generate new myelin sheaths in vivo. Developmental Cell. 2013;25:599–609. doi: 10.1016/j.devcel.2013.05.013. [DOI] [PMC free article] [PubMed] [Google Scholar]
- 59.Martin M. Cutadapt Removes Adapter Sequences From High-Throughput Sequencing Reads. EMBnet journal. 2011;17:3. [Google Scholar]
- 60.Dobin A, et al. STAR: ultrafast universal RNA-seq aligner. Bioinformatics. 2013;29:15–21. doi: 10.1093/bioinformatics/bts635. [DOI] [PMC free article] [PubMed] [Google Scholar]
- 61.Patro R, Duggal G, Love MI, Irizarry RA, Kingsford C. Salmon provides fast and bias-aware quantification of transcript expression. Nat Meth. 2017;14:417–419. doi: 10.1038/nmeth.4197. [DOI] [PMC free article] [PubMed] [Google Scholar]
- 62.Butler A, Hoffman P, Smibert P, Papalexi E, Satija R. Integrating single-cell transcriptomic data across different conditions, technologies, and species. Nature biotechnology. 2018;36:411–420. doi: 10.1038/nbt.4096. [DOI] [PMC free article] [PubMed] [Google Scholar]
- 63.Bindea G, et al. ClueGO: a Cytoscape plug-in to decipher functionally grouped gene ontology and pathway annotation networks. Bioinformatics. 2009;25:1091–1093. doi: 10.1093/bioinformatics/btp101. [DOI] [PMC free article] [PubMed] [Google Scholar]
- 64.Fiji: an open-source platform for biological-image analysis. Nat Meth. 2012;9:676–682. doi: 10.1038/nmeth.2019. [DOI] [PMC free article] [PubMed] [Google Scholar]
- 65.Meijering E, et al. Design and validation of a tool for neurite tracing and analysis in fluorescence microscopy images. Cytometry A. 2004;58:167–176. doi: 10.1002/cyto.a.20022. [DOI] [PubMed] [Google Scholar]
- 66.Hines JH, Ravanelli AM, Schwindt R, Scott EK, Appel B. Neuronal activity biases axon selection for myelination in vivo. Nat Neurosci. 2015;18:683–689. doi: 10.1038/nn.3992. [DOI] [PMC free article] [PubMed] [Google Scholar]
- 67.Kirby BB, et al. In vivo time-lapse imaging shows dynamic oligodendrocyte progenitor behavior during zebrafish development. Nat Neurosci. 2006;9:1506–1511. doi: 10.1038/nn1803. [DOI] [PubMed] [Google Scholar]
- 68.Baraban M, Koudelka S, Lyons DA. Ca 2+ activity signatures of myelin sheath formation and growth in vivo. Nat Neurosci. 2017;19:1–23. doi: 10.1038/s41593-017-0040-x. [DOI] [PMC free article] [PubMed] [Google Scholar]
Associated Data
This section collects any data citations, data availability statements, or supplementary materials included in this article.


