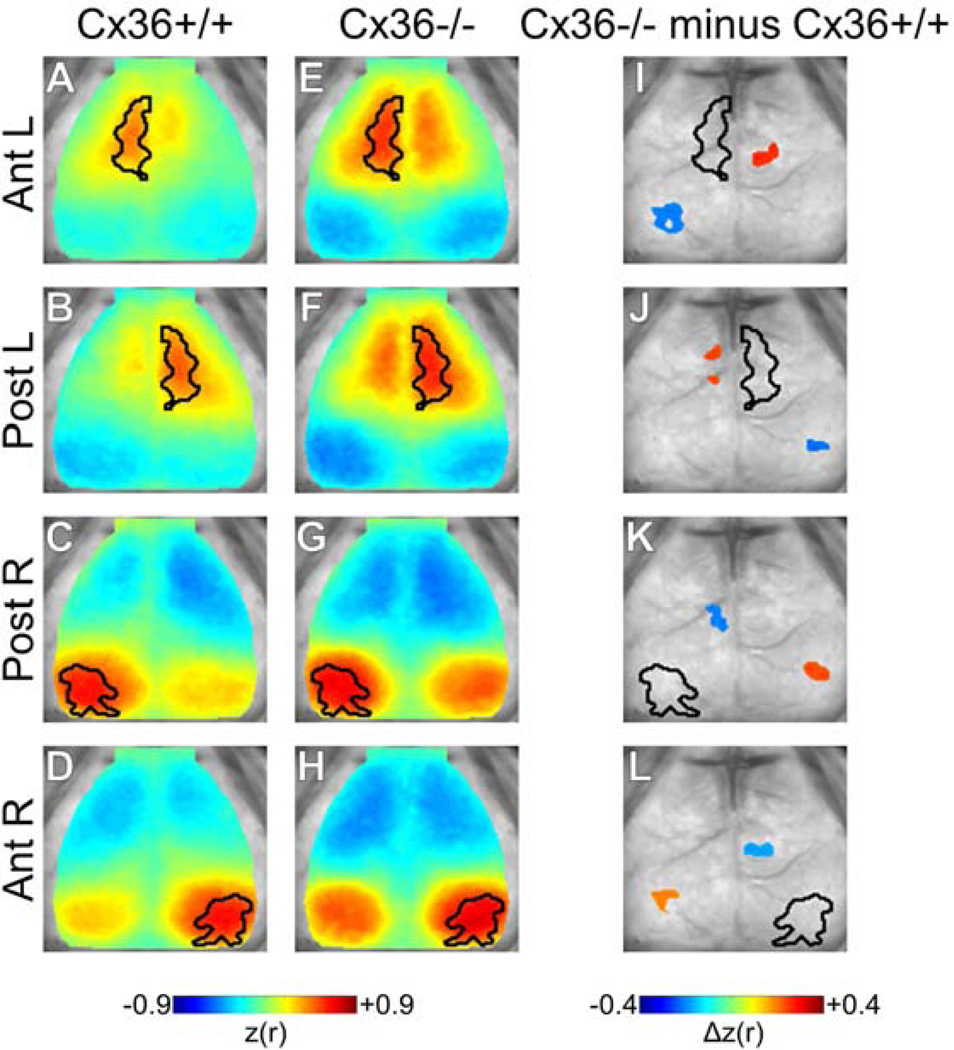
Figure 3.
Spatial distribution of correlation changes with Cx36 deletion. Seeded correlation maps for (A–D) Cx36+/+ and (E–H) Cx36−/− mice. Seeded regions are outlined in black. Enhanced homotopic correlation and intra-hemispheric anti-correlation were qualitatively apparent in Cx36−/− mice. (I–L) Statistically masked correlation difference maps (Cx36−/− minus Cx36+/+) for each ROI. Significance was determined using spatial cluster-wise threshold-extent criteria (see methods). (I,J) For Ant. ROIs, Cx36−/− mice demonstrated increased homotopic correlation and increased Ant.-Post. ROI anti-correlation for each hemisphere. Note that the increased local correlation seen qualitatively in E vs. A and F vs. B was not statistically significant. (K,L) Post. ROIs showed regionally selective increases in intra-hemispheric anti-correlation and increased inter-hemispheric correlation. The interhemispheric correlation increases were centered outside of the homotopic Post. ROI. Cx36+/+ n=16, Cx36−/− n=10.

