

Summary
Undernourished children in low-income countries often exhibit poor responses to oral vaccination. Perturbed microbiota development is linked to undernutrition but whether and how microbiota changes affect vaccine responsiveness remain unclear. Here, we show that gnotobiotic mice colonized with microbiota from undernourished Bangladeshi children and fed a Bangladeshi diet exhibited microbiota-dependent differences in mucosal IgA responses to oral vaccination with cholera toxin (CT). Supplementation with a nutrient-rich diet consisting of spirulina, amaranth, flaxseed and micronutrients augmented CT-IgA production. Mice initially colonized with a microbiota associated with poor CT responses exhibited improved immunogenicity upon invasion of bacterial taxa from cagemates colonized with a more ‘responsive’ microbiota. Additionally, a consortium of five cultured bacterial invaders conferred augmented CT-IgA responses in mice fed the supplemented diet and colonized with the ‘hypo-responsive’ community. These results provide preclinical proof-of-concept that diet and microbiota influence mucosal immune responses to CT vaccination and identify a candidate synbiotic formulation.
Graphical Abstract

eTOC
Di Luccia et al. find that gnotobiotic mice harboring microbiota from undernourished Bangladeshi children exhibit variable responsiveness to oral cholera-toxin (CT) vaccination. A nutraceutical improves CT immunogenicity, as does co-housing mice with Responsive and Hypo-Responsive microbiota. The nutraceutical plus five cultured bacterial strains increases CT responsiveness, revealing a candidate synbiotic.
Introduction
Childhood undernutrition is a major global health challenge, contributing to 45% of all deaths of those under the age of five years. Oral vaccines administered to infants and children in low income countries where undernutrition is prevalent are less effective than in children living in high income countries (Parker et al., 2018a). The causes of this vaccine underperformance are incompletely understood and thought to be multifactorial, including for example, the presence of maternal antibodies directed against vaccine targeted epitopes (IgG delivered trans-placentally prior to birth, or IgA in breastmilk; Appaiahgari et al., 2014; Chan et al., 2011), interference by human milk oligosaccharides (Morrow et al., 2005), and gut mucosal barrier disruption (Marie et al., 2018). Moreover, observational studies of rotavirus vaccination in children in Ghana (Harris et al., 2017), Pakistan (Harris et al., 2018) and India (Parker et al, 2018b) have revealed associations between particular features of the gut microbiota and vaccine responsiveness, although these features were not consistent across study sites.
The first 2–3 years of postnatal life represent a critical window for assembly of the gut microbiota (Subramanian et al., 2014; Raman et al., 2019). This microbial ‘organ’ is a key contributor to development of local mucosal immunity and shaping responses to oral vaccines (reviewed in Valdezi et al., 2014). Children with acute malnutrition have impaired development of their gut microbiota, yielding communities that appear younger (more immature) than those of chronologically aged-matched healthy children living in the same locale (Subramanian et al., 2014, Raman et al, 2019). In a preclinical test of causality, transplantation of microbial communities from undernourished children into gnotobiotic mice fed nutrient-poor diets representative of those consumed by the human donor population results in growth faltering, manifested by reduced lean body mass gain, impaired bone development, changes in metabolism and perturbed gut mucosal barrier function (Blanton et al., 2016; Kau et al., 2015). This raises the question of whether microbiota-directed therapeutics might also be able to improve responses to oral vaccines in these undernourished populations.
The global burden of cholera is estimated to be up to 4 million cases annually (Ali et al., 2015). In V. cholerae infection, the B subunit of cholera toxin (CTB), which is associated with the disease-causing CTA subunit, is responsible for monosialotetrahexosylganglioside (GM1)-mediated docking and entry of the cholera toxin complex into intestinal epithelial cells (Saslowsky et al., 2013). CTB binding to GM1 on B cells upregulates MHC class II expression and increases antigen presentation of CTB (Stratmann, 2015). Oral cholera vaccine administration induces the expression of vaccine-specific IgA in the gastrointestinal tract and tissue-specific homing of B and T cells (van Splunter et al., 2018). Current WHO-approved oral cholera vaccines contain killed V. cholera alone (serotypes O1 and O139) or killed V. cholera (O1) together with recombinant CTB. Despite the projected overall effectiveness of mass cholera vaccination campaigns due to the herd effect (Khan et al., 2018), 5-year data from a large randomized, placebo-controlled study of the bivalent vaccine in India have reported efficacy (direct protection) rates of only 42% in 1 to 4-year-old children (Bhattacharya et al., 2013).
In this study, we use gnotobiotic mice, colonized with gut (fecal) microbiota from Bangladeshi children with a history of severe acute malnutrition (SAM), to characterize a combined prebiotic and probiotic (synbiotic) intervention that improves mucosal immune IgA responses to orally-administered CT. Microbiota were from a previously characterized cohort of stunted Bangladeshi children with SAM [weight-for-height Z scores more than 3 standard deviations below age-matched healthy individuals in a reference multi-country World Health Organization cohort; (Gehrig et al., 2019)]. These children had been enrolled in a hospital-based, ‘non-inferiority’ study that compared the efficacy of several locally-produced therapeutic foods; these foods were not designed to repair microbiota immaturity. The children were treated until they attained weight-for-height Z-scores (WHZ) of >−2, then discharged and followed for a period of 12 months. During this follow-up period, many relapsed to moderate acute malnutrition (MAM); this ‘post-SAM MAM’ state was associated with persistent immaturity of their gut microbial communities (Gehrig et al. 2019; Raman et al., 2019) and persistent stunting. Aptamer-based analyses of the levels of 1305 proteins in these childrens’ plasma also revealed persistent abnormalities affecting a number of physiologic, metabolic, immunologic and neurodevelopmental processes (Gehrig et al., 2019).
The prebiotic component of the synbiotic intervention we describe was a formulation comprised of (i) spirulina, which is derived from the filamentous cyanobacterium Arthrospira platensis and has reported prebiotic, antioxidant and immunomodulatory effects (Neyrink et al., 2017; Finamore et al., 2017; Chu et al., 2016), (ii) amaranth grain, a pseudo-cereal consumed in many societies over the course of millennia, rich in a variety of antioxidants, vitamins and essential amino acids (Gorinstein et al., 2007; Nimbalkar et al. 2012) and associated with a variety of reported health benefits (Huerta-Ocampo and de la Rosa, 2011), (iii) flaxseed, a rich source of fiber and ω−3 fatty acids, that has been shown in preclinical models to alter gut microbial ecology and modulate enteroendocrine gene expression (Arora et al,., 2019) and (iv) a set of micronutrients with immunomodulatory properties (reviewed in Maggini et al., 2018). The probiotic component of the synbiotic consisted of a consortium of five bacterial strains; these strains were identified from studies involving co-housing gnotobiotic mice with post-SAM MAM donor microbiota that conveyed discordant responses to oral CT vaccination and tracking how invasion of taxa from one community to another could enhance vaccine responses. These preclinical studies illustrate an approach for identifying pre- and probiotics that could be used as adjuvants for oral vaccines in undernourished children.
Results
Gut mucosal IgA responses to cholera toxin in mice colonized with microbiota from Bangladeshi children with post-SAM MAM
We selected four fecal samples that had been cryopreserved at −80 °C within 20 minutes of their collection from three members of the SAM trial: two were from a child obtained during and 6 months after completion of nutritional rehabilitation (samples PS.064.S04 and PS.064.S11 collected at 13 and 20 months of age) while the other two were collected from 18- and 19-month-old children five months after treatment (samples PS.046.S10 and PS.148.S10) (see Table S1a for additional clinical metadata). The compositions of these microbiota, their colonization of gnotobiotic mice and their responses to microbiota-directed food ingredients have been described previously (Gehrig et al., 2019), providing a rationale to extend our studies of their functional/modifiable properties here. Four groups of ~9-week-old male germ free C57BL/6J mice were fed a diet representative of that consumed by the microbiota donor population (Mirpur-18 diet, abbreviated M18; Gehrig et al., 2019) for 3 days. Members of each group were then colonized by oral gavage with one of the microbial communities (n=10 animals per group/experiment; Figure 1A). Seven days after colonization, five mice in each group were maintained on the M18 diet, while the other five animals were switched to a supplemented version of the M18 diet that contained 5% (w/w) spirulina, 10% ground amaranth grain, 2.5% ground flaxseed, plus multiple micronutrients. Mice were monotonously fed these diets ad libitum. Five days after the switch to the supplemented diet, each of the animals in each of the 8 groups were immunized by oral gavage with CT. Oral immunization was repeated 7 and 14 days after the first round, for a total of 3 doses (Figure 1A). Mice were euthanized 7 days after the final vaccination (experimental day 36). This experiment was performed three times for post-SAM MAM microbiota sample PS.148.S10, twice for PS.064.S04, and once each for PS.064.S11 and PS.046.S10.
Figure 1 -. Effects of R and HypoR donor microbiota and diet supplementation on responses to oral vaccination with CT in gnotobiotic mice.

(A) Experimental design. Four groups of 8-week-old germ-free mice (n=5 mice/group) were placed on the Mirpur-18 (M18) diet. Three days later, two groups each were colonized by oral gavage with either the PS.148.S10 (R) or PS.064.S04 (HypoR) microbiota. On day 10, one group of five mice harboring each microbiota was switched to the M18 diet supplemented with a mixture of spirulina, amaranth grain, flaxseed and micronutrients for the duration of the experiment. Oral immunization with CT was performed at days 15, 22, and 29. (B,C) Scatterplots showing the effects of microbiota and dietary supplementation on the CT-IgA to total IgA ratio in feces (panel B), and the percentage of CD38loGL7+ cells among CD19+TCRb− cells in mesenteric lymph nodes (panel C). Data from two independent experiments with both the R and HypoR microbiota are shown, with circles and triangles representing the different experiments. Significance bars reflect the results of pairwise comparisons of estimated marginal means with P-values corrected by Holm’s method. *, P<0.05. Means and bootstrapped 95% confidence intervals are presented. (D) Heatmap showing the percent relative abundances of ASVs in mice at 9, 15, 27, and 36 days post gavage. The column labeled “Assigned microbiota” on the left of the heatmap identifies ASVs that had statistically significant associations with either the R or HypoR microbiota as determined by indicator species analysis (ISA). The strength of association, measured by indicator species values for each ASV with its associated microbiota, is presented in the left-hand column labeled “IndVal.” Columns are arranged by hierarchical clustering, depicted by the dendrogram at the top of the figure. Colored rows across the top of the heatmap indicate the day of sampling and diet. ASVs are ordered by descending indicator species values within each microbiota-associated group. The heatmap includes all ASVs that occurred in at least 25% of the samples from one group of colonized mice and had a mean relative abundance of at least 1% when present. See also Figures S1A,B and Table S1a–c, and Table S2a,b.
The composition of the supplemented diet was such that it provided 200 mg spirulina/mouse/day and 75% of the RDA of a number of vitamins and minerals for a 12-month-old child. Table S1b describes the formulations of the unsupplemented and supplemented M18 diets, their nutritional analysis after irradiation and the results of gas chromatography-mass spectrometric (GC-MS) analysis of cecal contents harvested from control germ-free mice monotonously fed the two diets for 15 days. The latter measurements provided a view of the availability of these diet-derived components in the absence of microbial consumption and demonstrated statistically significant increases in cecal levels of multiple essential and non-essential amino acids as well as mono- and disaccharides in mice consuming the supplemented diet.
The ratio of CT-specific IgA to fecal total IgA (hereafter referred to as CT-IgA ratio) in mice fed the supplemented M18 diet was higher than in mice fed unsupplemented M18 (linear mixed effects model). Among the four different post-SAM MAM microbiota tested, this difference only reached statistical significance in PS.148.S10-colonized mice (linear mixed-effects model followed by linear contrasts, P<0.05; Figure 1B and Table S1c; note that total IgA levels in feces did not differ between treatment groups, either before or after vaccination). Mice colonized with this donor microbiota and fed supplemented M18 also had higher levels of germinal center B-cells (CD38loGL7+) in mesenteric lymph nodes (MLN) relative to their unsupplemented M18-fed counterparts (Figure 1C, Table S1c). In mice fed supplemented M18, the CT-IgA ratio and the percentage of CD38loGL7+ cells were higher in animals colonized with PS.148.S10 than in those colonized with PS.064.S04 (P=0.092 for CT-IgA ratio, P=0.011 for CD38loGL7+ cells) (Figure 1B,C; Table S1c). There were no statistically significant effects on the representation of activated CD4+ T cells (CD44hiCD62Llo), Foxp3+ regulatory T cells (Tregs) or on levels of serum CT-specific IgG in PS.148.S10- and PS.064.S04-colonized mice (after post-hoc tests; Table S1c). A similarly designed experiment involving germ-free mice showed no significant differences in the CT-IgA ratio or total IgA in feces between animals fed the M18 or supplemented M18 diets (n=5 mice/group) [CT-IgA ratio; 9.2 ± 2.4 (mean ± SEM) (M18) versus 9.2 ± 3.4 (supplemented M18); total IgA, 1.3 ± 0.4 (M18) versus 3.2 ± 0.9 (supplemented M18); P=0.989, P=0.092, respectively (ANOVA)]. Together, these data indicate that immune responses to cholera toxin are influenced by both community composition and dietary context. Based on these observations, the PS.148.S10 and PS.064.S04 microbiota were designated supplement-responsive (R) and supplement hypo-responsive (HypoR), respectively.
Using fecal samples obtained on experimental days 9, 15, 27 and 36 from animals fed the two diets, we performed indicator species analysis (ISA; Dufrêne and Legendre, 1997) to identify bacterial taxa (amplicon sequence variants; ASVs) whose frequencies of detection and relative abundances differed between the R and HypoR communities (see Table S2a for a complete list of all ASVs detected). ISA assigns a strength of association (indicator species value) to each ASV in each community type (R or HypoR), calculated as the product of an ASV’s frequency of detection, and mean relative abundance in a given community type, normalized to the sum of its mean abundances in both communities. This value ranges from zero, indicating that an ASV is never detected in a group, to 100%, indicating that it is always and only detected in a single group. Statistical significance was determined by permutation. ISA identified 30 ASVs that were significantly associated with R microbiota-colonized mice and 27 ASVs associated with mice that received the HypoR community. Among the taxa exclusively found in the transplanted R community were several members of Bacteroidales (Bacteroides fragilis, Bacteroides acidifaciens, Parabacteroides distasonis), three ASVs assigned to Fusobacterium mortiferum, and another ASV assigned to Clostridium innocuum. Streptococcus lutetiensis, Enterococcus and two members of the genus Clostridium were among those ASVs restricted to mice harboring the HypoR microbiota (Figure 1D, Table S2b).
We applied permutational multivariate analysis of variance to V4–16S rDNA datasets across the two experiments with both the R and HypoR communities. Diet explained 5.3% and 28.9% of the variance (Bray-Curtis dissimilarities) between R and HypoR communities sampled at the end of the experiments, respectively (P=0.033 and P=0.0002). For the HypoR community, diet divided the samples along the first axis in a principal coordinates analysis (Figure S1A). This axis was correlated with the relative abundances of 17 ASVs, 14 of which were significant indicator ASVs. The 13 HypoR-associated ASVs all had mean relative abundances that were either higher in HypoR-compared to R-colonized mice in both diet contexts, or were never detected in the R microbiota. The effect of supplementation on the bacterial composition of the HypoR community was largely attributable to increases in the relative abundance of ASV6 (S. lutetiensis; 18.2% versus 7.2% on M18) and to decreases in the relative abundances of ASV3 (R. gnavus; 17.8% versus 22.4%), ASV4 (Bifidobacterium; 11.3% versus 14.9%), and ASV7 (Erysipelatoclostridium ramosum; 6.6% versus 9.6%).
To examine whether M18 supplementation influenced the bacterial taxa that were targeted by gut mucosal IgAs, we performed BugFACS on fecal samples collected on experimental day 36 from R community-colonized mice. This method uses fluorescence-activated cell sorting to separate bacterial cells based on whether they are bound by host IgA (IgA+) or not (IgA−) (Kau et al. 2015). Targeting of bacteria by IgA was similar in mice fed the two diets, with enrichment in the IgA+ fraction most significant for Bacteroides uniformis (ASV2) and Ruminococcus gnavus (ASVs 3 and 28); (Figure S1B).
B. acidifaciens (ASV1), P. distasonis (ASVs 9 and 13), Clostridium innocuum (ASV11), and Lachnospiraceae (ASV 24) were highly enriched in the IgA-fraction on both diets. PERMANOVA of Bray-Curtis dissimilarities showed that the different fractions (IgA+ vs. IgA−) explained 45.2% of the total variance (P<0.001), while the diets and their interaction with the IgA+ and IgA− fractions were not significant (P>0.05) and collectively explained only 3.9% of the variation. Together, these results led us to conclude that the observed enhancement of CT-IgA response was not accompanied by detectable alterations in mucosal IgA targeting of bacterial members of the transplanted R community.
Invasion of the HypoR microbiota by members of the R community is associated with increased IgA response to oral vaccination with CT
We performed a co-housing study that leverages the coprophagy of mice to test the hypothesis that specific microbial taxa present in the R microbiota could invade and establish themselves in the transplanted HypoR community, leading to acquisition of a supplement-enhanced IgA response to oral CT vaccination. The experimental design is illustrated in Figure 2A. Forty-eight 8-week-old, germ-free, male C57BL/6J mice consuming the unsupplemented M18 diet were colonized with either the R or HypoR communities (n=24 animals/microbiota). One week after colonization, 12 mice with each gut microbiota were switched to monotonous feeding with supplemented M18, while the other 12 mice from each group were maintained on unsupplemented M18. Four days later, half of each group were placed in a new isolator, where they were co-housed in pairs with a cagemate harboring either the same microbiota or the microbiota of the other donor, but maintained on the same diet. This resulted in four groups of mice with different microbial exposures: R-colonized mice cohoused with R-colonized mice (abbreviated RCh-R), R-colonized mice cohoused with HypoR-colonized mice (RCh-HypoR), HypoR-colonized mice cohoused with HypoR-colonized mice (HypoRCh-HypoR), and HypoR-colonized mice cohoused with R-colonized mice (HypoRCh-R). Mice then received three oral CT vaccinations at weekly intervals beginning five days after co-housing.
Figure 2 -. Effects of co-housing mice initially colonized with the R or HypoR microbiota.

(A) Experimental design. Four groups of 12 mice were dually-caged and fed the M18 diet. On day 3, two groups were colonized with the HypoR microbiota and two with the R microbiota. On day 10, one group harboring each microbiota was switched to the supplemented M18 diet (green), while the other group was maintained on the M18 diet (brown). On day 14, half the mice from each group were moved to a new, empty isolator, where they were each co-housed with a mouse harboring the other microbiota. (B) Mice fed the supplemented M18 diet exhibited increased CT-IgA ratios in their feces, and increased percentages of CD38loGL7+ cells among CD19+TCR-b− cells relative to mice fed the M18 diet. (C) Heatmap showing the mean percent abundances of ASVs at 10, 13, 17, 28, and 40 days post gavage in mice exposed to only the R microbiota, only the HypoR microbiota, or (through co-housing) the HypoR microbiota followed by the R microbiota (HypoRCh-R), or the R microbiota followed by HypoR microbiota (RCh-HypoR) in both the unsupplemented and supplemented M18 diet contexts. The column “Assigned microbiota” identifies ASVs previously demonstrated to be significantly associated with either the R or HypoR microbiota by indicator species analysis (see Figure 1D). The “Invade HypoR” and “Invade R” columns identify ASVs defined as invaders in the R→HypoR and HypoR→R directions, respectively. Only ASVs with a mean relative abundance of at least 1% in one mouse group on any day are included in the heatmap. Mice exposed to the R microbiota exhibited higher cecal concentrations of propionate (D), butyrate (E), and succinate (F) than mice only exposed to HypoR microbiota. This difference is not significant on the M18 diet for butyrate and succinate. Means and bootstrapped 95% confidence intervals are presented. *, P<0.05, **, P<0.01, ***, P<0.001. See also Figure S1C and Figure S2, and Table S1c, Table S2a,c, and Table S3.
Consistent with our earlier results, (i) mean fecal CT-IgA ratios were increased in mice colonized with the R microbiota relative to those harboring the HypoR community (linear model, linear contrasts of marginal means, P<0.001) and (ii) consuming supplemented M18 increased the CT-IgA ratio relative to M18 alone (linear model, P=0.005; Figure 2B, Table S1c). Moreover, HypoRCh-HypoR mice consuming the supplemented M18 diet had lower fecal CT-IgA ratios when compared to mice that were first exposed to the R community (RCh-R; RCh-HypoR) or later exposed to it (HypoRCh-R) (Table S1c). The percentages of activated CD4+ T cells (CD44hiCD62Llo), indicative of immune activation, and Tregs (Foxp3+) which are mediators of oral tolerance in MLN, did not differ between any of the eight treatment groups (Table S1c). Together, these findings led us to conclude that mucosal IgA responses to CT following oral vaccination can be enhanced by supplementation of the M18 diet and by the presence of specific members of the R community.
The frequency of germinal center CD38loGL7+ B cells in MLN was significantly higher in RCh-R, HypoRCh-R and RCh-HypoR mice compared to HypoRCh-HypoR controls while animals consumed the unsupplemented M18 diet. The HypoR group also manifested increases in these cells from diet supplementation alone without exposure to R community members (Figure 2B). Consistent with these findings, the percentage of MLN CD38hiIgD+ cells, which cannot produce IgA, exhibited the opposite pattern to that observed for MLN CD38loGL7+ cells (Table S1c). We concluded that under these experimental conditions, members of the R microbiota had a larger effect size on the germinal center memory B cell response than did the supplement.
We next generated V4–16S rDNA datasets from fecal samples collected from mice in all groups at various time points to determine the effects of co-housing on community composition. Invasion of an ASV in the R→HypoR direction was defined as follows: (i) the ASV increased from a relative abundance <0.1% before co-housing to a relative abundance ≥0.1% after co-housing in at least 75% of the HypoRCh-R mice; (ii) the ASV had a relative abundance ≥0.1% in at least one sample obtained from 75% of the mice in both the RCh-R and RCh-HypoR groups after co-housing, and (iii) the ASV was not detected at a relative abundance ≥0.1% in more than one HypoRCh-HypoR mouse after co-housing. For ASVs invading in the HypoR→R direction, the rules were modified to reflect gain by RCh-HypoR mice, and persistence in HypoRCh-HypoR and HypoRCh-R animals, and absence from RCh-R mice. Applying these criteria in each diet context independently (ASVs were considered as successful invaders if they met the criteria in either diet context), 23 ASVs invaded in the R→HypoR direction, including ASVs assigned to B. acidifaciens, B. uniformis, B. fragilis, Clostridium innocuum, Fusobacterium mortiferum, and Clostridioides difficile (Figure 2C, Figure S1C, Table S2c). Conversely, four ASVs invaded in the HypoR→R direction; these were assigned to S. lutetiensis, Campylobacter, C. butyricum, and Sutterella. Together, these findings suggest that the R microbiota contains strains able to augment the gut mucosal CT-IgA response in the context of the supplemented diet. Moreover, this enhanced immunogenicity can be transmitted to mice harboring a HypoR microbial community after invasion of their microbiota by taxa from R mice.
Acetate, propionate and butyrate are major products of colonic bacterial fermentation of dietary fibers that signal through G protein-coupled receptors (GPR41, GPR43 and GPR109a). A recent study demonstrated that acetate and butyrate can promote B cell differentiation and boost IgA responses to oral CT vaccination (Yang et al., (2019). Therefore, we used GC-MS to quantify short-chain fatty acids in cecal samples collected from each mouse in each group at the end of the co-housing experiment. Butyrate, propionate, and succinate were all significantly higher in mice consuming the supplemented M18 diet that had been exposed to the R microbiota (either initially by gavage (RCh-R), or after co-housing (HypoRCh-R)) compared to the HypoRCh-HypoR animals that had not been exposed (Figure 2D–F). In contrast to microbial exposure, diet (unsupplemented versus supplemented) had no statistically significant effect on cecal levels of short chain fatty acids (Figure 2D–F; Table S3).
Invasion of the HypoR microbiota by five cultured members of the R community increases fecal CT-IgA ratios in prebiotic-supplemented gnotobiotic mice
To determine whether a subset of the successful invaders from the co-housing experiment were sufficient to increase responses to the oral CT vaccination in the context of M18 supplementation, we were able to capture five of the invaders in a culture collection generated from the R community: Bacteroides acidifaciens, Bacteroides fragilis, Clostridioides difficile, Clostridium innocuum and Fusobacterium mortiferum. Their genomes were sequenced and in silico metabolic reconstructions were performed (see Table S4a and Table S4b for the results of our analysis of their (i) biosynthetic and salvage pathways for amino acids and vitamins/cofactors, (ii) intracellular catabolic pathways and uptake transporters for various carbohydrates and complex polysaccharides, and (iii) central carbohydrate metabolism and fermentation pathways used for production of short-chain fatty acids). A search of the Clostridioides difficile 9C4 genome against the virulence factor database (VFDB; Liu et al., 2019) identified no virulence factors, including the two principal glucosylating exotoxins, TcdA and TcdB, that are primarily responsible for mediating the pathogenic effects of this organism.
Three groups of 8-week-old, germ-free, male C57BL/6J mice were colonized with the HypoR community and fed the M18 diet. Eleven days later, all mice were switched to monotonous feeding with the supplemented M18 diet. Two weeks after colonization, each group received the first of three weekly gavages with the intact R community (n=5), or the 5-member consortium of R-derived cultured strains (abbreviated 5memRCC; n=8). The control group received additional gavages with the intact HypoR community (n=5 mice). CT was orally administered to all mice 5 days after each gavage. Animals were euthanized on experimental day 44 (Figure 3A).
Figure 3 -. The effects of introducing a 5-member consortium of cultured bacterial strains from the R community into the HypoR community.
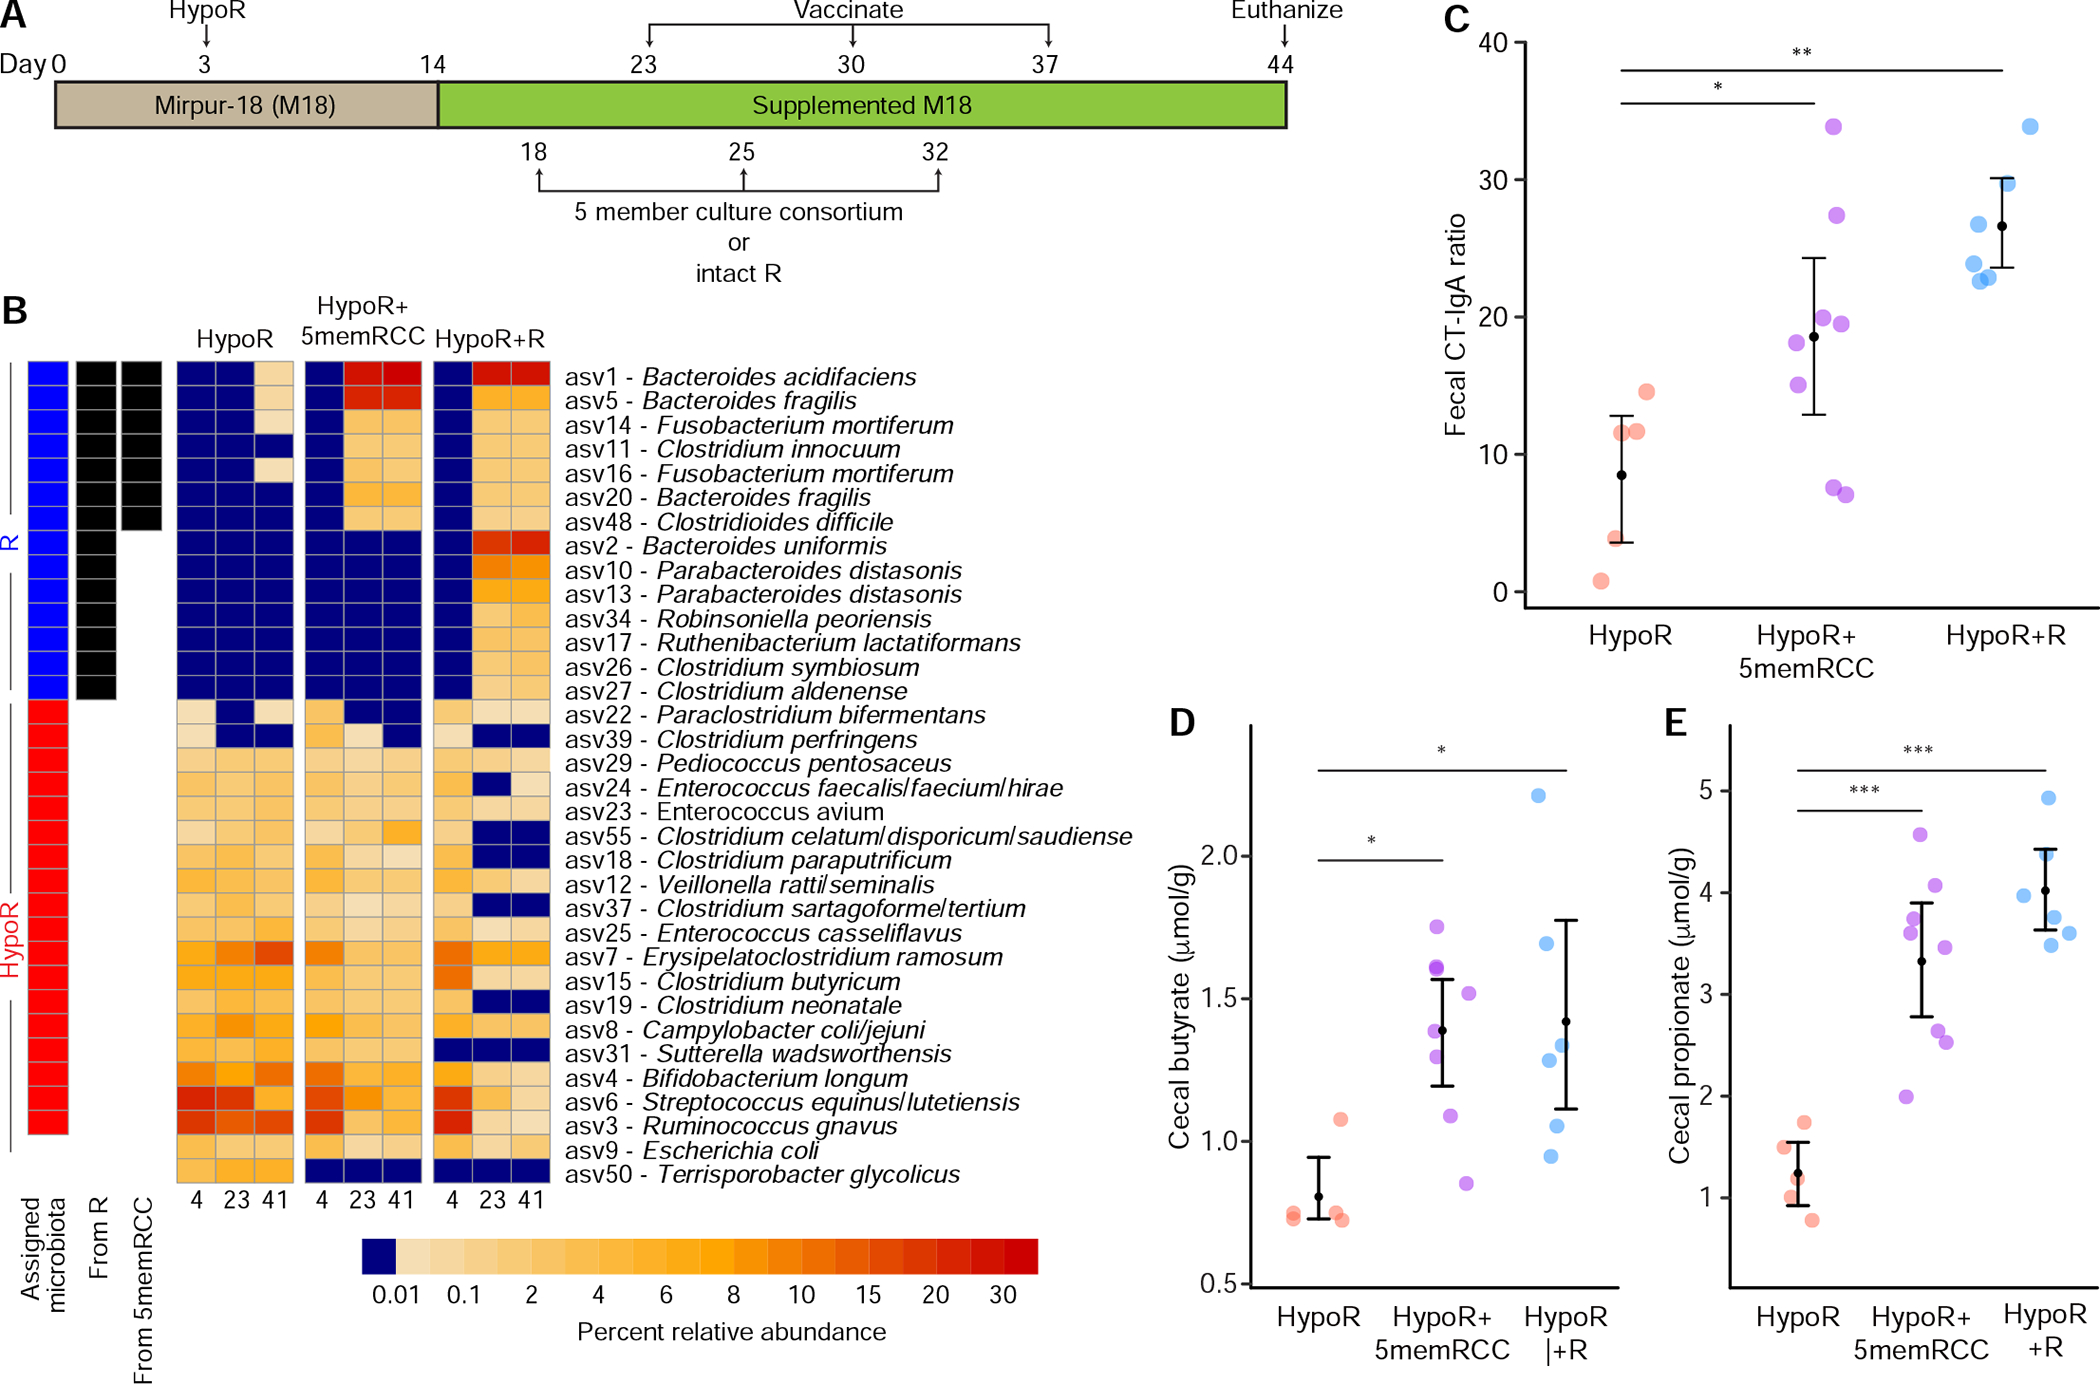
(A) Experimental design. Mice fed the M18 supplemented diet were first colonized with the HypoR community on day 3. Animals were gavaged with the 5memRCC or intact R community on days 18, 25 and 32. (B) Heatmap depicting invasion of the HypoR community by ASVs from the R community and the 5-member R-derived culture collection (5memRCC). The mean percent abundances of common ASVs at 4, 23, and 41 days post gavage in mice belonging to each of the treatment groups are shown. The “Assigned microbiota” column shows ASVs previously identified as indicators of either the R or HypoR community, and the “From 5memRCC” and “From R” columns show ASVs that successfully invaded the HypoR-colonized mice after gavage with the indicated communities. ASVs with a mean relative abundance of at least 1% in one treatment group on any day are included in the heatmap (14 of the 22 identified invaders). (C) Ratios of CT-specific IgA to total IgA in feces. (D,E) Mice exposed to the R or 5memRCC have higher concentrations of butyrate and propionate in their cecal contents than HypoR controls. Mean values and bootstrapped 95% confidence intervals are presented. The statistical significance of pairwise comparisons, corrected by Holm’s method, are shown *, P<0.05, **, P<0.01, ***, P<0.001. See also Figures S1C, S2 and Tables S1a, Table S2c, Table S3, and Table S4a,b.
In this study, an ASV was defined as a successful invader of HypoR-colonized mice if it satisfied two criteria: (i) the ASV increased from a relative abundance <0.1% before gavage to a relative abundance ≥0.1% after gavage in ≥1 sample from ≥75% of mice in either the HypoR+R or HypoR+5memRCC treatment groups, and (ii) the ASV was not detected at a relative abundance ≥0.1% in more than one HypoR mouse after receiving secondary gavages with the HypoR community. Based on these criteria, 22 ASVs (14 at >1% relative abundance) were identified as invading HypoR-colonized mice after gavage with the R community; all of the ASVs represented in the culture collection were invaders (Figure 3B; Table S2c), and all but one of the 22 (Robinsoniella peoriensis) had been identified previously as successful invaders in the co-housing experiment (Figure S1C).
Mice in the HypoR+R and HypoR+5memRCC groups exhibited significantly greater mean fecal CT IgA/total IgA ratios than HypoR controls [linear models followed by contrasts of marginal means, P=0.001, and P=0.025 respectively (Figure 3C; Table S1c); note that total IgA levels in feces did not differ between groups, either before or after vaccination]. These results demonstrate that five of the bacterial invaders from the R community when administered as a cultured ‘probiotic’ consortium were sufficient to increase the CT-IgA ratio. The CT-IgA ratios in the HypoR+5memRCC mice were negatively correlated with the relative abundances of three HypoR-associated bacterial ASVs; Streptococcus equinus/lutetiensis (ASV6, rho=−0.786, P=0.028), Bifidobacterium longum (ASV4, rho=0.762, P=0.037), and a member of the genus Veillonella (ASV12, rho=−0.738, P=0.045).
Responsive microbiota-associated metabolites correlate with enhanced CT specific-IgA responses
Levels of propionate and butyrate (but not acetate) were significantly higher in fecal samples collected at euthanasia in both the HypoR+R and HypoR+5memRCC treatment groups compared to HypoR controls, whereas succinate was higher only in HypoR+R mice (Figure 3D,E; Table S3D–F). These data suggest the 5-member consortium is able to confer similar but not identical changes in fermentative activity on the HypoR community as the full set of invaders from the intact R community. Propionate is produced by four alternative routes in bacteria; the succinate, acrylate, propanediol and dicarboxylic acid pathways. The succinate pathway for propionate fermentation is present in both Bacteroides members of the 5memRCC, while the acrylate pathway that uses lactate is evident in C. difficile. The butyrate fermentation pathway is present in C. innocuum, C. difficile and F. mortiferum (all have a common route for conversion of acetyl-CoA to butyryl-CoA, but distinct reactions for the last step of butyrate production; see Supplementary Results).
To further examine differences in the metabolic landscape of the guts of these mice, and to identify metabolites correlated with the CT-IgA ratio in the context of M18 supplementation, we performed Liquid Chromatography-Quadrupole Time-of-Flight Mass Spectrometry (LC-QTOF-MS) on their cecal contents. Principal components analysis revealed that the first component of variation separated the R microbiota from the HypoR+R and the HypoR+5memRCC groups and explained 32.0% of the overall variance (Figure S2A). This first axis was positively correlated with the CT-IgA ratio (Pearson’s r=0.67, P=0.002). The second component of variation (explaining 19%) separated the HypoR+5memRCC and HypoR+R communities and, most strongly, the HypoR microbiota. Of the 5,160 analytes (m/z) quantified, 346 had significant positive correlations with CT-IgA ratio (FDR-adjusted P<0.05). Among those with the strongest correlations (r≥0.66; n=95), levels of 53 were significantly higher in the cecal contents of both HypoR+R and HypoR+5memRCC animals than in those of HypoR controls, and undetectable in germ-free controls (P<0.05, FDR-corrected Kruskal-Wallis tests followed by pairwise Wilcoxon rank-sums tests corrected by Holm’s method; Figure S2B; Table S3G).
LC-QTOF-MS analysis of the cecal contents of mice in the co-housing study (Figure 2A) identified 39 supplement-responsive analytes with m/z and retention times matching compounds among the 346 that were correlated with CT-IgA/total IgA ratios in the direct gavage experiment; 17 of these were significantly higher in RCh-R, RCh-HypoR or HypoRCh-R mice fed the supplemented M18 diet, and not detected in their germ-free counterparts (Figure S2C, Table S3H). These analytes represent biomarkers of supplement-mediated vaccine response in this preclinical model; however, only one (tryptophyl-histidine), could be positively identified by MS. Efforts to determine the contributions of individual members of the 5memRCC consortium to the production of these metabolites based on in vitro culture experiments proved inconclusive (see Figure S2D and Table S3I). The latter finding highlights the need for additional studies in gnotobiotic mice that compare the efficacy and metabolic output of the full five-member R-derived consortium with that of systemically manipulated versions where smaller subsets, comprised of different combinations of members, are added to the HypoR community.
Discussion
Using a gnotobiotic mouse model of oral cholera toxin vaccination, in which mice were colonized with microbiota from stunted undernourished Bangladeshi children, we demonstrate that supplementation of a prototypical diet consumed by the donor population with Spirulina, amaranth, flaxseed and micronutrients increased the host CT-IgA response to mucosal immunization. Three observations indicated that the beneficial effects of supplementation on mucosal IgA responses to CT was microbiota-dependent. First, augmentation of the IgA response was not observed in germ-free animals. Second, co-housing studies identified components of a vaccine ‘responsive’ microbiota that were able to colonize mice harboring ‘hypo-responsive’ microbiota; this invasion resulted in elevated fecal CT-IgA levels and an increased frequency of memory B cells in mesenteric lymph nodes. Third, we cultured and sequenced the genomes of five of the invading bacterial strain (Bacteroides acidifaciens, Bacteroides fragilis, a non-toxigenic Clostridioides difficile, Clostridium innocuum, Fusobacterium mortiferum) and administered them as a consortium, together with the supplement to mice harboring a hyporesponsive microbiota. We found that this intervention was able to confer increased CT-IgA responses to recipient mice.
We have previously demonstrated the capacity for microbiota repair to rescue growth and metabolic abnormalities in gnotobiotic mice colonized with the gut microbial communities of stunted/underweight children (Blanton et al., 2016; Gehrig et al., 2019). The results described here provide preclinical evidence for the involvement of the gut microbiota of undernourished children in immune responses to oral vaccination, and highlight how a dietary supplement that boosts mucosal vaccine responses can be augmented by administration of a select consortium of microbes from the gut microbiota of supplement-responsive microbiota donors.
Since specific microbiota members and the prebiotic together maximize the response to oral CT vaccination, we hypothesize that this interaction is mediated, at least in part, by microbial metabolites arising from, or induced by ingredients in the prebiotic formulation. Recent studies have highlighted the ability of short chain fatty acids (SCFA) to promote host antibody responses (Kim et al., 2016; Yang et al., 2019), including the enhancement of IgA responses to CT (Yang et al., 2019). When we analyzed levels of SCFA in cecal contents recovered from mice in the co-housing experiments, and in the sequential community/consortium addition experiments, we found increased levels of propionate, butyrate and succinate (a precursor for propionate production) in R- and 5memRCC-colonized mice that accompanied the increased CT-IgA response. It is important to be circumspect about attributing a role to SCFAs in this model: non-targeted LC-QTOF-MS revealed additional metabolites that correlated with the augmented vaccine response observed in mice harboring the R microbiota, or members of its derivative 5memRCC. Further work is required to (i) characterize the contributions of these additional analytes to the immune response (a challenging task given that the majority were not observed when members of the consortium were grown ex vivo) and (ii) identify the bioactive components of the supplement and their effects, and those of the products of their microbial metabolism, on the observed responses to oral immunization with CT, and (iii) determine which components of the R community and of its derived 5-member defined consortium promote responsiveness to oral vaccination.
The generalizability of the effects of the supplement, with and without members of the defined consortium, needs to be tested preclinically by transplanting microbiota from additional Bangladeshi children with SAM, MAM and post-SAM MAM, as well as children representing other geographic locales and anthropologic features, into germ-free animals. The results would provide additional confidence in rationale for subsequent human studies designed to assess the translatability of these preclinical findings to children with undernutrition. A potential complementary approach for establishing proof-of-concept/efficacy would be to test the prebiotic and/or synbiotic formulation in adults over 65 years of age where current approaches to oral (cholera) vaccination are viewed as insufficiently effective to recommend their use.
STAR Methods
RESOURCE AVAILABILITY
Lead Contact
Further information and requests for resources and reagents should be directed to and will be fulfilled by the Lead Contact, Jeffrey I. Gordon (jgordon@wustl.edu)
Materials Availability
This study did not generate new unique reagents. Microbial communities were derived from human fecal samples obtained under a Materials Transfer Agreement with icddr,b Bangladesh.
Data and Code Availability
V4–16S rDNA sequences in raw format prior to post-processing and data analysis, and the genome sequences of the five cultured bacterial strains have been deposited at the European Nucleotide Archive (study accession number, PRJEB35845). The original datasets used in this study for immune phenotyping and metabolomic analysis are available on request from the corresponding author, Jeffrey I. Gordon (jgordon@wustl.edu).
EXPERIMENTAL MODEL AND SUBJECT DETAILS
Gnotobiotic mice
Protocols for experiments performed in gnotobiotic mice were approved by the Washington University Animal Studies Committee. Mice were housed in plastic, flexible film gnotobiotic isolators (Class Biologically Clean Ltd., Madison, WI) at 23°C under a strict 12-hour light cycle (lights on at 0600h).
Male germ-free C57BL/6J mice were initially weaned onto an autoclaved, low-fat, high-plant polysaccharide chow (Envigo diet 2018S) that was administered ad libitum Animals were maintained on this diet until they reached 8 weeks of age. The design and preparation of the Mirpur-18 diet used in these experiments has been described previously (Gehrig et al., 2019). The supplemented version of Mirpur-18 was constructed by adding spirulina powder (5% w/w of final diet), organic flaxseed (2.5%), organic ground amaranth grain (10%) and multiple micronutrient mix (0.025%) to the pre-cooked Mirpur-18 base diet and blending the materials extensively prior to drying and extrusion into ½” diameter pellets using a California Pellet Mill, CL5 (Gehrig et al., 2019; diets manufactured by Dyets, Inc., Bethlehem, PA). The micronutrient mix contained vitamins B3, B6, B9, C, D3 (Gonmisol SA, Spain), and E (BASF, Germany), magnesium, zinc (Chelated Minerals International, Salt Lake City, UT) and selenium (Frutarom, Belgium). The quantities of these immuno-modulating micronutrients used were designed to achieve at least 75% Recommended Dietary Allowances (RDA) for 6 to 12 month-old infants and 1–3-year-old children, while taking into account the natural sources of micronutrients from spirulina and cereals (flaxseed, amaranth). The quantities of each micronutrient are listed in Table S1b.
Portions of dried pellets (250g) were placed in wax-lined paper bags, which in turn were placed in plastic bags, vacuum-sealed and sterilized by irradiation (30–50 kGy; Sterigenics Inc., Rockaway NJ). Sterility was confirmed by culturing pellets under both aerobic and anaerobic growth conditions as previously described (Gehrig et al., 2019). Nutritional analysis of the irradiated diets was performed by Nestlé Purina Analytical Laboratories, St. Louis, MO (Table S1b). Mice were colonized by oral gavage with different intact microbial communities using protocols for sample preparation and administration detailed in Gehrig et al (2019). These human fecal samples were collected during the course of a previously described nutritional interventional study of Bangladeshi children with SAM that was approved by the Ethical Review Committee of the icddr,b (NCT02734264; Gehrig et al., 2019).
Characterization of the cultured 5-member consortium
Using a clonally-arrayed library of cultured bacteria generated from a fecal sample from the R donor (post SAM_MAM PS148.S10; Gehrig et al., 2019), we recovered five strains that were initially assigned to Bacteroides acidifaciens, Bacteroides fragilis, Clostridioides difficile, Clostridium innocuum, and Fusobacterium mortiferum based on sequencing near full-length 16S rRNA amplicons generated from their genomic DNA using primers 27F and 1391R. Barcoded genomic libraries were prepared (Illumina TruSeq Nano DNA Library Prep Kit) and whole genome shotgun sequencing was performed (Illumina MiSeq instrument; paired-end 250 nt reads). Sequencing reads were de-multiplexed and assembled (Spades version 3.5.0). Genes were initially annotated using Prokka (v1.11). Additional annotations were based on Microbial Community SEED (mcSEED). mcSEED subsystems are user-curated lists/tables of specific functions (enzymes, transporters, transcriptional regulators) that capture specific metabolic pathways, or groups of pathways. mcSEED metabolic pathways are lists of genes comprising a particular metabolic pathway or module; they are more granular than a subsystem (Overbeek et al., 2014; Rodionov et al, 2019).
The five strains were grown overnight at 37 °C in LYBHI (Brain–heart infusion medium supplemented with 0.5% yeast extract; Difco), cellobiose (1 mg/mL; Sigma–Aldrich), maltose (1 mg/mL; Sigma-Aldrich), and cysteine (0.5 mg/mL; Merck) under strict anaerobic conditions (atmosphere of 75% N2, 20% CO2, and 5% H2). Cultures were harvested when they reached stationary phase and an equivalent mixture of organisms was created based on OD600nm measurements of the monocultures. The mixture was stored in PBS containing 0.05% cysteine and 15% v/v glycerol at −80 °C. A flexible 3.8 cm long, 20-gauge plastic tube (Fisher) was introduced into the stomach of each recipient mouse and used to deliver a 200 mL aliquot of the consortium.
METHODS DETAILS
Cholera toxin immunization
Each mouse was immunized by oral gavage with a 200 μL solution containing 10 μg of whole cholera toxin (CT, Sigma C8052) and 10 mg of chicken ovalbumin (OVA, Sigma) dissolved in 3% sodium bicarbonate, pH 8.0. Mice received three consecutive immunizations at 7-day intervals.
Flow cytometry
Single cell suspensions were prepared by smashing mesenteric lymph nodes against a 70-micron diameter strainer to isolate lymphocytes. For flow cytometry, single cell suspensions were incubated with Fc Block (clone 2.4G2, Becton Dickinson) for 10 minutes at 4 °C, and then stained with antibodies diluted in Fc Block for 20 minutes at 4 °C. Dead cells were excluded using either a Live/Dead Fixable Cell Stain Kit (ThermoFisher) or DAPI (Sigma). Intracellular proteins were stained using the BD Biosciences Fixation/Permeabilization Solution Kit or the eBioscience Transcription Factor staining kit. Cells were run on a FACSCanto II or FACSAria III and data were analyzed using FlowJo (FlowJo LLC). Cell counts were performed with counting beads (eBioscience). The following fluorophore-labeled monoclonal antibodies were used: (i) CD4 (RM4–5), IgA (C10–3), IgD (26c.2a) from BD Biosciences; (ii) CD62L (MEL-14), CD45 (30-F11), Foxp3 (FJK-16s), CD44 (IM7), CD38 (90) from eBioscience; (iii) CD3ε (145–2C11), CD19 (6D5), TCR-β (H57–597), CD25 (PC61) from Biolegend; and (iv) GL7 (GL-7) from Invitrogen.
Anti-CT-IgA and IgG enzyme-linked immunosorbent assay (ELISA)
To measure anti-cholera toxin specific IgA levels, fecal pellets collected from immunized mice were weighed and re-suspended by vortexing in a PBS solution containing protease inhibitors (ULTRA tablet, Roche; 80 mg feces/mL solution). Samples were centrifuged to remove insoluble particulate material; the resulting supernatants were passed through a 100 mm cell strainer and the flow through was stored at −80 °C. To measure anti-cholera toxin specific IgG, 200 μL of blood was collected from each mouse into a BD Microtainer tube with serum separator and centrifuged. Supernatants were collected, aliquoted and stored at −80 °C until use.
ELISA plates were coated with 100 μL/well of CT (5 μg/mL, Sigma) and incubated at 4 °C overnight, or first pre-coated with 100 μL/well of GM1 (1 μg/ml, Sigma) for 2 hours at room temperature followed by addition of 100 μL/well of CT (5 μg/mL) and incubation at 4 °C overnight. After blocking the plates with 3% (w/v) bovine serum albumin, 100 μL of diluted aliquots of the strained fecal supernatants or of serum were added, and the mixture was incubated at 4 °C overnight. Horseradish peroxidase–conjugated antibodies to mouse IgA or IgG (1:40,000 dilution; Bethyl) was subsequently added and the solution was incubated for 2 hours at room temperature. Plates were developed with TMB-Ultra substrate solution (Thermo-Fisher) and the OD450nm was measured over a 5-minute period. Total IgA was quantified in fecal supernatants by ELISA. The CT-IgA ratio was calculated as a ratio of cholera-specific IgA (defined by OD450nm) to total IgA (expressed in μg/mL).
V4–16S rDNA gene sequencing
DNA was isolated from mouse fecal samples by bead beating in phenol:chloroform and purified on QiaQuick plates (Qiagen). PCR amplification of variable region 4 (V4) of bacterial 16S rRNA genes present in fecal samples was performed using published primers and cycling conditions (Gehrig et al., 2019). Amplicons were sequenced using an Illumina MiSeq instrument (2 × 250 nt reads). Amplicon sequences were oriented, trimmed of adapter and primer sequences and paired using the bbtools (37.02) software package (https://sourceforge.net/projects/bbmap/; ‘bbduk.sh’ and ‘repair.sh’ tools). DADA2 (1.8.0) was used to remove chimeric sequences and to identify amplicon sequence variants (ASVs) (Callahan et al., 2016). Representative sequences for ASVs were then used for taxonomic profiling using the following multi-taxonomic assignment (MTA) approach. Each representative sequence was aligned using NCBI BLAST toolkit version 2.10.0 to the 16S rRNA gene reference database compiled by joining unique sequences from two databases: Ribosomal Database Project (RDP) version 11.5 and the NCBI 16S ribosomal RNA Project. Alignment results were sorted according to the percentage of identity, with maximum values denoted as “M”. Hits with identities in the range from [M] to [M‒ (1‒M)/S] were selected for MTA where “S” represents a scaling parameter that controls the maximum number of taxonomic descriptors accepted for MTA based on 16S rDNA sequence identity (set to 4 in the present study). The resulting MTA for each representative sequence consisted of a list of taxonomic descriptors with assigned equal weights (see Table S2a).
BugFACS
Protocols for BugFACS analysis of gut mucosal IgA targeting of members of the gut microbiota are described in Kau et al. (2015). Briefly, mouse fecal pellets were resuspended in sterile PBS by vortexing; large particulate material was allowed to settle by gravity during a 10-minute incubation on ice. A 200 μL aliquot of the resulting clarified suspension was passed through a 70 mm sterile filter, and the filtrate was centrifuged at 10,000 × g for 1 minute at room temperature. The resulting pellet was washed in 1 mL of PBS; the mixture was centrifuged once again and the pellet was resuspended in 100 μL of PBS containing a 1:50 dilution of polyclonal goat anti-mouse IgA conjugated to DyLight649 (Abcam). Following a 30-minute incubation on ice, the suspension was washed with 1 mL of PBS, centrifuged, and the pellet was resuspended in 200 μL of a solution containing 0.9% NaCl, 0.1M HEPES buffer (pH 7.2) and a 1:4000 dilution of SytoBC solution (Invitrogen/Life Technologies). Samples were sorted using a FACSAria III (BD Biosciences) instrument placed in a laminar flow hood (for sorting parameters, see Kau et al., 2015).
Mass spectrometry
Targeted GC-MS -
Methods for quantification of short chain fatty acids, monosaccharides and amino acids in cecal contents are described in detail in Gehrig et al (2019).
Nontargeted LC-QTOF-MS -
Methods used for these analyses are described in Cowardin et al. (2019). Briefly, cecal contents were homogenized in 20 vol/wt of ice-cold methanol. After centrifugation (8,000 × g, 4 °C), 200 μL of the supernatant was dried in a centrifugal evaporator prior to analysis. To determine whether members of the cultured 5memRCC consortium were able to produce metabolites observed in vivo, pellets of the irradiated unsupplemented M18 or supplemented M18 diets were resuspended at 0.175g/mL (w/v) in sterile minimal medium (composition; 1g/L NH4SO4, 1g/L Na2CO3, 0.05 g/L cysteine, 1M KPO4 pH 7.2, 1 mg/mL Vitamin K, 4 mg/mL FeSO4, 0.005 mg/mL Vitamin B12, 5mL/100 mL of trace mineral supplement (ATCC), and 1 mg/mL resazurin). Following a 24 h incubation at 37 °C under anaerobic conditions (75% N2, 20% CO2 and 5% H2) the diet-media solutions were vortexed and each of the five strains (B. acidifaciens, B. fragilis, C. difficile, C. innocuum, F. mortiferum) were inoculated alone or as a 5-member consortium into aliquots of the media. Cultures were incubated at 37 °C for 48 h under anaerobic conditions without shaking. Bacterial cells were harvested by centrifugation (3,000 × g for 10 minutes) when the cultures reached stationary phase; the resulting supernatants were collected and passed through a 100 μm strainer (Falcon, Becton Dickinson) to remove debris, and subsequently through a 0.22 μm filter (Stericup, Millipore) to remove remaining cells. Filtered supernatants were stored at −80 °C. Aliquots of the frozen material (200 μL) were thawed and dried in a centrifugal evaporator.
Dried samples of cecal contents and filtered culture supernatants were re-suspended in 100 μL of 10% methanol and centrifuged at 8,000 × g for 2 minutes at 4 °C. An 80 μL aliquot of each supernatant was placed into a sample vial. Untargeted metabolomics was performed using an Agilent 1290 LC system coupled to an Agilent 6545 Q-TOF mass spectrometer. Five μL of each prepared sample for positive ESI ionization were injected onto a BEH C18 column (2.1 × 150 mm, 1.7 μm, Waters Corp.), which was heated to 35 °C. The mobile phase consisted of 0.1% formic acid in water (A) and 0.1% formic acid in acetonitrile (B). The following gradient was applied at a flow rate of 0.3 ml/min over 14 minutes; 95% A/5% B to 100% B, followed by 3 minutes at 100% B. Reference standards with m/z 121.0509 and 922.0098 were automatically delivered using a dual ESI source. The mass accuracy of our instrument was better than 4 ppm.
QUANTIFICATION AND STATISTICAL ANALYSIS
Linear mixed-effects models and linear models, followed by linear contrasts of marginal means with P-values corrected by Holm’s method, were used to test for significant differences in mean values of immunological phenotypes between microbiota and diet treatments. Proportions were logit-transformed prior to analyses. Where appropriate, random effects were used to control for effects of different experiments. Models and comparisons were performed using R (v3.6.1; R Core Team, 2019) and the packages “lme4” (Bates et al., 2015), “car” (Fox and Weisberg, 2019), and “emmeans” (Lenth, 2019). Principal coordinates analyses and permutational multivariate analyses of variance were performed using the R packages “ape” (Paradis and Schliep, 2018) and “vegan” (Oksanen et al., 2019). Indicator species analysis was conducted using the package “indicspecies” (De Caceres and Legendre, 2009).
Supplementary Material
Table S3 – Mass spectrometry of cecal contents; related to Figures 2 and 3. (A) ANOVA table for short-chain fatty acids quantified by targeted GC-MS in cecal contents from gnotobiotic mice after co-housing (Figure 2D–F). (B) Post-hoc comparisons of SCFA in cecal contents harvested from gnotobiotic mice after co-housing. (C) Summary of SCFA in cecal contents from gnotobiotic mice following co-housing. (D) ANOVA of short-chain fatty acids in cecal contents of mice fed the supplemented M18 diet and initially colonized with the HypoR microbiota and subsequently with the HypoR, R, or 5memRCC communities. (E) Post-hoc comparisons of SCFA in cecal contents of mice fed the supplemented M18 diet and colonized with the HypoR microbiota and subsequently with the HypoR, R, or 5memRCC communities. (F) Summary of SCFA in cecal contents of mice fed the supplemented M18 diet and colonized with the HypoR microbiota and subsequently with the HypoR, R, or 5memRCC communities.
(G) Analytes, measured by LC-QTOF-MS of cecal contents obtained from mice in the experiment shown in Figure 3, with correlation values in the upper 10% of positive values among all significant correlations with CT-IgA ratio. (H) Diet-responsive analytes measured by LC-QTOF-MS in the experiment described in Figure 2A. (I) Analytes measured in vitro by LC-QTOF-MS.
Table S4 – Annotation of 5memRCC genomes; related to Figure 3.
(a) Annotation of the genomes of the five cultured sequenced bacterial strains (5memRCC) used in the experiment shown in Figure 3.
(b) Reconstructions for each metabolic subsystem for each of the five strains comprising the 5memRCC, related to Figure 3. (A) Vitamin and cofactor biosynthesis pathways. (B) Amino acid biosynthesis pathways. (C) Carbohydrate utilization pathways. (D) Central carbohydrate metabolism. (E) Fermentation pathways. (F) Amino acid degradation pathways. (G) Miscellaneous metabolic pathways.
Table S1 – Donor metadata, nutritional analysis of diets and characterization of mouse immunologic phenotypes; related to Figures 1, 2 and 3.
(a) Metadata related to microbiota donors, related to Figures 1, 2 and 3.
(b) Formulation and nutritional analysis of the unsupplemented and supplemented Mirpur-18 diets, related to Figures 1, 2 and 3. (A) Diet formulations. (B) Results of nutritional analysis of irradiated diets. (C) Quantification of carbohydrates and amino acids in the M18 and supplemented M18 diets and in cecal contents of germ-free mice fed these diets.
(c) Analyses of immunological phenotypes, related to Figures 1B,C, 2B and 3C. (A) ANOVA tables for immune phenotypes measured in feces, mesenteric lymph nodes and serum obtained from mice colonized with HypoR and R human microbiota (experiments outlined in Figure 1A). (B) Post-hoc comparisons of immune phenotypes in feces, mesenteric lymph nodes, and serum in experiments described in Figure 1. (C) Summary of immune phenotypes identified in Figure 1-related experiments.
(D) ANOVA table of immune phenotypes in feces and mesenteric lymph nodes of mice fed the M18 and Supplemented M18 diet and initially colonized with the HypoR or R communities followed by co-housing with mice harboring HypoR or R microbiota (experiments outlined in Figure 2). (E) Post-hoc comparisons of immune phenotypes measured in feces and mesenteric lymph nodes obtained from mice described in panel D. (F) Summary of immune phenotypes described in Figure 2 and in panels D and E lof this table. (G) ANOVA of immune phenotypes measured in feces and mesenteric lymph nodes harvested from mice described in Figure 3. (H) Post-hoc comparisons of immune phenotypes described in panel G. (I) Summary of immune phenotypes described in panels G and H of this Table.
Table S2 – Indicator species analysis and identification of invading bacterial taxa; related to Figures 1, 2 and 3.
(a) Amplicon sequence variants (ASVs) and their assigned taxonomy, related to Figures 1D, 2C and 3B.
(b) Indicator species analysis of bacterial taxa (ASVs) associated with R and HypoR microbiota related to Figure 1D.
(c) Successfully invading bacterial taxa. (A) Summary of invasion success of bacterial taxa (ASVs) in the co-housing experiment described in Figure 2A, on the M18 diet. (B) Summary of invasion success of bacterial taxa (ASVs) in the co-housing experiment described in Figure 2A, on the supplemented M18 diet. (C) Summary of invasion success of bacterial taxa (ASVs) in the co-gavage experiment described in Figure 3A, in mice fed the supplemented M18 diet.
KEY RESOURCES
| REAGENT or RESOURCE | SOURCE | IDENTIFIER |
|---|---|---|
| Antibodies | ||
| Hamster anti-mouse CD3e PerCP/Cy5.5 (145–2C11) | Biolegend | Cat#100328; RRID:AB_893318 |
| Anti-mouse CD19 PE/Cy7 (6D5) | Biolegend | Cat#115520; RRID:AB_313655 |
| Rat anti-human/mouse RORγ(t) APC (AFKJS-9) | eBioscience | Cat#17-6988-82; RRID:AB_10609207 |
| Rat anti-mouse CD45 APC-eFluor780 (30-F11) | eBioscience | Cat#47-0451-82; RRID:AB_1548781 |
| Rat anti-mouse CD4 PerCP/Cy5.5 (RM4–5) | BD Biosciences | Cat#550954; RRID:AB_393977 |
| Rat anti-mouse/rat Foxp3 PE (FJK-16 s) | eBioscience | Cat#12-5773-82; RRID:AB_465936 |
| Rat anti-mouse CD62L PE (MEL-14) | BD Biosciences | Cat#553151; RRID:AB_394666 |
| Rat anti-human/mouse CD44 FITC (IM7) | eBioscience | Cat#11-0441-82; RRID:AB_465045 |
| Rat anti-mouse IgA FITC (C10–3) | BD Biosciences | Cat#559354; RRID:AB_397235 |
| Rat anti-mouse IgD PerCP/Cy5.5 (11–26c.2a) | BD Biosciences | Cat#564273; RRID:AB_2738722 |
| Anti-Human/Mouse GL7 PE (GL-7) | Invitrogen | Cat#12-5902-80; RRID:AB_2572637 |
| Anti-mouse CD38 eFluor450 (90) | eBioscience | Cat#48-0381-82; RRID:AB_11218302 |
| anti-mouse TCR-beta APC-eFluor780 (H57–597) | eBioscience | Cat#47-5961-80; RRID:AB_1272209 |
| Anti-mouse CD25 APC-Cy7 (PC61) | Biolegend | Cat#102025; RRID:AB_830744 |
| Rat anti-mouse CD45 BV421 (30-F11) | Biolegend | Cat#103134; RRID:AB_2562559 |
| Anti-mouse CD3e APC (145–2C11) | eBioscience | Cat#17-0031-83; RRID:AB_469316 |
| Goat anti-mouse IgA-HRP | Bethyl | Cat#A90–103P; RRID:AB_67140 |
| Bacterial Strains | ||
| Bacteroides fragilis, from bacterial culture collection, donor fecal sample PS148.S10 | Gehrig et al., 2019 | |
| Bacteroides acidifaciens, from bacterial culture collection, donor fecal sample PS148.S10 | Gehrig et al., 2019 | |
| Clostridium innocuum, from bacterial culture collection, donor fecal sample PS148.S10 | Gehrig et al., 2019 | |
| Peptoclostridium difficile, from bacterial culture collection, donor fecal sample PS148.S10 | Gehrig et al., 2019 | |
| Fusobacterium varium, from bacterial culture collection, donor fecal sample PS148.S10 | Gehrig et al., 2019 | |
| Biological samples (Provided by icddr,b Bangladesh under MTA) | ||
| Human donor fecal sample PS.046.S10 | Gehrig et al., 2019 | |
| Human donor fecal sample PS.064.S04 | Gehrig et al., 2019 | |
| Human donor fecal sample PS.064.S11 | Gehrig et al., 2019 | |
| Human donor fecal sample PS.148.S10 | Gehrig et al., 2019 | |
| Chemicals, Peptides, and Recombinant Proteins | ||
| Cholera Toxin from Vibrio cholerae | Sigma | Cat#C8052–2MG |
| Ovalbumin (OVA) | Sigma | Cat#A5503 |
| GM1 | Sigma | Cat#G7641 |
| Platinum TAQ DNA Polymerase High Fidelity | ThermoFisher Scientific | Cat#11304102 |
| 10 mM DNTP Mix | ThermoFisher Scientific | Cat#18427088 |
| Critical Commercial Assays | ||
| Foxp3 transcription factor staining Buffer set | eBioscience | Cat#00-5523-00 |
| BD Cytofix/Cytoperm Plus | BD Biosciences | Cat#555028 |
| Ready-SET-Go! ELISA | eBioscience | Cat#88–50450 |
| Quant-iT dsDNA assay kit, broad range | ThermoFisher Scientific | Cat#33130 |
| QIAquick 96 PCR Purification Kit | Qiagen | Cat#28183 |
| Deposited Data | ||
| V4–16S rRNA sequences | This study | ENA: PRJEB35845 |
| Genomic sequences | This study | ENA: PRJEB35845 |
| Experimental Models: Organisms/Strains | ||
| C57BL/6J mice (re-derived germ-free) | The Jackson Laboratory | Cat# 000664 |
| Oligonucleotides | ||
| V4–16SrDNA_515F: GTGCCAGCAGCCGCGGTAA | Caparaso et al., 2012 | N/A |
| V4–16SrDNA_806R: GGACTACCAGGGTATCTAAT | Caparaso et al., 2012 | N/A |
| Software and Algorithms | ||
| FlowJo | Tree Star | https://www.flowjo.com/ |
| R v3.6.1 | The R Foundation | https://r-project.org/ |
| indicspecies (R package) | De Caceres and Legendre, 2009 | vegmod.ctfc.cat/software/indicspecies |
| dada2 (R package) | Callahan et al., 2016 | benjjneb.github.io/dada2/ |
| emmeans (R package) | Lenth, 2019 | cran.r-project.org/web/packages/emmeans |
| car (R package) | Fox and Weisberg, 2019 | cran.r-project.org/web/packages/car |
| lme4 (R package) | Bates et al., 2015 | cran.r-project.org/web/packages/lme4 |
| vegan (R package) | Oksanen et al., 2019 | cran.r-project.org/web/packages/vegan |
Highlights.
Mice with microbiota from undernourished children have varied CT vaccine responses
Nutraceutical improves varied vaccine responses to oral CT in gnotobiotic mice
Co-housing mice with responsive (R) and hypoR microbiota improves CT responses
Five bacterial strains plus nutraceutical promotes vaccine efficacy in HypoR animals
Acknowledgements:
We thank Dave O’Donnell, Maria Karlsson, Marty Meier, Sabrina Wagoner, Justin Serugo, Su Deng and Jessica Hoisington-López for superb technical assistance, Jeanette Gehrig, Matt Hibberd, Chandani Desai, and Carrie Cowardin for their helpful input during the course of this study. We are grateful to Stanislav Iablokov for providing the multi-taxonomy assignment tool, and Jim Brown, Nathalie Devos and Benjamin Wizel for their critical reading of the manuscript.
This work was supported by GSK through a grant to J.I.G. and the NIH through a grant to J.I.G. and A.O. (DK30292). P.P.A. was the recipient of a Sir Henry Wellcome Postdoctoral Fellowship from the Wellcome Trust (096100). J.I.G. is the recipient of a Thought Leader award from Agilent Technologies.
Footnotes
Publisher's Disclaimer: This is a PDF file of an unedited manuscript that has been accepted for publication. As a service to our customers we are providing this early version of the manuscript. The manuscript will undergo copyediting, typesetting, and review of the resulting proof before it is published in its final form. Please note that during the production process errors may be discovered which could affect the content, and all legal disclaimers that apply to the journal pertain.
Declaration of interests: J.I.G. is a co-founder of Matatu, Inc., a company characterizing the role of diet-by-microbiota interactions in animal health. N.F.D is an employee of the GSK group of companies and reports ownership of GSK shares and/or restricted GSK shares. GSK and Washington University have filed a joint patent application describing the potential utility of the prebiotic and probiotic formulations.
REFERENCES
- Ali M, Nelson AR, Lopez AL, and Sack DA (2015). Updated global burden of cholera in endemic countries. PLoS Negl. Trop. Dis 9, e0003832. [DOI] [PMC free article] [PubMed] [Google Scholar]
- Appaiahgari MB, Glass R, Singh S Taneja S, Rongsen-Chandola T, Bhandari N, Mishra S, and Vrati S (2014). Transplacental rotavirus IgG interferes with immune response to live oral rotavirus vaccine ORV-116E in Indian infants. Vaccine 32, 651–656. [DOI] [PubMed] [Google Scholar]
- Arora T, Rudenko O, Egerod KL, Husted AS, Kovatcheva-Datchary P, Akrami R, Kristensen M, Schwartz TW, Bäckhed F (2019). Microbial fermentation of flaxseed fibers modulates the transcriptome of GPR41-expressing enteroendocrine cells and protects mice against diet-induced obesity. Am J Physiol Endocrinol. Metab 316, E453–E463. [DOI] [PubMed] [Google Scholar]
- Bates D, Maechler M, Bolker B, and Walker S (2015). Fitting linear mixed-effects models using lme4. J. Stat. Softw 67, 1–48. [Google Scholar]
- Bhattacharya SK et al. , (2013). 5-year efficacy of a bivalent killed whole-cell oral cholera vaccine in Kolkata, India: a cluster-randomised, double-blind, placebo-controlled trial. Lancet Infect. Dis 13, 1050–1056. [DOI] [PubMed] [Google Scholar]
- Blanton LV, et al. , (2016). Gut bacteria that prevent growth impairments transmitted by microbiota from malnourished children. Science 351, aad3311. [DOI] [PMC free article] [PubMed] [Google Scholar]
- Callahan BJ, McMurdie PJ, Rosen MJ, Han AW, Johnson AJ, and Holmes SP (2016). DADA2: High-resolution sample inference from Illumina amplicon data. Nat. Methods 13, 581–583. [DOI] [PMC free article] [PubMed] [Google Scholar]
- Caporaso JG, et al. (2012). Ultra-high-throughput microbial community analysis on the Illumina HiSeq and MiSeq platforms. ISME J 6, 1621–1624. [DOI] [PMC free article] [PubMed] [Google Scholar]
- Chan J, et al. (2011). Maternal antibodies to rotavirus: could they interfere with live rotavirus vaccines in developing countries? Vaccine 29, 1242–1247. [DOI] [PubMed] [Google Scholar]
- Chu WL, Quynh le V, and Radhakrishnan AK (2013). Effect of Spirulina (Arthrospira) supplementation on the immune response to tetanus toxoid vaccination in a mouse model. J. Diet Suppl 10, 229–240. [DOI] [PubMed] [Google Scholar]
- Cowardin CA, et al. (2019). Mechanisms by which sialylated milk oligosaccharides impact bone biology in a gnotobiotic mouse model of infant undernutrition. Proc. Natl. Acad. Sci. USA 116, 11988–11996. [DOI] [PMC free article] [PubMed] [Google Scholar]
- De Caceres M, and Legendre P (2009). Associations between species and groups of sites: indices and statistical inference. Ecology 90, 3566–3574. [DOI] [PubMed] [Google Scholar]
- Dufrêne M and Legendre P (1997). Species assemblages and indicator species:the need for a flexible asymmetrical approach. Ecological Monographs, 67, 345–366. [Google Scholar]
- Finamore A, Palmery M, Bensehaila S, and Peluso I (2017). Antioxidant, Immunomodulating, and Microbial-Modulating Activities of the Sustainable and Ecofriendly Spirulina. Oxid. Med. Cell Longev 3247528. [DOI] [PMC free article] [PubMed] [Google Scholar]
- Fox J, and Weisberg S (2019). An R companion to applied regression, 3rd edition Thousand Oaks, CA: Sage; URL https://socialsciences.mcmaster.ca/jfox/Books/Companion [Google Scholar]
- Gehrig JL, et al. , (2019). Effects of microbiota-directed foods in gnotobiotic animals and undernourished children. Science 365, 6449, eaau4732. [DOI] [PMC free article] [PubMed] [Google Scholar]
- Gorinstein S, Vargas OJM, Jaramillo NO, Salas IA, Ayala ALM, Arancibia-Avila P, Toledo F, Katrich E, and Trakhtenberg S (2007). The total polyphenols and the antioxidant potentials of some selected cereals and pseudocereals. Eur. Food Res. Technol 225, 321–328. [Google Scholar]
- Harris VC, et al. , (2017). Significant Correlation Between the Infant Gut Microbiome and Rotavirus Vaccine Response in Rural Ghana. J. Infect. Dis 215, 34–41. [DOI] [PMC free article] [PubMed] [Google Scholar]
- Harris V, et al. , (2018). Rotavirus vaccine response correlates with the infant gut microbiota composition in Pakistan. Gut Microbes 9, 93–101. [DOI] [PMC free article] [PubMed] [Google Scholar]
- Huerta-Ocampo JA and Barba de la Rosa AP (2011). Amaranth: A pseudo-cereal with nutraceutical properties. Current Nutrition Food Science 7, 1–9. [Google Scholar]
- Kau AL, et al. , (2015). Functional characterization of IgA-targeted bacterial taxa from undernourished Malawian children that produce diet-dependent enteropathy. Sci. Transl. Med 7, 276ra24. [DOI] [PMC free article] [PubMed] [Google Scholar]
- Khan AI, et al. , (2018). The impact and cost-effectiveness of controlling cholera through the use of oral cholera vaccines in urban Bangladesh: A disease modeling and economic analysis. PLoS Negl. Trop. Dis 12, e0006652. [DOI] [PMC free article] [PubMed] [Google Scholar]
- Kim M, Qie Y, Park J, and Kim CH (2016). Gut microbial metabolites fuel host antibody responses. Cell Host Microbe 20, 202–214. [DOI] [PMC free article] [PubMed] [Google Scholar]
- Lenth R (2019). emmeans: estimated marginal means, aka least-squares means. R package version 1.4.1 URL https://CRAN-R-project.org/package=emmeans. [Google Scholar]
- Liu B, Zheng DD, Jin Q, Chen LH, and Yang J (2019). VFDB 2019: a comparative pathogenomic platform with an interactive web interface. Nucleic Acids Res 47, D687–D692. [DOI] [PMC free article] [PubMed] [Google Scholar]
- Maggini S, Pierre A and Calder PC (2018). Immune Function and Micronutrient Requirements Change over the Life Course. Nutrients 10, 1531. [DOI] [PMC free article] [PubMed] [Google Scholar]
- Marie C, Ali A, Chandwe K, Petri WA Jr. and Kelly P (2018). Pathophysiology of environmental enteric dysfunction and its impact on oral vaccine efficacy. Mucosal Immunol 11, 1290–1298. [DOI] [PubMed] [Google Scholar]
- Morrow AL, Ruiz-Palacios GM, Jiang X, Newburg DS (2005). Human-milk glycans that inhibit pathogen binding protect breast-feeding infants against infectious diarrhea. J. Nutr 135, 1304–1307. [DOI] [PubMed] [Google Scholar]
- Neyrinck AM, Taminiau B, Walgrave H, Daube G, Cani PD, Bindels LB, Delzenne NM (2017). Spirulina Protects against Hepatic Inflammation in Aging: An Effect Related to the Modulation of the Gut Microbiota? Nutrients 9, E633. [DOI] [PMC free article] [PubMed] [Google Scholar]
- Nimbalkar MS, Pai SR, Pawar NV, and Oulkar D (2012). Dixit GB. Free amino acid profiling in grain Amaranth using LC–MS/MS. Food Chem 134, 2565–2569. [DOI] [PubMed] [Google Scholar]
- Oksanen J, et al. (2019). vegan: community ecology package. R package version 2.5–6 URL https://CRAN.R-project.org/package=vegan. [Google Scholar]
- Overbeek R, et al. (2005). The subsystems approach to genome annotation and its use in the project to annotate 1000 genomes. Nucleic Acids Res 33, 5691–702. [DOI] [PMC free article] [PubMed] [Google Scholar]
- Overbeek R, et al. (2014). The SEED and the Rapid Annotation of microbial genomes using Subsystems Technology (RAST). Nucleic Acids Res 42, D206–D214. [DOI] [PMC free article] [PubMed] [Google Scholar]
- Paradis E, and Schliep K (2018). ape 5.0: an environment for modern phylogenetics and evolutionary analyses in R. Bioinformatics 35, 526–528. [DOI] [PubMed] [Google Scholar]
- Parker EP, Ramani S, Lopman BA, Church JA, Iturriza-Gómara M, Prendergast AJ, and Grassly NC (2018a). Causes of impaired oral vaccine efficacy in developing countries. Future Microbiol 13, 97–118. [DOI] [PMC free article] [PubMed] [Google Scholar]
- Parker EP, et al. (2018b). Influence of the intestinal microbiota on the immunogenicity of oral rotavirus vaccine given to infants in south India. Vaccine 36, 264–272. [DOI] [PMC free article] [PubMed] [Google Scholar]
- Prendergast AJ and Humphrey JH (2014). The stunting syndrome in developing countries. Paediatr. Int. Child Health 34, 250–265. [DOI] [PMC free article] [PubMed] [Google Scholar]
- Raman AS, et al. (2019). A sparse covarying unit that describes healthy and impaired human gut microbiota development. Science 365, eaau4735. [DOI] [PMC free article] [PubMed] [Google Scholar]
- R Core Team. (2019). R: a language and environment for statistical computing R Foundation for Statistical Computing, Vienna, Austria: URL https://www.R-project.org/. [Google Scholar]
- Rodionov DA, Arzamasov AA, Khoroshkin MS, Iablokov SN, Leyn SA, Peterson SN, Novichkov PS, and Osterman AL (2019). Micronutrient Requirements and Sharing Capabilities of the Human Gut Microbiome. Front. Microbiol 10, 1316. [DOI] [PMC free article] [PubMed] [Google Scholar]
- Saslowsky DE, te Welscher YM, Chinnapen DJ, Wagner JS, Wan J, Kern E, and Lencer WI (2013). Ganglioside GM1-mediated transcytosis of cholera toxin bypasses the retrograde pathway and depends on the structure of the ceramide domain. J. Biol. Chem 288, 25804–9. [DOI] [PMC free article] [PubMed] [Google Scholar]
- Stratmann T (2015). Cholera Toxin Subunit B as Adjuvant--An Accelerator in Protective Immunity and a Break in Autoimmunity. Vaccines 3, 579–96. [DOI] [PMC free article] [PubMed] [Google Scholar]
- Subramanian S, et al. (2014). Persistent gut microbiota immaturity in malnourished Bangladeshi children. Nature 510, 417–421. [DOI] [PMC free article] [PubMed] [Google Scholar]
- UNICEF, World Health Organization, W. B. Group, (2015). Levels and trends in child malnutrition, 1–6.
- Valdezi Y, and Brown EM (2014). Finlay BB. Influence of the microbiota on vaccine effectiveness. Trends Immunol 35, 526–537. [DOI] [PubMed] [Google Scholar]
- van Splunter M, et al. (2018). Oral cholera vaccination promotes homing of IgA+ memory B cells to the large intestine and the respiratory tract. Mucosal. Immunol 11, 1254–1264. [DOI] [PubMed] [Google Scholar]
- Victora CG, et al. (2008). Maternal and child undernutrition: consequences for adult health and human capital. Lancet 371, 340–357. [DOI] [PMC free article] [PubMed] [Google Scholar]
- Yang W, et al. (2019). Microbiota Metabolite Short-Chain Fatty Acids Facilitate Mucosal Adjuvant Activity of Cholera Toxin through GPR43. J. Immunol 203, 282–292. [DOI] [PMC free article] [PubMed] [Google Scholar]
Associated Data
This section collects any data citations, data availability statements, or supplementary materials included in this article.
Supplementary Materials
Table S3 – Mass spectrometry of cecal contents; related to Figures 2 and 3. (A) ANOVA table for short-chain fatty acids quantified by targeted GC-MS in cecal contents from gnotobiotic mice after co-housing (Figure 2D–F). (B) Post-hoc comparisons of SCFA in cecal contents harvested from gnotobiotic mice after co-housing. (C) Summary of SCFA in cecal contents from gnotobiotic mice following co-housing. (D) ANOVA of short-chain fatty acids in cecal contents of mice fed the supplemented M18 diet and initially colonized with the HypoR microbiota and subsequently with the HypoR, R, or 5memRCC communities. (E) Post-hoc comparisons of SCFA in cecal contents of mice fed the supplemented M18 diet and colonized with the HypoR microbiota and subsequently with the HypoR, R, or 5memRCC communities. (F) Summary of SCFA in cecal contents of mice fed the supplemented M18 diet and colonized with the HypoR microbiota and subsequently with the HypoR, R, or 5memRCC communities.
(G) Analytes, measured by LC-QTOF-MS of cecal contents obtained from mice in the experiment shown in Figure 3, with correlation values in the upper 10% of positive values among all significant correlations with CT-IgA ratio. (H) Diet-responsive analytes measured by LC-QTOF-MS in the experiment described in Figure 2A. (I) Analytes measured in vitro by LC-QTOF-MS.
Table S4 – Annotation of 5memRCC genomes; related to Figure 3.
(a) Annotation of the genomes of the five cultured sequenced bacterial strains (5memRCC) used in the experiment shown in Figure 3.
(b) Reconstructions for each metabolic subsystem for each of the five strains comprising the 5memRCC, related to Figure 3. (A) Vitamin and cofactor biosynthesis pathways. (B) Amino acid biosynthesis pathways. (C) Carbohydrate utilization pathways. (D) Central carbohydrate metabolism. (E) Fermentation pathways. (F) Amino acid degradation pathways. (G) Miscellaneous metabolic pathways.
Table S1 – Donor metadata, nutritional analysis of diets and characterization of mouse immunologic phenotypes; related to Figures 1, 2 and 3.
(a) Metadata related to microbiota donors, related to Figures 1, 2 and 3.
(b) Formulation and nutritional analysis of the unsupplemented and supplemented Mirpur-18 diets, related to Figures 1, 2 and 3. (A) Diet formulations. (B) Results of nutritional analysis of irradiated diets. (C) Quantification of carbohydrates and amino acids in the M18 and supplemented M18 diets and in cecal contents of germ-free mice fed these diets.
(c) Analyses of immunological phenotypes, related to Figures 1B,C, 2B and 3C. (A) ANOVA tables for immune phenotypes measured in feces, mesenteric lymph nodes and serum obtained from mice colonized with HypoR and R human microbiota (experiments outlined in Figure 1A). (B) Post-hoc comparisons of immune phenotypes in feces, mesenteric lymph nodes, and serum in experiments described in Figure 1. (C) Summary of immune phenotypes identified in Figure 1-related experiments.
(D) ANOVA table of immune phenotypes in feces and mesenteric lymph nodes of mice fed the M18 and Supplemented M18 diet and initially colonized with the HypoR or R communities followed by co-housing with mice harboring HypoR or R microbiota (experiments outlined in Figure 2). (E) Post-hoc comparisons of immune phenotypes measured in feces and mesenteric lymph nodes obtained from mice described in panel D. (F) Summary of immune phenotypes described in Figure 2 and in panels D and E lof this table. (G) ANOVA of immune phenotypes measured in feces and mesenteric lymph nodes harvested from mice described in Figure 3. (H) Post-hoc comparisons of immune phenotypes described in panel G. (I) Summary of immune phenotypes described in panels G and H of this Table.
Table S2 – Indicator species analysis and identification of invading bacterial taxa; related to Figures 1, 2 and 3.
(a) Amplicon sequence variants (ASVs) and their assigned taxonomy, related to Figures 1D, 2C and 3B.
(b) Indicator species analysis of bacterial taxa (ASVs) associated with R and HypoR microbiota related to Figure 1D.
(c) Successfully invading bacterial taxa. (A) Summary of invasion success of bacterial taxa (ASVs) in the co-housing experiment described in Figure 2A, on the M18 diet. (B) Summary of invasion success of bacterial taxa (ASVs) in the co-housing experiment described in Figure 2A, on the supplemented M18 diet. (C) Summary of invasion success of bacterial taxa (ASVs) in the co-gavage experiment described in Figure 3A, in mice fed the supplemented M18 diet.
Data Availability Statement
V4–16S rDNA sequences in raw format prior to post-processing and data analysis, and the genome sequences of the five cultured bacterial strains have been deposited at the European Nucleotide Archive (study accession number, PRJEB35845). The original datasets used in this study for immune phenotyping and metabolomic analysis are available on request from the corresponding author, Jeffrey I. Gordon (jgordon@wustl.edu).