Abstract
Tumor‐immune crosstalk within the tumor microenvironment (TME) occurs at all stages of tumorigenesis. Tumor‐associated M2 macrophages play a central role in tumor development, but the molecular underpinnings have not been fully elucidated. We demonstrated that M2 macrophages produce interleukin 1β (IL‐1β), which activates phosphorylation of the glycolytic enzyme glycerol‐3‐phosphate dehydrogenase (GPD2) at threonine 10 (GPD2 pT10) through phosphatidylinositol‐3‐kinase‐mediated activation of protein kinase‐delta (PKCδ) in glioma cells. GPD2 pT10 enhanced its substrate affinity and increased the catalytic rate of glycolysis in glioma cells. Inhibiting PKCδ or GPD2 pT10 in glioma cells or blocking IL‐1β generated by macrophages attenuated the glycolytic rate and proliferation of glioma cells. Furthermore, human glioblastoma tumor GPD2 pT10 levels were positively correlated with tumor p‐PKCδ and IL‐1β levels as well as intratumoral macrophage recruitment, tumor grade and human glioblastoma patient survival. These results reveal a novel tumorigenic role for M2 macrophages in the TME. In addition, these findings suggest possible treatment strategies for glioma patients through blockade of cytokine crosstalk between M2 macrophages and glioma cells.
Keywords: glioblastoma, glioma, GPD2, macrophage, PKCδ
Tumor‐associated macrophages regulate glioma cell glycolysis through GPD2. GPD2 pT10 correlates with grades and prognosis in glioblastoma patients.
1. INTRODUCTION
Tumor‐immune crosstalk within the tumor microenvironment (TME) occurs at all stages of tumorigenesis. The TME comprises diverse cellular types, from cancer cells and organ and vascular cells of the surrounding and admixed tissue, to infiltrating immune cells. 1 , 2 , 3 , 4 Macrophages are especially recruited in high numbers to the tumor site during tumor development. 5 As tumors progress, these tumor‐associated macrophages (TAM) polarize toward an “alternatively activated” M2 phenotype that stimulates neoangiogenesis, cancer cell migration and intravasation, while blocking the antitumor immune response. 6 Consequently, unravelling how TAM support tumor development could elucidate novel therapeutic strategies.
To sustain their accelerated growth, tumor cells exhibit an altered metabolism, 7 such as by producing the metabolic intermediates required for cellular proliferation and shifting from oxidative phosphorylation to aerobic glycolysis. 8 Metabolic processes in tumor cells are influenced by both the TME and genetic aspects. 9 Hypoxia within the TME exerts an effect on tumor cell metabolism, in addition to other characteristics such as proliferation, migration and drug susceptibility. 10 , 11 Whereas the mechanisms by which tumor cells restructure their metabolic state to sustain tumor development are well‐studied, 7 , 8 , 9 there is much less research on how TME immune cells such as TAM control cancer cell metabolism to sustain tumor growth.
The metabolic enzyme glycerol‐3‐phosphate dehydrogenase (GPD) may be a key player in tumor cells that have shifted to aerobic glycolysis. 12 GPD exists as two isoforms working in parallel that constitute the glycerol 3‐phosphate (G3P) shuttle system. GPD1 converts dihydroxyacetone phosphate (DHAP) to G3P within the cytoplasm, creating nicotine adenine dinucleotide (NADH), whereas GPD2 converts G3P to DHAP within the mitochondrial membrane, thereby regenerating NAD+ from NADH. The reaction catalyzed by GPD2 is the rate‐limiting step within this G3P shuttle system. GPD2 is upregulated in various human tumors, 12 where the pro–inflammatory cytokine interleukin‐1 (IL‐1β) upregulates GPD2 expression. 13 Herein, we examine the role of GPD2 in TAM‐driven glioma tumor growth and uncover a novel mechanism by which TAM reprogram tumor cell metabolism to favor accelerated tumor growth.
2. MATERIALS AND METHODS
Approval for this study was obtained from the Ethics Review Committee at the General Hospital of TISCO (Taiyuan, Shanxi, China). All human tissue donors provided written informed consent prior to participation. All animal procedures were performed according to the recommendations specified in the “Guide for the Care and Use of Laboratory Animals” manual, published the National Institutes of Health (NIH) (8th edition). Details of the experimental methods are provided in the Supporting Information. The shRNA used in this study are detailed in Table S1. The quantitative PCR primers used are outlined in Table S2. The antibodies used are presented in Table S3.
3. RESULTS
3.1. Macrophage‐stimulated cancer cell proliferation is dependent on glycerol‐3‐phosphate dehydrogenase
We generated an in vitro system to examine the impact of macrophage‐stimulated tumor development on glioma cell GPD2. Activated M2 macrophages (M2 cells) were produced by differentiating human THP‐1 monocytes through stimulation with TPA followed by IL‐4 and IL‐13, which we confirmed by the presence of CD163 (Figure S1A). Unpolarized THP‐1 cells or polarized M2 cells were co–cultured with glioma U‐87 or U‐251 cells (Figure S1B). We used shRNA to knockdown GPD2 expression in U‐87 and U‐251 glioma cultures (Figure 1A and Figure S1C), which were incubated with unactivated THP‐1 cells or activated M2 cells. Cellular proliferation increased in the presence of M2 cells (but not in the presence of THP‐1 cells), an effect almost fully reversed by GPD2 knockdown (Figure 1B and Figure S1D). The result implies that macrophage‐stimulated cancer cell proliferation is dependent on GPD2.
Figure 1.
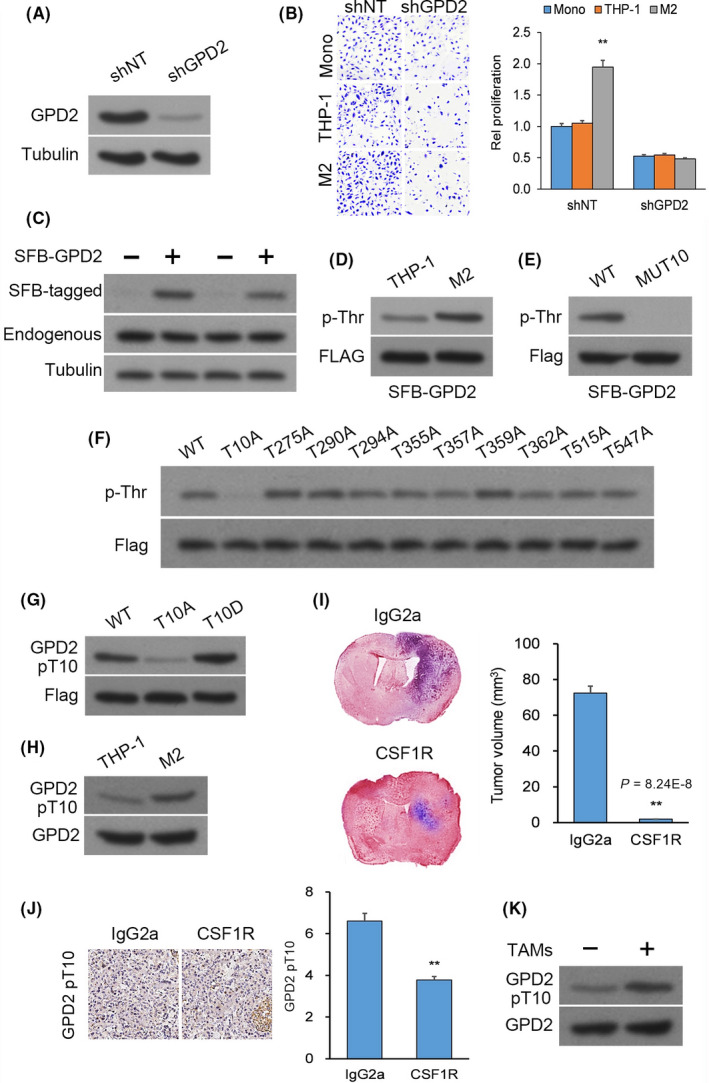
Macrophages induce glycerol‐3‐phosphate dehydrogenase (GPD2) phosphorylation at T10. A, Western blot (WB) of U‐87 cultures transfected with lentiviral shGPD2 or scrambled control (shNT). B, Cellular proliferation by crystal violet of U‐87 cells with stable transfection of shGPD2 or shNT in mono–culture or co–culture with THP‐1 cells or M2 cells at seven days. C, WB of U‐87 and U‐251 cultures with stable transfection of S‐FLAG‐streptavidin‐binding peptide (SFB)‐tagged GPD2. D, Pull‐down assay (PD) with streptavidin beads from U‐87 cultures with stable transfection of S‐FLAG‐streptavidin‐binding peptide (SFB)‐GPD2 co–cultured for 24 h with M2 or THP‐1 cells. E, PD with streptavidin beads from U‐87 cultures with stable transfection of wild‐type (WT) SFB‐GPD2 or mutant SFB‐GPD2‐MUT10. F, PD with streptavidin beads from U‐87 cultures with stable transfection of the 10 individual SFB‐GPD2 Phosphosite mutants. G, WB of U‐87 cultures with stable transfection of WT SFB‐GPD2, mutant SFB‐GPD2‐T10A, or mutant SFB‐GPD2‐T10D. H, Immunoprecipitation (IP) from U‐87 cells co–cultured with M2 or THP‐1 cells. n = 3 technical replicates × 3 biological replicates. I and J, Orthotopic GL261 gliomas generated in C57BL/6 mice by intracranial injection. Animals were given anti–colony stimulating factor 1 receptor or control IgG2a antibodies (n = 9 animals per cohort) and killed 14 d post–implantation. I, Left top panel: Typical H&E‐stained brain tumor tissue sections; Left bottom panel: Magnified (100×) image of tumor boundary; Right panel: Quantification of tumor size (V) by length (l) and width (w) determined by V = 0.5 × l × w2; n = 9. J, Left panel: Typical IHC‐stained brain tumor tissue sections for GPD2 pT10; Right panel: Semi‐quantification of GPD2 pT10 staining using scores ranging from 0 to 8; n = 9. K, IP from U‐87 cells co–cultured for 24 h with/without patient‐derived CD11b+/CD163+ tumor‐associated macrophages (TAM). *P < 0.05, **P < 0.01 (t test). Means ± standard errors of the mean (SEM). Please refer to Figure S1 for further details
3.2. Macrophages stimulate glycerol‐3‐phosphate dehydrogenase activation by phosphorylation at T10
To elucidate the mechanism for macrophage‐stimulated cancer cell proliferation via GPD2, we initially assessed GPD2 protein levels in U‐87 cells upon co–culturing with THP‐1 or M2 cells and found them to be unchanged (Figure S1E). Protein phosphorylation is a key post–translational modification (PTM) for regulating enzyme function. 14 Consequently, we assessed whether M2 macrophages controlled GPD2 activation by phosphorylation. To do this, we generated U‐87 and U‐251 cell lines with stable expression of a streptavidin‐binding peptide (SBP)‐tagged and FLAG‐tagged (both tags together called SFB) wild‐type (WT) GPD2 expressed to a much lesser extent than native GPD2 (Figure 1C). Co–culturing with M2 cells selectively enhanced phosphorylation at GPD2’s threonine residues (Figure 1D). Phosphorylation selectivity was confirmed by incubation with calf‐intestinal alkaline phosphatase (Figure S1F).
We used PhosphoSitePlus, a database of protein PTM, to query conserved GPD2 threonine residues that are phosphorylated, and found 10 conserved threonine residues: T10, T275, T290, T294, T355, T357, T359, T362, T515 and T547. A GPD2 mutant in which all 10 phosphorylated threonines were changed to alanine residues was created (GPD2‐MUT10). Threonine phosphorylation was blocked in U‐87 and U‐251 cultures expressing GPD2‐MUT10 (Figure 1E and Figure S1G). We sought to determine which threonine residue(s) were affected by M2 macrophage exposure. Ten GPD2 mutants in which one of each possible phosphorylated threonine was changed to alanine residue were created (GPD2‐T10A, GPD2‐T1275A, GPD2‐T290A etc). Threonine phosphorylation was only profoundly blocked in M2 macrophage‐exposed U‐87 and U‐251 cultures expressing GPD2‐T10A (Figure 1F and Figure S1H). We produced a selective antibody for GPD2 phosphorylated at T10 (GPD2 pT10), which reliably demonstrated phosphorylation of WT GPD2 but not of GPD2‐T10A. The antibody also bound to GPD2‐T10D, a phosphomimetic of GPD2 pT10, which functioned as a positive control (Figure 1G). Immunoprecipitation of native GPD2 from U‐87 or U‐251 cells co–cultured with M2 cells demonstrated increased formation of GPD2 pT10 (Figure 1H and Figure S1I).
We determined whether macrophages activated GPD2 in tumor cells in vivo in orthotopic models of mouse glioma GL261 cells. As M2 macrophage function is heavily influenced by colony stimulating factor 1 receptor (CSF1R) expression, an antibody against CSF1R is frequently used to neutralize macrophages. 15 , 16 The blood‐brain barrier (BBB) in murine glioma models is compromised by degradation of endothelial tight junctions. 17 , 18 , 19 Thus, antibodies are anticipated to penetrate the leaky BBB. We depleted macrophages from the TME through administration of anti–CSF1R or control IgG2a antibodies to mice with orthotopic GL261 gliomas. Immunohistochemistry (IHC) for CD163 was used to confirm macrophage neutralization upon anti–CSF1R antibody administration (Figure S1K). GL261 tumor growth was measured at the experimental endpoint, which demonstrated that macrophage neutralization significantly attenuated tumor growth (Figure 1I and Figure S1J) and GPD2 phosphorylation at T10 (Figure 1J). In addition, we dissociated patient‐derived glioblastoma (GBM) tumor tissue and used FACS to sort TAM by CD11b staining and M2 TAM by CD163 staining. We generated co–cultures of these isolated CD11b+/CD163+ M2 cells with U‐87 or U‐251 cells and noted, using western blot analysis, that GPD2 pT10 levels increased (Figure 1K and Figure S1L).
3.3. Macrophage‐induced glycerol‐3‐phosphate dehydrogenase phosphorylation at T10 regulates the direction of glycerol‐3‐phosphate dehydrogenase catalysis
The G3P shuttle, constituted by the rate‐limiting enzyme GPD2 and its counterpart GPD1, regulates the conversion between G3P and DHAP (G3P ↔ DHAP). We questioned whether phosphorylation of GPD2 T10 influences the reaction rates in favor of DHAP or G3P. In vitro, endogenous GPD2 was knocked down in U‐87 and U‐251 cultures and replaced by histidine‐biotin (HB)‐tagged WT GPD2, mutant GPD2‐T10A, or mutant GPD2‐T10D, whose coding DNA sequences were resistant to shRNA‐mediated degradation (Figure 2A). The maximum reaction rate (Vmax) for generation of DHAP was in the order GPD2‐T10D > WT GPD2 > GPD2‐T10A (Figure 2B), whereas Vmax for G3P was in the reverse order (Figure 2C).
Figure 2.
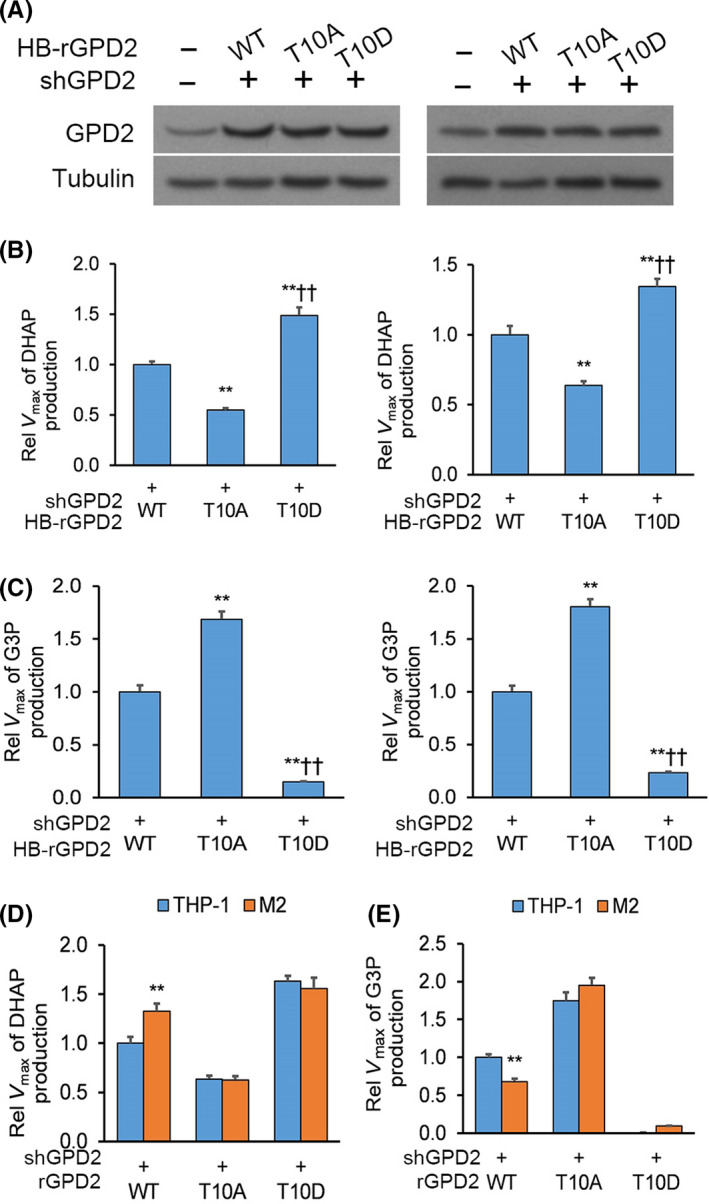
Macrophage‐induced glycerol‐3‐phosphate dehydrogenase (GPD2) phosphorylation at T10 regulates the direction of GPD2 catalysis. A, Western blot (WB) of U‐87 and U‐251 cultures with native GPD2 knockdown reconstituted with expression of histidine‐biotin (HB)‐tagged wild‐type (WT) GPD2, mutant GPD2‐T10A or mutant GPD2‐T10D whose DNA sequences were resistant to shRNA‐mediated degradation. B and C, Native GPD2 knockdown from U‐87 and U‐251 cultures was reconstituted with expression of histidine‐biotin (HB)‐tagged WT GPD2, mutant GPD2‐T10A, or mutant GPD2‐T10D whose DNA sequences were resistant to shRNA‐mediated degradation followed by pull‐down assay (PD) with streptavidin beads: (B) Maximum reaction rate (Vmax) for generation of dihydroxyacetone phosphate (DHAP) and (C) Vmax for generation of G3P. D and E, Reconstituted U‐87 cultures from (B) were co–cultured for 24 h with M2 or THP‐1 cells and pull‐down assay (PD) with streptavidin beads: (D) Vmax for generation of DHAP and (E) Vmax for generation of G3P. *P < 0.05, **P < 0.01 (t test). n = 3 technical replicates × 3 biological replicates. Means ± standard errors of the mean (SEM)
To assess whether M2 macrophages controlled GPD2 catalysis direction by phosphorylating T10, U‐87 cultures with native GPD2 knockdown and reconstituted HB‐tagged shRNA‐resistant WT GPD2, mutant GPD2‐T10A or mutant GPD2‐T10D were co–cultured with M2 or THP‐1 cells. Vmax for generation of DHAP was enhanced in WT GPD2‐, stable in GPD2‐T10D‐ and lowered in GPD2‐T10A‐expressing U‐87 cultures upon co–culturing with M2 cells (Figure 2D). In contrast, Vmax for generation of G3P was lowered in WT GPD2‐, stable in GPD2‐T10D‐ and enhanced in GPD2‐T10A‐expressing U‐87 cultures upon co–culturing with M2 cells (Figure 2E). These findings suggest that M2 macrophages activate GPD2 by phosphorylating T10 and stimulating DHAP production.
3.4. Glycerol‐3‐phosphate dehydrogenase phosphorylation at T10 is mediated by protein kinase‐delta
We sought to recognize the upstream mediator of GPD2 phosphorylation. We searched for a kinase recognition motif on GPD2, which identified the protein kinase C delta isoform (PKCδ) recognition motif targeting the T10 residue (Figure 3A). To verify a potential interaction between GPD2 and PKCδ, U‐87 cultures underwent co–transfection of V5‐conjugated PKCδ with FLAG‐conjugated GPD2 (FLAG‐GPD2) or empty plasmid (EP). Anti–FLAG and anti–GPD2 immunoprecipitation demonstrated a direct interaction between PKCδ and GPD2 in both the overexpression system and between endogenous proteins, respectively (Figure 3B). Overexpression of an inactive kinase‐dead PKCδ (PKCδ K376R; Figure S2) or knockdown of PKCδ in U‐87 cultures significantly lowered phosphorylated GPD2 pT10 (Figure 3C,D). Finally, we also conducted in vitro 32P‐labeling assays between recombinant His‐PKCδ (His = His x6 tag) and WT His‐GPD2 or mutant His‐GPD2‐T10A. PKCδ phosphorylated WT GPD2 but not the mutant GPD2‐T10A (Figure 3E).
Figure 3.
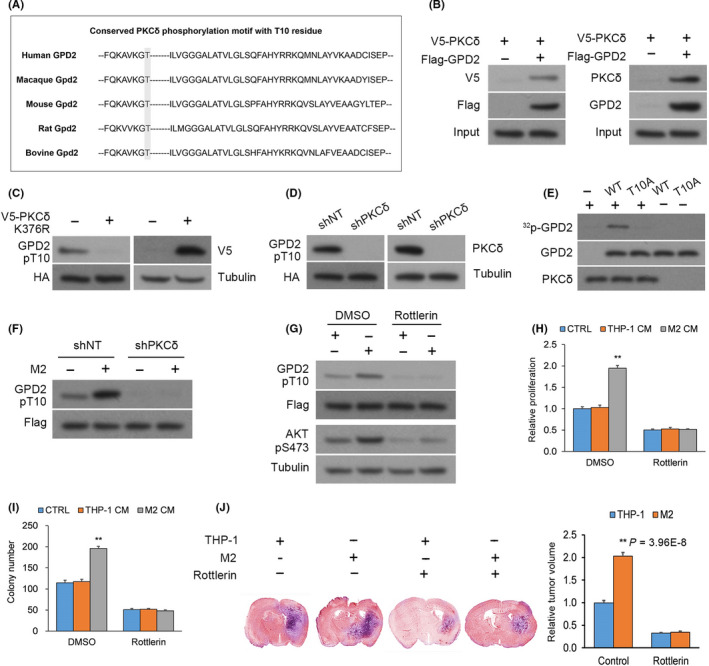
Glycerol‐3‐phosphate dehydrogenase (GPD2) phosphorylation at T10 is mediated by PKCδ. A, The conserved PKCδ phosphorylation motif residing around the T10 residue of GPD2. B, Left panel: Anti–FLAG immunoprecipitation (IP) from U‐87 cultures that underwent co–transfection of V5‐PKCδ with FLAG‐GPD2 or empty plasmid (EP); Right panel: Native anti–GPD2 IP from U‐87 cultures. C, U‐87 cultures with stable transfection of histidine‐biotin (HB)‐GPD2 and transient transfection of kinase‐dead V5‐PKCδ‐KD or EP. D, U‐87 cultures with stable transfection of HB‐GPD2 and lentiviral shPKCδ or scrambled control (shNT). E, In vitro 32P‐labeling assays between recombinant His‐PKCδ (His = His x6 tag) and wild‐type (WT) His‐GPD2‐T10 or mutant His‐GPD2‐T10A. F, U‐87 cells with stable transfection of S‐FLAG‐streptavidin‐binding peptide (SFB)‐GPD2 and lentiviral shPKCδ or shNT co–cultured for 24 h with M2 or THP‐1 cells. G, U‐87 cells with stable transfection of SFB‐GPD2 cultured with/without PKCδ inhibitor rottlerin in M2‐derived or THP‐1‐derived conditioned media (CM). H, Cellular proliferation and (I) colony forming assays in U‐87 cells with stable transfection of SFB‐GPD2 cultured with/without PKCδ inhibitor rottlerin in control media or M2‐derived or THP‐1‐derived CM. n = 3 technical replicates × 3 biological replicates. J, Orthotopic EGFRvIII‐expressing U‐87 gliomas with M2 or THP‐1 cells (1:1) generated in nude mice by intracranial injection. Animals were administered rottlerin or vehicle (n = 9 animals per cohort) and killed 14 d post–implantation; n = 9. *P < 0.05, **P < 0.01 (t test). Means ± standard errors of the mean (SEM). Please refer to Figure S2 for further details
We sought to determine whether macrophage‐stimulated activation of GPD2 at T10 occurs through PKCδ. PKCδ was knocked down from U‐87 cultures with stable transfection of SFB‐GPD2, which were co–cultured with M2 or THP‐1 cells. PKCδ knockdown markedly attenuated M2‐elicited enhancement in GPD2 phosphorylation at T10 (Figure 3F), an effect also seen by incubation with rottlerin, a specific inhibitor of PKCδ (Figure 3G).
Because macrophages stimulated tumor cell proliferation via GPD2, we determined whether this effect was mediated through PKCδ. U‐87 cells with/without rottlerin were cultured in control media or M2‐derived or THP‐1‐derived conditioned media (CM); rottlerin blocked M2 cell CM‐triggered cellular proliferation and colony forming capacity (Figure 3H,I). In vivo, we generated orthotopic implants in nude mice by intracranial injection of U‐87 cells expressing a constitutively active PKCδ‐activating EGFRvIII mutant 20 , 21 with M2 or THP‐1 cells in a 1:1 ratio. Animals were randomly assigned rottlerin or vehicle administration (n = 9 animals per cohort) by oral gavage, and tumor sizes were measured 14 days post–glioma cell implantation. Co–injection of M2 macrophages increased tumor size, an effect blocked by rottlerin administration (Figure 3J). Overall, in vitro and in vivo data demonstrate that macrophage‐stimulated GPD2 activation at T10 is mediated by PKCδ.
3.5. Macrophage‐stimulated impact on cancer cell glycolytic metabolism, cellular proliferation and gliomagenesis is mediated by glycerol‐3‐phosphate dehydrogenase phosphorylation at T10
Glycerol‐3‐phosphate dehydrogenase is a key enzyme supporting glycolysis, 12 and M2 macrophages stimulate glycolytic metabolism in glioma cells. 20 Because we determined that M2 macrophages influenced GPD2 T10 phosphorylation, we sought to determine whether the macrophage‐induced increase in glycolysis in glioma cells was dependent on phosphorylation at T10 of GPD2. We knocked down GPD2 from U‐87 and U‐251 cultures and reconstituted them with WT GPD2, mutant GPD2‐T10A, or mutant GPD2‐T10D (Figure 3A), followed by co–culturing in M2‐derived or THP‐1‐derived CM. THP‐1‐derived and M2 cell‐derived conditioned media (CM) had the same concentration of lactate and glucose (Figure S3A). The M2 CM‐induced increase in lactate release and glucose uptake in glioma cells was blocked when they expressed mutant GPD2‐T10A (Figure 4A and Figure S3B), whereas glioma cells that expressed the phosphomimic GPD2‐T10D had increased lactate release and glucose uptake with/without M2 CM (Figure S3C). Under these M2 CM conditions, the expression levels of activated PKCδ pT505 and the GPD2‐PKCδ interaction were both enhanced (Figure S3D). Extracellular acidification rate (ECAR) experiments were also performed on U‐87 cultures with GPD2 knockdown reconstituted with WT GPD2, mutant GPD2‐T10A, or mutant GPD2‐T10D. The M2 CM‐induced rise in lactate release and glucose uptake in glioma cells was blocked when they expressed mutant GPD2‐T10A (Figure 4B), whereas glioma cells that expressed GPD2‐T10D had increased lactate release and glucose uptake with/without M2 CM (Figure S3E). We expressed inactive kinase‐dead PKCδ K376R in U‐87 cultures incubated in M2‐derived or THP‐1‐derived CM to assess whether PKCδ was necessary for macrophage‐stimulated increase in glycolytic metabolism (Figure S3F). Indeed, U‐87 glioma cells expressing PKCδ K376R did not experience M2 CM‐induced enhancement in glycolysis compared to cells expressing WT PKCδ (Figure S3G).
Figure 4.
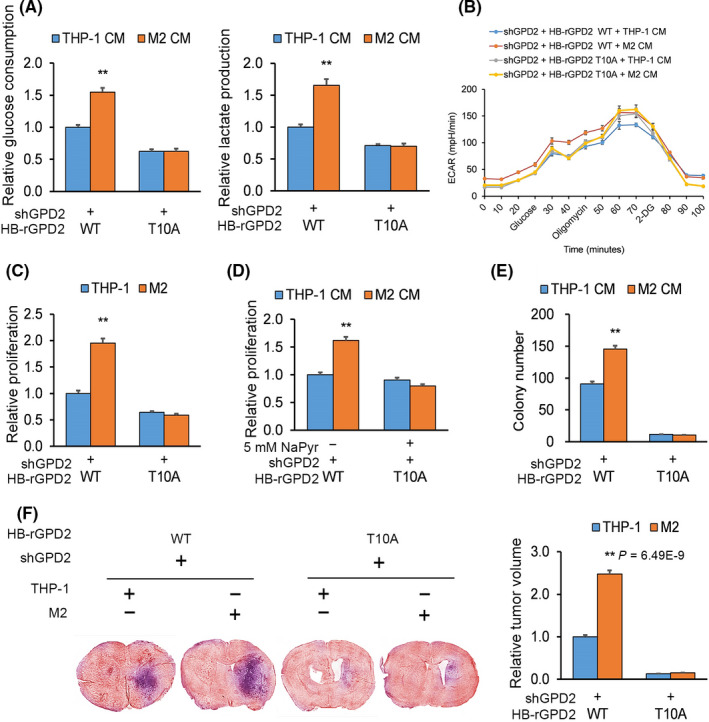
Macrophage‐stimulated impact on cancer cell glycolytic metabolism, cellular proliferation and gliomagenesis is mediated by glycerol‐3‐phosphate dehydrogenase (GPD2) phosphorylation at T10. A and B, U‐87 cultures with GPD2 knockdown were reconstituted with wild‐type (WT) histidine‐biotin (HB)‐GPD2 or mutant HB‐GPD2‐T10A and incubated for 20 h in M2‐derived or THP‐1‐derived conditioned media (CM): (A) Lactate release and glucose uptake at the experiment endpoint and (B) glycolytic metabolism quantified by extracellular acidification rate (ECAR) in real‐time. C, Proliferation by crystal violet of co–cultures of cells from (A) with M2 or THP‐1 cells after 7 d. D, Proliferation by crystal violet of cells from (A) with M2‐derived or THP‐1‐derived CM with/without sodium pyruvate (5 mmol/L) after 7 d. E, Colony forming by soft agar assay of cells from (A) in M2‐derived or THP‐1‐derived CM. n = 3 technical replicates × 3 biological replicates. F, Cells from (A) were transduced with lentiviral constructs and prepared with M2 or THP‐1 cells in a 1:1 ratio (n = 9 animals per cohort), orthotopically implanted into nude mice, which were killed 30 d post–implantation; n = 9. *P < 0.05, **P < 0.01 (t test). Means ± standard errors of the mean (SEM). Please refer to Figures S3 and S4 for further details
We sought to determine the effect of M2 CM on glioma proliferation. Again, U‐87 cultures with GPD2 knockdown were reconstituted with WT GPD2, mutant GPD2‐T10A, or mutant GPD2‐T10D followed by co–culturing with M2 or THP‐1 cells. The M2 CM‐induced increase in glioma proliferation was blocked when they expressed mutant GPD2‐T10A (Figure 4C and Figure S4A), whereas glioma cells that expressed GPD2‐T10D had increased proliferation with/without M2 CM (Figure S4B). Importantly, glioma cells expressing mutant GPD2‐T10A exhibited a lower baseline of proliferation, which we could rescue by supplementation with sodium pyruvate (Figure S4C). However, M2 CM still could not stimulate proliferation of U‐87 cells expressing mutant GPD2‐T10A compared to WT GPD2 when supplemented with sodium pyruvate (5 mmol/L) (Figure 4D). Although pyruvate could rescue proliferation of GPD2‐T10A expressing glioma cells, this does not rule out the prospect that blocking phosphorylation at T10 can affect glioma cells in other ways that could make them insensitive to macrophage‐induced stimulation. As for cellular proliferation, the M2 CM‐induced increase in glioma colony forming was blocked when they expressed mutant GPD2‐T10A (Figure 4E), whereas glioma cells that expressed GPD2‐T10D had increased colony forming capacity with/without M2 CM (Figure S4D).
We examined the impact of macrophage‐stimulated activation of GPD2 on tumorigenesis in vivo. U‐87 cells with GPD2 knockdown were reconstituted with WT GPD2, mutant GPD2‐T10A or mutant GPD2‐T10D lentiviral constructs with luciferase expression, which was expressed to the same level in all cell lines (Figure S4E). Each of these U‐87 glioma cell lines was mixed with M2 or THP‐1 cells in a 1:1 ratio and orthotopically implanted into nude mice. M2 macrophages did not enhance tumor progression when the implanted U‐87 glioma cells expressed mutant GPD2‐T10A (Figure 4F), whereas implantation of glioma cells that expressed GPD2‐T10D had enhanced tumor progression with/without co–implantation of M2 macrophages (Figure S4F). Cumulatively, the body of experiments demonstrate that macrophage‐stimulated glycolytic metabolism, cellular proliferation, and tumorigenesis is mediated by phosphorylating GPD2 at T10.
3.6. Macrophage‐stimulated cancer cell glycolytic metabolism, cellular proliferation and gliomagenesis dependent on interleukin‐1β
Tumor‐associated macrophages release a suite of pro–inflammatory cytokines and chemokines that stimulate cancer cell proliferation, migration and neoangiogenesis, thereby promoting tumorigenesis. 22 Of particular interest to our study are IL‐1β, IL‐6 and transforming growth factor β (TGFβ) because they trigger activation of PKCδ. 23 , 24 , 25 Indeed, polarized M2 cells exhibit enhanced levels of IL‐1β, IL‐6 and TGFβ (and their respective downstream targets) compared to THP‐1 cells. 20
Only IL‐1β dose‐dependently enhanced GPD2 phosphorylation at T10 and strengthened the GPD2‐PKCδ interaction (Figure 5A and Figure S5A). In addition, epidermal growth factor but not hypoxic conditions enhanced GPD2 pT10 activation (Figure S5B). Next, we knocked down native PKCδ from U‐87 cultures having stable transfection of SFB‐GPD2, which resulted in a marked attenuation of IL‐1β‐triggered GPD2 pT10 activation (Figure 5B), implying that PKCδ is necessary for IL‐1β‐stimulated GPD2 pT10 activation. Co–cultures of U‐87 cells with THP‐1 or M2 cells with/without IL‐1β knockdown (Figure S5C) were established; knocking down IL‐1β from M2 cells did not impact their differentiation or CD163 transcript levels (Figure S5D). However, knocking down IL‐1β from M2 cells did substantially lower GPD2 pT10 activation (Figure 5C).
Figure 5.
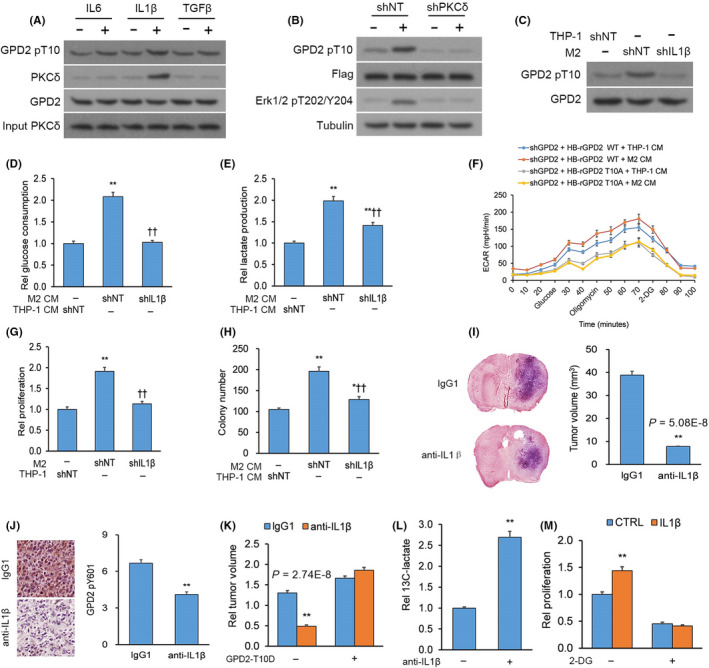
Macrophage‐stimulated cancer cell glycolytic metabolism, cellular proliferation and gliomagenesis is dependent on interleukin (IL)‐1β. A, Immunoprecipitation (IP) of glycerol‐3‐phosphate dehydrogenase (GPD2) using an anti–GPD2 antibody from U‐87 cultures incubated with/without the outline cytokines (10 ng/mL). B, U‐87 cultures with stable transfection of S‐FLAG‐streptavidin‐binding peptide (SFB)‐GPD2 and lentiviral shPKCδ or scrambled control (shNT) with/without IL‐1β for 30 min. C, U‐87 cultures with transfection of shIL‐1β or shNT co–cultured with M2 or THP‐1 cells. D‐F, U‐87 cultures with transfection of shIL‐1β or shNT incubated for 20 h in M2‐derived or THP‐1‐derived conditioned media (CM): (D) Glucose uptake, (E) lactate release, (F) glycolysis by ECAR and (G) proliferation of U‐87 cells with transfection of shIL‐1β or shNT co–cultured with M2 or THP‐1 cells. H, Colony forming by U‐87 cells with transfection of shIL‐1β or shNT incubated in M2‐derived or THP‐1‐derived CM. n = 3 technical replicates × 3 biological replicates. I and J, Orthotopic GL261 gliomas generated in C57BL/6 mice by intracranial injection. Animals were given anti–IL‐1β or control IgG1 antibodies (n = 9 animals per cohort) and killed 14 d post–implantation. I, Left top panel: Typical H&E‐stained brain tumor tissue sections; Left bottom panel: Magnified (100×) image of tumor boundary; Right panel: Quantification of tumor size (V) by length (l) and width (w) determined by V = 0.5 × l × w2; n = 9. J, Left panel: Typical IHC‐stained brain tumor tissue sections for GPD2 pT10; Right panel: Semi‐quantification of GPD2 pT10 levels; n = 9. K, Orthotopic gliomas generated from GL261 cells transduced with lentiviral constructs for mutant mouse GPD2‐T10D or empty plasmid (EP) and intracranially injected into C57BL/6 mice. Animals were administered anti–IL‐1β or control IgG1 antibodies (n = 9 animals per cohort) and killed 14 d post–implantation; n = 9. L, Gas chromatography‐mass spectrometry (GC‐MS) analysis of U‐87 cultures starved from glucose for 4 h and incubated for 16 h with/without IL‐1β (10 ng/mL) in media supplemented with 13C‐glucose. M, Proliferation of U‐87 cultured incubated in 2‐deoxy‐d‐glucose (1 mmol/L) followed for 7 d with/without IL‐β (10 ng/mL). *P < 0.05, **P < 0.01 (t test). n = 3 technical replicates × 3 biological replicates. Means ± standard errors of the mean (SEM). Please refer to Figure S5 for further details
Once we had established that IL‐1β release from M2 macrophages stimulated GPD2 phosphorylation at T10, we next sought to test whether IL‐1β release was necessary in metabolic reprogramming of glioma cells toward glycolysis. U‐87 cultures were incubated in CM from THP‐1 or M2 cells with/without IL‐1β knockdown; CM derived from M2 cells with IL‐1β knockdown did not trigger increases in lactate release, glucose uptake and ECAR as it did in glioma cells incubated in CM from IL‐1β‐expressing M2 cells (Figure 5D‐F). A similar effect was seen on glioma cell proliferation and colony forming capacity; CM derived from M2 cells with IL‐1β knockdown did not trigger increases in proliferation and colony forming as it did in glioma cells incubated in CM from IL‐1β‐expressing M2 cells (Figure 5G,H). To assess the impact of IL‐1β in vivo on glioma tumorigenesis, we generated orthotopic GL261 gliomas in mice, which were administered anti–IL‐1β or control IgG1 antibody. Tumor size was lower in mice whose IL‐1β was depleted (Figure 5I and Figure S5E). We confirmed the efficacy of IL‐1β depletion by IHC of its downstream target ERK1/2 pT202/Y204 in brain tissue (Figure S5F). We also noted by IHC that IL‐1β depletion by anti–IL‐1β antibody treatment blocked phosphorylation of GPD2 at T10 in comparison to IgG1 control antibody treatment (Figure 5J). When we generated orthotopic gliomas of GL261 cells expressing the phosphomimic GPD2‐T10D (Figure S5G) followed by administration of anti–IL‐1β or control IgG1 antibody, GPD2‐T10D opposed the smaller tumor size induced by IL‐1β depletion (Figure 5K). Furthermore, orthotopic gliomas of U‐87 cells co–injected with M2 macrophages with/without IL‐1β knockdown were generated; again, tumors were smaller in mice co–injected with M2 macrophages with IL‐1β knockdown (Figure S5H). Overall, the body of experiments advocate IL‐1β release from M2 macrophages as the stimulant for GPD2 pT10 activation, inducing a shift in glioma cells to glycolytic metabolism, increased cellular proliferation and enhancement of tumorigenesis.
Additional evidence for the impact of IL‐1β release on glioma cell glycolytic metabolism and proliferation was provided from tracing experiments using 13C‐labeled glucose. Glucose‐deprived U‐87 cultures were incubated in media with/without IL‐1β and supplemented with 13C‐labeled glucose; IL‐1β treatment boosted release of 13C‐lactate via glycolytic metabolism (Figure S5I and Figure 5L). In addition, U‐87 cultures were incubated in media with/without IL‐1β and complemented with 2‐deoxy‐d‐glucose (2‐DG), a blocker of glycolysis; 2‐DG hindered the IL‐1β‐stimulated effect on cellular proliferation (Figure 5M), implicating IL‐1β as a regulator of cancer cell proliferation via glycolytic metabolism.
Interleukin‐1β activates the intracellular kinase phosphatidylinositol‐3‐kinase (PI3K), 26 which catalyzes generation of the membrane phospholipid phosphatidylinositol (3,4,5)‐trisphosphate (PIP3). 27 Because PKCδ is phosphorylated at T505 by PIP3, 28 we examined whether PI3K activity was involved in facilitating the effect of IL‐1β on the PKCδ‐GPD2 interaction. Towards this end, U‐87 cultures underwent co–transfection of FLAG‐GPD2 with/without V5‐PKCδ followed by incubation with the selective PI3K inhibitor LY294002. Inhibition of PI3K reduced the phosphorylation of PKCδ pT505’s downstream target AKT pS473 (Figure S5K). 29 Moreover, treating U‐87 cells with LY294002 fully blocked the GPD2‐PKCδ interaction (Figure S5J). These findings indicate that PI3K serves as a key intermediary between upstream IL‐1β stimulation and the downstream PKCδ‐GPD2 interaction in glioma cells.
3.7. Increased glycerol‐3‐phosphate dehydrogenase pT10 levels are associated with macrophage recruitment, tumor grade and patient survival in glioblastoma
We sought to establish whether our in vitro and animal model studies had relevance to clinical GBM samples. IHC on sections from patient‐derived WHO grade IV GBM tumors (n = 30) were stained with antibodies against GPD2 pT10, PKCδ pT505, CD163 and IL‐1β (Figure 6A), whose specificity we confirmed by blocking assays with/without the analogous proteins or peptides. Semi‐quantitative analysis demonstrated a positive association between GPD2 pT10 protein levels (representative of glycolysis) and: (a) PKCδ pT505 staining, (b) CD163 staining (representative of macrophage recruitment), and (c) IL‐1β staining (Figure 6B).
Figure 6.
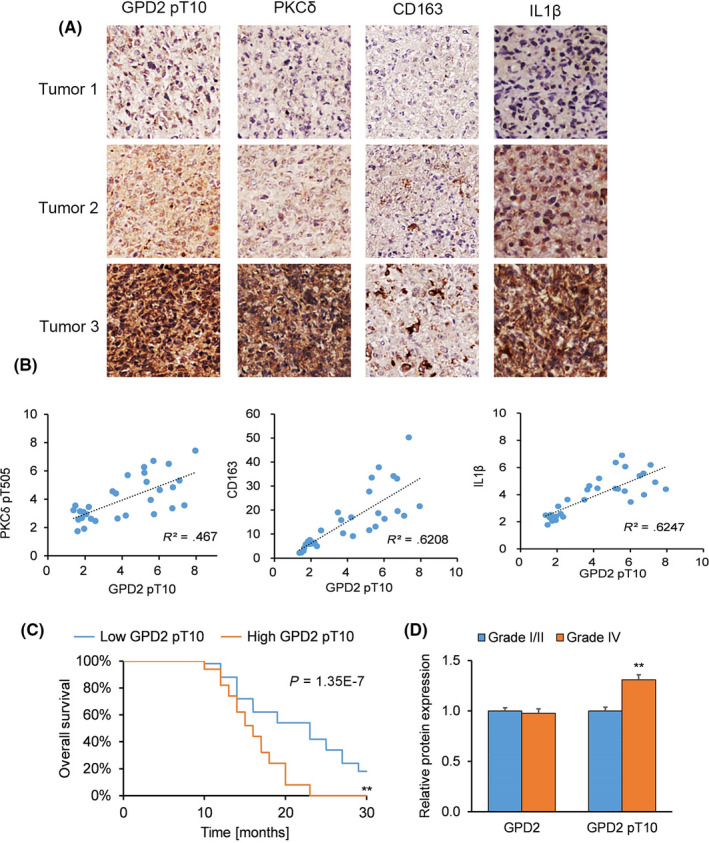
Increased p‐glycerol‐3‐phosphate dehydrogenase (GPD2) levels are associated with macrophage recruitment, tumor grade and patient survival in glioblastoma (GBM). A and B, Immunohistochemistry (IHC) on sections from patient‐derived grade IV GBM tumors (n = 30 randomly‐selected from 100 tumors) stained with antibodies against GPD2 pT10, PKCδ pT505, CD163 and IL‐1β: (A) IHC images on sections from representative patient‐derived GBM tumors and (B) Pearson’s correlation analyses of semi‐quantified GPD2 pT10, CD163 and IL‐1β expression on a scale ranging from 0 to 8. C, Kaplan‐Meier survival curve for GBM patients with below‐median (low, n = 50) and above‐median (high, n = 50) GPD2 pT10 levels. D, Semi‐quantified IHC staining of GPD2 and GPD2 pT10 expression on sections from patient‐derived grade I/II astrocytoma tumors (n = 30) and grade IV GBM tumors (n = 30). *P < 0.05, **P < 0.01 (t test). Means ± standard errors of the mean (SEM)
We generated a Kaplan‐Meier survival curve for GBM patients (n = 100) who had undergone surgical resection followed by standard adjuvant radiotherapy and alkylating agent therapy, usually temozolomide. When patients were stratified by low versus high GPD2 pT10 levels, patient survival was better with lower GPD2 pT10 levels (Figure 6C). When patients were stratified by tumor grade, patient‐derived grade IV tumors exhibited higher levels of GPD2 pT10 (but not GPD2 levels) compared to grade I/II tumors (Figure 6D). This analysis of patient‐derived tumors demonstrates the clinical significance of GPD2 pT10, whose elevated levels correlated with unfavorable patient outcomes and higher tumor grade.
4. DISCUSSION
Although reprogramming of cellular metabolism by tumor cells is a well‐established survival mechanism, 7 , 8 , 9 the impact of tumor‐infiltrating TAM on cancer cell metabolism is a less investigated avenue. We performed a detailed examination of the role of TAM‐stimulated activation of GPD2 in glioma cells via PKCδ, which induces a shift to glycolytic metabolism and bolsters tumor cell proliferation and tumorigenesis (Figure 7). These results uncover a previously unknown mechanism of TAM‐promoted tumor development via GPD2 phosphorylation and advocate interruption of this pathway as a possible anticancer strategy.
Figure 7.
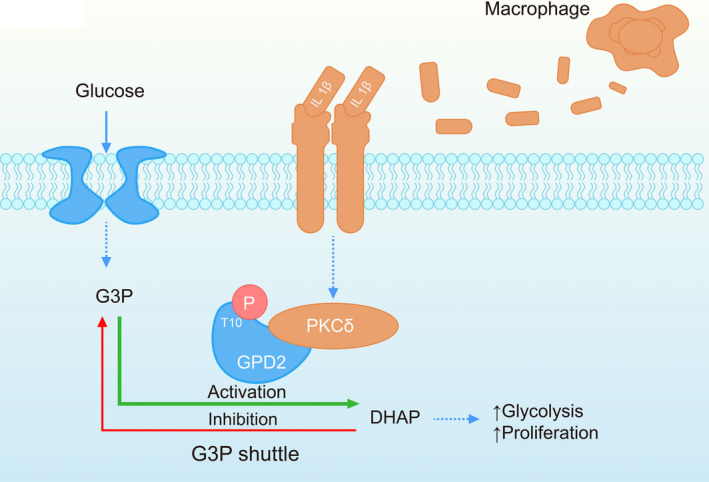
Proposed molecular pathway for tumor‐associated macrophage (TAM)‐stimulated glycerol‐3‐phosphate dehydrogenase (GPD2) activation in glioma cells. TAM release interleukin (IL)‐1β, which triggers phosphorylation of GPD2 at T10 in glioma cells via PKCδ. This action induces a shift to glycolytic metabolism, which stimulates cellular proliferation and gliomagenesis
The evidence supporting the role of TAM IL‐1β release in cancer development is manifold. Elevated tumor IL‐1β levels are associated with inferior prognoses in breast cancer patients, and IL‐1β promotes tumor growth and metastasis in animal models of breast cancer. 30 , 31 , 32 , 33 Moreover, IL‐1β contributes to carcinogen–induced melanoma development. 34 Although IL‐1β may directly act on epithelial or tumor cells to promote their proliferation and invasiveness, 33 the mechanism(s) by which IL‐1β would act have not been thoroughly investigated. Our evidence reveals that IL‐1β release is a necessary component of the macrophage‐stimulated effect on GPD2 phosphorylation, glycolytic metabolism and proliferation of glioma cells. This is accomplished by phosphorylation of PKCδ at its T505 residue. PKCδ is a member of the protein kinase C (PKC) family that regulates various cell processes, including proliferation, differentiation and apoptosis, 35 , 36 , 37 , 38 and has been associated with both tumor progression as 39 , 40 well as tumor suppression. 41 , 42 , 43 Consistent with our findings, PKCδ T505 is preferentially activated in GBM tumor‐initiating cells and promotes tumorigenic AKT signaling through phosphorylating AKT at its S473 residue. Moreover, PKCδ T505 is positively regulated by an autocrine loop in GBM tumor‐initiating cells driven by PKCδ‐mediated secretion of cytokines IL‐1α and IL‐23. Therefore, it is possible that PKCδ T505 may participate in a positive feedback autocrine loop in glioma cells that reinforces cytokine‐driven PKCδ T505 activation. Further research on this question is needed.
Enzyme activity can be modulated by PTM, most commonly by phosphorylation. Herein, we recognized a novel site for phosphorylating GPD2 at T10 through a series of mutagenesis studies. We further demonstrated that macrophages increased activation of GPD2 at T10, altering its substrate affinity with preferential conversion of G3P to DHAP, a shift to glycolytic catalysis, and thereby to glioma cellular proliferation. Glycolytic metabolism consists of glucose catabolism, although several steps along the path can occur in the opposite direction to regenerate glucose, a process known as gluconeogenesis. 44 GPD2 lowers G3P levels in hepatocytes, promotes a reduced mitochondrial NADH/NAD redox state, decreases ketone body production, and increases pyruvate and lactate production, but it does not affect gluconeogenesis. 45 These combined findings indicate that GPD2 promotes pro–proliferative glycolytic activity.
Patient‐derived GBM tumors are often infiltrated with macrophages, which is correlated with faster GBM development of GBM. 44 In agreement with that, we observed that GPD2 pT10 levels were positively associated with macrophage recruitment (CD163 staining) in patient‐derived GBM, as well as with tumor grade and patient survival. The clinical relevance of GPD2 pT10 in patient samples implicates it as a possible treatment avenue by blocking macrophage‐stimulated GPD2 activation.
A small population of stem cell‐like malignant cells termed brain tumor‐initiating cells (BTIC) are at the top of the brain tumor’s cellular hierarchy and produce the bulk of a brain tumor’s mass. 46 These BTIC are also strongly associated with brain tumorigenesis, chemoresistance and tumor recurrence. 46 Therefore, recent glioma‐related studies have preferentially employed BTIC selection (via markers such as CD133 and CD44), special culture conditions and sphere formation assays to specifically select for and investigate these BTIC. 46 As our study was limited to the U‐87 and U‐251 glioma cell lines, we did not investigate the effects of TAM‐based IL‐1β release on BTIC. Given the importance of BTIC in brain tumorigenesis, researchers should pursue an investigation along these lines.
In conclusion, we outline evidence that IL‐1β release by TAM restructures glioma cell metabolism by PKCδ activation of GPD2 to favor glycolysis, which accelerates proliferation and tumor growth. More broadly, our findings support that TAM can promote tumorigenesis through metabolic reprogramming.
DISCLOSURE
The authors declare that they have no competing interests.
Supporting information
Supplementary Material
ACKNOWLEDGMENTS
This work was supported by the National Natural Science Foundation of China (grant no. 81471676), the Chongqing Natural Science Foundation of China (grant no. cstc2014jcyjA10050), the Chongqing Health Bureau Traditional Chinese Medicine Science Foundation of China (grant no. ZY20132103) and the Chongqing Health Bureau Science Foundation of China (grant no. 2012‐2‐065).
Lu J, Xu Z, Duan H, et al. Tumor‐associated macrophage interleukin‐β promotes glycerol‐3‐phosphate dehydrogenase activation, glycolysis and tumorigenesis in glioma cells. Cancer Sci. 2020;111:1979–1990. 10.1111/cas.14408
REFERENCES
- 1. Domingues P, González‐Tablas M, Otero Á, et al. Tumor infiltrating immune cells in gliomas and meningiomas. Brain Behav Immun. 2016;53:1‐15. [DOI] [PubMed] [Google Scholar]
- 2. Mirghorbani M, Van Gool S, Rezaei N. Myeloid‐derived suppressor cells in glioma. Expert Rev Neurother. 2013;13:1395‐1406. [DOI] [PubMed] [Google Scholar]
- 3. Joyce JA, Fearon DT. T cell exclusion, immune privilege, and the tumor microenvironment. Science. 2015;348:74‐80. [DOI] [PubMed] [Google Scholar]
- 4. Spill F, Reynolds DS, Kamm RD, Zaman MH. Impact of the physical microenvironment on tumor progression and metastasis. Curr Opin Biotechnol. 2016;40:41‐48. [DOI] [PMC free article] [PubMed] [Google Scholar]
- 5. Qian B‐Z, Pollard JW. Macrophage diversity enhances tumor progression and metastasis. Cell. 2010;141:39‐51. [DOI] [PMC free article] [PubMed] [Google Scholar]
- 6. Caux C, Ramos RN, Prendergast GC, Bendriss‐Vermare N, Ménétrier‐Caux C. A milestone review on how macrophages affect tumor growth. Cancer Res. 2016;76:6439‐6442. [DOI] [PubMed] [Google Scholar]
- 7. Hanahan D, Weinberg RA. Hallmarks of cancer: the next generation. Cell. 2011;144:646‐674. [DOI] [PubMed] [Google Scholar]
- 8. Ward PS, Thompson CB. Metabolic reprogramming: a cancer hallmark even warburg did not anticipate. Cancer Cell. 2012;21:297‐308. [DOI] [PMC free article] [PubMed] [Google Scholar]
- 9. Justus C, Sanderlin E, Yang L. Molecular connections between cancer cell metabolism and the tumor microenvironment. Int J Mol Sci. 2015;16:11055‐11086. [DOI] [PMC free article] [PubMed] [Google Scholar]
- 10. Cairns RA, Harris IS, Mak TW. Regulation of cancer cell metabolism. Nat Rev Cancer. 2011;11:85. [DOI] [PubMed] [Google Scholar]
- 11. Justus CR, Dong L, Yang LV. Acidic tumor microenvironment and pH‐sensing G protein‐coupled receptors. Front Physiol. 2013;4:354. [DOI] [PMC free article] [PubMed] [Google Scholar]
- 12. Paschos A, Laflamme P, Singh G. The mitochondrial FAD‐linked glycerol‐3‐phosphate dehydrogenase as an inhibitory target for cancer therapeutics. AACR. 2010;70:3694–3694. [Google Scholar]
- 13. Bauer L, Venz S, Junker H, Brandt R, Radons J. Nicotinamide phosphoribosyltransferase and prostaglandin H2 synthase 2 are up‐regulated in human pancreatic adenocarcinoma cells after stimulation with interleukin‐1. Int J Oncol. 2009;35:97‐107. [DOI] [PubMed] [Google Scholar]
- 14. Oliveira AP, Sauer U. The importance of post‐translational modifications in regulating Saccharomyces cerevisiae metabolism. FEMS Yeast Res. 2012;12:104‐117. [DOI] [PubMed] [Google Scholar]
- 15. Quail DF, Bowman RL, Akkari L, et al. The tumor microenvironment underlies acquired resistance to CSF‐1R inhibition in gliomas. Science. 2016;352:aad3018. [DOI] [PMC free article] [PubMed] [Google Scholar]
- 16. Ries C, Cannarile M, Hoves S, et al. Targeting tumor‐associated macrophages with anti–CSF‐1R antibody reveals a strategy for cancer therapy. Cancer Cell. 2014;25:846‐859. [DOI] [PubMed] [Google Scholar]
- 17. Garcia C, Dubois LG, Xavier AL, et al. The orthotopic xenotransplant of human glioblastoma successfully recapitulates glioblastoma‐microenvironment interactions in a non‐immunosuppressed mouse model. BMC Cancer. 2014;14:923. [DOI] [PMC free article] [PubMed] [Google Scholar]
- 18. Wolburg H, Noell S, Fallier‐Becker P, Mack AF, Wolburg‐Buchholz K. The disturbed blood–brain barrier in human glioblastoma. Mol Aspects Med. 2012;33:579‐589. [DOI] [PubMed] [Google Scholar]
- 19. Schneider SW, Ludwig T, Tatenhorst L, et al. Glioblastoma cells release factors that disrupt blood‐brain barrier features. Acta Neuropathol. 2004;107:272‐276. [DOI] [PubMed] [Google Scholar]
- 20. Zhang Y, Yu G, Chu H, et al. Macrophage‐associated PGK1 phosphorylation promotes aerobic glycolysis and tumorigenesis. Mol Cell. 2018;71:201‐215. e7. [DOI] [PubMed] [Google Scholar]
- 21. Xu K, Shu H‐KG. Transcription factor interactions mediate EGF‐dependent COX‐2 expression. Mol Cancer Res. 2013;11:875‐886. [DOI] [PMC free article] [PubMed] [Google Scholar]
- 22. Noy R, Pollard JW. Tumor‐associated macrophages: from mechanisms to therapy. Immunity. 2014;41:49‐61. [DOI] [PMC free article] [PubMed] [Google Scholar]
- 23. Carpenter L, Cordery D, Biden TJ. Protein kinase Cδ activation by interleukin‐1β stabilizes inducible nitric‐oxide synthase mRNA in pancreatic β‐cells. J Biol Chem. 2001;276:5368‐5374. [DOI] [PubMed] [Google Scholar]
- 24. Novotny‐Diermayr V, Zhang T, Gu L, Cao X. Protein kinase C δ associates with the interleukin‐6 receptor subunit glycoprotein (gp) 130 via Stat3 and enhances Stat3‐gp130 interaction. J Biol Chem. 2002;277:49134‐49142. [DOI] [PubMed] [Google Scholar]
- 25. Lee M‐S, Kim TY, Kim Y‐B, et al. The signaling network of transforming growth factor β1, protein kinase Cδ, and integrin underlies the spreading and invasiveness of gastric carcinoma cells. Mol Cell Biol. 2005;25:6921‐6936. [DOI] [PMC free article] [PubMed] [Google Scholar]
- 26. Sizemore N, Leung S, Stark GR. Activation of phosphatidylinositol 3‐kinase in response to interleukin‐1 leads to phosphorylation and activation of the NF‐κB p65/RelA subunit. Mol Cell Biol. 1999;19:4798‐4805. [DOI] [PMC free article] [PubMed] [Google Scholar]
- 27. Cheng CK, Fan QW, Weiss WA. PI3K signaling in glioma—animal models and therapeutic challenges. Brain Pathol. 2009;19:112‐120. [DOI] [PMC free article] [PubMed] [Google Scholar]
- 28. Toker A, Meyer M, Reddy KK, et al. Activation of protein kinase C family members by the novel polyphosphoinositides PtdIns‐3, 4–P2 and PtdIns‐3, 4, 5–P3. J Biol Chem. 1994;269:32358‐32367. [PubMed] [Google Scholar]
- 29. Kim R‐K, Suh Y, Hwang E, et al. PKCδ maintains phenotypes of tumor initiating cells through cytokine‐mediated autocrine loop with positive feedback. Oncogene. 2015;34:5749. [DOI] [PubMed] [Google Scholar]
- 30. Weber A, Wasiliew P, Kracht M. Interleukin‐1 (IL‐1) pathway. Sci Signal. 2010;3:cm1. [DOI] [PubMed] [Google Scholar]
- 31. Perrier S, Caldefie‐Chézet F, Vasson M‐P. IL‐1 family in breast cancer: potential interplay with leptin and other adipocytokines. FEBS Lett. 2009;583:259‐265. [DOI] [PubMed] [Google Scholar]
- 32. Valdivia‐Silva JE, Franco‐Barraza J, Silva ALE, et al. Effect of pro–inflammatory cytokine stimulation on human breast cancer: implications of chemokine receptor expression in cancer metastasis. Cancer Lett. 2009;283:176‐185. [DOI] [PubMed] [Google Scholar]
- 33. Guo B, Fu S, Zhang J, Liu B, Li Z. Targeting inflammasome/IL‐1 pathways for cancer immunotherapy. Sci Rep. 2016;6:36107. [DOI] [PMC free article] [PubMed] [Google Scholar]
- 34. Drexler SK, Bonsignore L, Masin M, et al. Tissue‐specific opposing functions of the inflammasome adaptor ASC in the regulation of epithelial skin carcinogenesis. Proc Natl Acad Sci. 2012;109:18384‐18389. [DOI] [PMC free article] [PubMed] [Google Scholar]
- 35. Mandil R, Ashkenazi E, Blass M, et al. Protein kinase Cα and protein kinase Cδ play opposite roles in the proliferation and apoptosis of glioma cells. Cancer Res. 2001;61:4612‐4619. [PubMed] [Google Scholar]
- 36. Nishizuka Y. The molecular heterogeneity of protein kinase C and its implications for cellular regulation. Nature. 1988;334:661. [DOI] [PubMed] [Google Scholar]
- 37. Hsieh Y‐H, Wu T‐T, Huang C‐Y, Hsieh Y‐S, Hwang J‐M, Liu J‐Y. p38 mitogen‐activated protein kinase pathway is involved in protein kinase Cα–regulated invasion in human hepatocellular carcinoma cells. Cancer Res. 2007;67:4320‐4327. [DOI] [PubMed] [Google Scholar]
- 38. Nakashima S. Protein kinase Cα (PKCα): regulation and biological function. J Biochem. 2002;132:669‐675. [DOI] [PubMed] [Google Scholar]
- 39. Mauro LV, Grossoni VC, Urtreger AJ, et al. PKC delta (PKCδ) promotes tumoral progression of human ductal pancreatic cancer. Pancreas. 2010;39:e31‐e41. [DOI] [PubMed] [Google Scholar]
- 40. Chen Z, Forman LW, Williams RM, Faller DV. Protein kinase C‐delta inactivation inhibits the proliferation and survival of cancer stem cells in culture and in vivo. BMC Cancer. 2014;14:90. [DOI] [PMC free article] [PubMed] [Google Scholar]
- 41. Lu Z, Hornia A, Jiang Y, Zang Q, Ohno S, Foster DA. Tumor promotion by depleting cells of protein kinase C delta. Mol Cell Biol. 1997;17:3418‐3428. [DOI] [PMC free article] [PubMed] [Google Scholar]
- 42. Black JD. Protein kinase C‐mediated regulation of the cell cycle. Front Biosci. 2000;5:D406. [DOI] [PubMed] [Google Scholar]
- 43. Hernández‐Maqueda JG, Luna‐Ulloa LB, Santoyo‐Ramos P, Castañeda‐Patlán MC, Robles‐Flores M. Protein kinase C delta negatively modulates canonical Wnt pathway and cell proliferation in colon tumor cell lines. PLoS ONE. 2013;8:e58540. [DOI] [PMC free article] [PubMed] [Google Scholar]
- 44. Smith MP, Young H, Hurlstone A, Wellbrock C. Differentiation of THP1 cells into macrophages for transwell co–culture assay with melanoma cells. Bio‐protocol. 2015;5(21). [DOI] [PMC free article] [PubMed] [Google Scholar]
- 45. Alshawi A, Agius L. Low metformin causes a more oxidized mitochondrial NADH/NAD redox state in hepatocytes and inhibits gluconeogenesis by a redox‐independent mechanism. J Biol Chem. 2019;294:2839‐2853. [DOI] [PMC free article] [PubMed] [Google Scholar]
- 46. Libby CJ, Tran AN, Scott SE, Griguer C, Hjelmeland AB. The pro–tumorigenic effects of metabolic alterations in glioblastoma including brain tumor initiating cells. Biochim Biophys Acta Rev Cancer. 2018;1869:175‐188. [DOI] [PMC free article] [PubMed] [Google Scholar]
Associated Data
This section collects any data citations, data availability statements, or supplementary materials included in this article.
Supplementary Materials
Supplementary Material


