Abstract
Soil cadmium (Cd) pollution threatens food safety. This study aimed to identify genes related to Cd accumulation in rice. Low- (Shennong 315, short for S315) and high- (Shendao 47, short for S47) Cd-accumulative rice cultivars were incubated with CdCl2·2.5H2O. RNA-seq and weighted gene co-expression network analysis (WGCNA) were performed to identify the modules and genes associated with Cd-accumulative traits of rice. After Cd stress treatment, the Cd content in various tissues of S315 was significantly higher than that of S47. In the stem nodes, the Cd distribution results of the two varieties indicated that the unelongated nodes near the root (short for node A) had a stronger ability to block Cd transfer upwards than the panicle node (short for node B). Cd stress induced huge changes in gene expression profiles. After analyzing the differentially expressed genes (DEGs) in significantly correlated WGCNA modules, we found that genes related to heavy metal transportation had higher expression levels in node A than that in node B, such as Copper transporter 6 (OS04G0415600), Zinc transporter 10 (OS06G0566300), and some heavy-metal associated proteins (OS11G0147500, OS03G0861400, and OS10G0506100). In the comparison results between S315 and S47, the expression of chitinase (OS03G0679700 and OS06G0726200) was increased by Cd treatment in S315. In addition, OsHSPs (OS05G0460000, OS08G0500700), OsHSFC2A (OS02G0232000), and OsDJA5 (OS03G0787300) were found differentially expressed after Cd treatment in S315, but changed less in S47. In summary, different rice varieties have different processes and intensities in response to Cd stress. The node A might function as the key tissue for blocking Cd upward transport into the panicle via vigorous processes, including of heavy metal transportation, response to stress, and cell wall.
Subject terms: Plant signalling, Plant stress responses
Introduction
Heavy metal cadmium (Cd) contaminates a large area of rice (Oryza sativa), which is one of the largest food crops in China and worldwide1. Cd pollution causes irreversible soil problems in China. Various technologies and great efforts have been made in the treatment of Cd pollution and restoration of Cd contaminated soils, but the little effect has been achieved. Screening and breeding for low Cd-accumulative cultivars could relieve Cd-induced pressure in cropping system2,3.
Many plant species with low cadmium accumulation have been proposed and widely promoted in scientific research and cropping2,4. Consequently, identifying genetic targets that can be used to reduce cadmium accumulation in crops is important for plant breeding5–8. Many genes related to Cd stress have been identified. For instance, the expression of Arabidopsis PLANT DEFENSIN 2 (AtPDF2.5) can promote Cd accumulation in Arabidopsis roots5. Tang et al. reported that the knockout of OsNramp5 (a magnesium ion (Mg2+) and Cd transporter and a Mn and Cd uptake gene) in rice reduced the accumulation of Cd in rice8.
The comparative transcriptome analysis of low and high Cd accumulation genotypes has been performed on Brassica Chinensis L.9, wheat10,11, rice12 and many other crops. Application of molecular and transgenic technologies and next-generation sequencing (NGS) methods facilitate the identification process of effective genes related to Cd fixation and distribution9–11, and some genes have been recommended as targets for controlling Cd accumulation in crops9. However, the emergence of a large number of proposed targets increased the difficulty of breeding strategy. Weighted gene co-expression network analysis (WGCNA) approach is a popular method used for identifying the co-expressed and hub genes13,14. WGCNA has been widely used to identify genes and modules associated with the specific phenotypes and agronomic traits15,16.
In production practice, we found two varieties, one with high Cd accumulation (Shennong 315, S315) and one with low Cd accumulation (Shendao 47, S315). Here, we aimed to reveal the differences in response to Cd stress in stem nodes between the two rice varieties using the RNA-seq combined with the WGCNA approach. The transcriptome profiles of the unelongated nodes near the root (node A) and the panicle node (node B) were compared. The results will give us more understanding of the gene expression profiles in responding to Cd stress between different stem nodes and between different rice varieties.
Results
Cd content profiles in different tissues of different rice varieties
The results showed that the Cd concentrations in the unelongated nodes near the root (node A), the panicle node (node B) and grains (Gr) of the two rice cultivars significantly increased (p < 0.0001, Table 1) after Cd treatment. As expected, Shennong 315 (S315) was a low grain-Cd-accumulating rice cultivar and Shendao 47 (S47) was a high one (3.06 ± 0.21 mg/kg in S315; 4.84 ± 0.54 mg/kg in S47) after Cd treatment. In both the two rice cultivars, the Cd concentration of node A (64.26 ± 7.23 mg/kg in S315; 86.43 ± 9.37 mg/kg in S47) were significantly higher than that of node B (5.63 ± 0.90 mg/kg in S315; 19.96 ± 4.23 mg/kg in S47, p < 0.001, Table 1). Interestingly, in the control groups, a small amount of Cd was still accumulated in both two rice cultivars, and most of them were enriched in node A (Table 1).
Table 1.
The Cd concentration in different sites of the two cultivars before and after Cd treatments.
| Groups | Control (mg/kg DW) | Cd treatments (mg/kg DW) | P |
|---|---|---|---|
| S315-A | 16.24 ± 4.36b | 64.26 ± 7.23b | <0.0001 |
| S315-B | 1.41 ± 0.02d | 5.63 ± 0.90d | <0.0001 |
| S47-A | 31.41 ± 5.23a | 86.43 ± 9.37a | <0.0001 |
| S47-B | 2.17 ± 0.51c | 19.96 ± 4.23c | <0.0001 |
| S315-Gr | 0.19 ± 0.02 f | 3.06 ± 0.21 f | <0.0001 |
| S47-Gr | 0.45 ± 0.05e | 4.84 ± 0.54e | <0.0001 |
S47 note high Cd-accumulative cultivar “Shendao 47”, S315 notes low Cd-accumulative cultivar “Shennong 315”, “A” indicates the first node, “B” indicates panicle node. Gr, grains. P value was tested using the unpaired t test. The different lowercases in the column notes the significant differences (p < 0.05) by the one-way ANOVA test.
Summary of the mRNA-seq
Illumina transcriptome sequencing produced 1132.54 M clean reads, with an average Q20 and Q30 value of 97.54% and 93.42%, respectively (Supplementary Table 1). The mapping rate to the reference genome (ftp://ftp.ensemblgenomes.org/pub/release-44/plants/fasta/oryza_sativa/) ranges from 82.33% to 96.49%.
Identification of DEGs related to Cd treatments
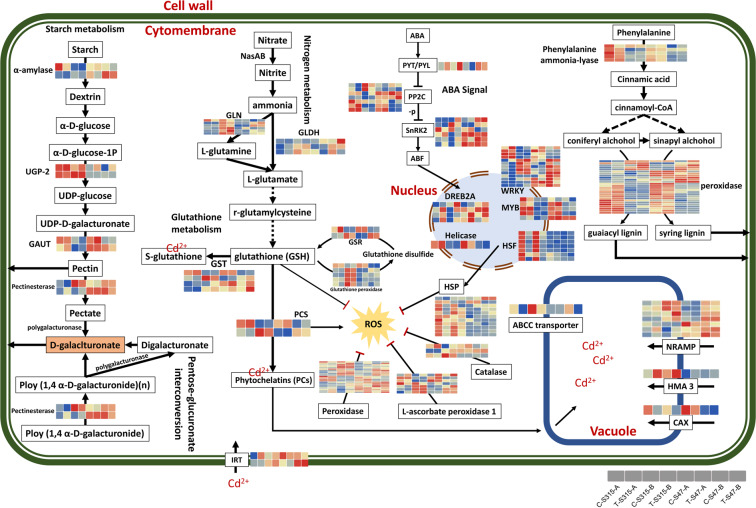
By identifying the DEGs between different nodes in the same rice cultivar and DEGs between different rice cultivars in the same node, different effects of Cd treatment on the transcriptome in the two rice cultivars and stem nodes were confirmed (Supplementary Fig. 1). There were 390 and 520 DEGs induced by Cd treatment in node A and B of S315, respectively. And 883 and 306 DEGs found in node A and B of S47 after Cd treatment. GO-BP category enrichment analysis showed that the Cd-induced DEGs in node A and B of the S315 cultivar were mainly associated with “response to heat”, “response to temperature stimulus”, “protein folding” and “transcription regulator activity” (Supplementary Table 2). While in S47 cultivar, no significant enriched GO terms found in node A, and six significant GO terms (“tetrapyrrole binding”, “heme binding”, “oxidation-reduction process” and “defense response”) found in node B (Supplementary Table 2). The KEGG enrichment analysis results showed that “MAPK signaling pathway-plant”, “Signal transduction” and “Environmental Information Processing” were significantly enriched in node A and B of the S315 cultivar and node B of the S47 cultivar. No significantly enriched KEGG pathways found in node A of the S47 cultivar (Supplementary Table 2). To understand the gene expression profile in response to Cd stress, we used Zhou’s9 figure as a reference to show the DEGs expression patterns in the rice stem nodes (Fig. 2). The results showed that ABA signal pathway, Glutathione metabolism, and some transporters play important roles in the process of resistance to Cd stress. We found that OsSnRN2 showed higher expression in S47 than that of S315. The expression of OsHSF in S315 was decreased by Cd stress, of which the expression showed no obvious changes in S47. In addition, OsHSPs showed a similar expression profile with that of OsHSF. As the well-known Cd related transporters, most OsNRAMP family members showed no significant differences between control and Cd treatment. Another Cd related transporter OsHMA3 (OS07G0232900) was significantly increased by Cd treatment in S315, but showed slight changes in S47. In addition, node B had higher expression of GLN and glutathione peroxidase (OsGSH-Px) than node A in S315, but the profile changes were not obvious in A, especially the OsGSH-Px gene.
Figure 2.
The expression patterns of DEGs response to Cd stress in different groups. Heatmaps shows the expression level of DEGs, and the redder the color, the higher expression. Original figure is from Zhou’s report, and modified according to our results. Original figure from: Zhou, Q. et al. Comparative transcriptome analysis between low-and high-cadmium-accumulating genotypes of pakchoi (Brassica chinensis L.) in response to cadmium stress. Environmental science & technology 50, 6485–6494 (2016).
Identification of co-expression networks associated with rice phenotypes and traits by WGCNA
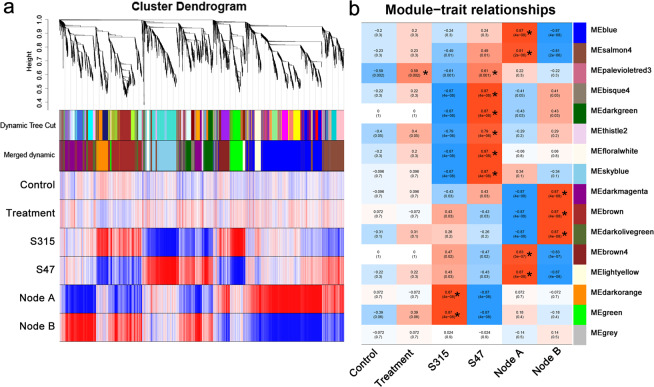
In order to identify the DEGs associated with the different phenotypes and traits, all DEGs were pooled into one set and used for WGCNA. A total of 7358 DEGs (from the comparisons of C-S315-A vs. C-S315-B, T-S315-A vs. T-S315-B, C-S47-A vs. C-S47-B, C-S47-A vs. C-S315-A, T-S47-A vs. T-S315-A, T-S47-B vs. T-S315-B, T-S47-A vs. T-S47-B, C-S47-B vs. C-S315-B, C-S315-A vs. T-S315-A, C-S47-B vs. T-S47-B, C-S315-B vs. T-S315-B, and C-S47-A vs. T-S47-A) were pooled and analyzed (Supplementary Table 3). The adjacency matrix parameters, including soft-thresholding power and connectivity between DEGs, were screened prior to the WGCNA module analysis. The soft threshold power of 21 (β = 21) was selected according to the preconditions of approximate scale-free topology (Supplementary Fig. 2). Accordingly, a total of 16 WGCNA modules were identified (Fig. 3a), including 9 to 1743 genes in each WGCNA module. We identified that 1, 8 and 7 modules showed significant (cor > 0.5, p < 0.05) correlation with the Cd content in different Cd treatment, rice cultivar and nodes, respectively (Fig. 3b).
Figure 3.
WGCNA module identification and correlation analysis. (a) the clustering dendrogram and expression heatmap of genes identifying the WGCNA modules. (b) the correlation of the identified modules with the Cd content in different treatments. Modules significantly associated with the traits with identified with |cor | >0.5 and p value < 0.05, and are indicated by asterisk*. Red and blue color notes positive and negative correlation with gene expression, respectively.
Modules and DEGs associated with nodes
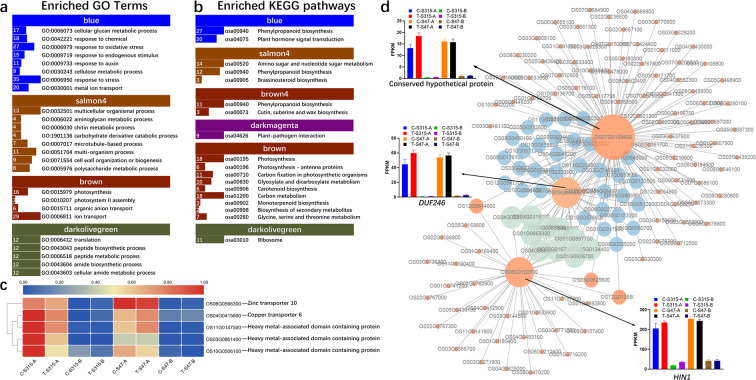
Our present study identified the co-expression of genes in 4 modules (blue, salmon4, brown4, and lightyellow) were significantly and positively correlated with the trait of node A (cor > 0.5, p < 0.05), but negatively with that of node B (cor < −0.5, p < 0.05). While 3 modules (darkmagenta, brown, and darkolivegreen) were significantly and positively correlated with the trait of node B (cor > 0.5, p < 0.05), but negatively with that of node A (cor < −0.5, p < 0.05). DEGs in blue module were mainly associated with “response to oxidative stress”, “response to endogenous stimulus”, “response to auxin”, “response to stress”, “metal ion transport” etc. DEGs in salmon4 module were involved in BPs associated with “multicellular organismal process”, “chitin metabolic process”, and “cell wall organization or biogenesis”. While DEGs in brown module were associated with photosynthesis and Cd transport. And DEGs in darkolivegreen were enriched in “translation”, “peptide metabolic process” etc. (Fig. 4a). No significantly enriched GO-BP terms found in brown4, lightyellow and darkmagenta module. KEGG pathway enrichment showed that the DEGs positively associated with the node B were mainly involved in “photosynthesis”, “plant-pathogen interaction”, and “carbon metabolism”; while DEGs positively associated with the trait of the node A were mainly associated with “plant hormone signal transduction” and “Phenylpropanoid biosynthesis” (Fig. 4b). These data showed that these modules and genes positively associated with the trait of node A (blue, salmon4 and brown4) might have crucial roles in controlling Cd accumulation. Among the DEGs positively associated with the trait of the unelongated nodes near the root (node A), we identified that Heavy metal transport/detoxification protein domain containing proteins (OS03G0383900, OS03G0861400, OS10G0506100, OS11G0147500), Copper transporter 6 (OS04G0415600) and Zinc transporters (OS04G0613000 and OS06G0566300) were significantly enriched in “metal ion transport” GO term (GO:0030001), the expression patterns of which mediated these differences in Cd accumulation between the two types of nodes. In addition, their expression levels in node B were lower than those in node A, and were decreased by Cd treatment in the S315 cultivar (Fig. 4c). The gene interaction network analysis results showed that OsDUF246 (OS09G0498800), OsHlN1 (OS08G0102700) and a conserved hypothetical protein (OS07G0109400) were the core genes in blue module (Fig. 4d), which were highly expressed in node A, but lowly in node B. Accordingly, we speculated that these DEGs were associated with the high Cd accumulation in node A in rice. The up-regulation of them might increase the Cd concentration in node A via sequestering Cd ion by cellular localization and vesicle trafficking.
Figure 4.
Enrichment of the modules associated with panicle node. The Gene Ontology biological processes (GO-BP, a) and KEGG pathways (b) associated with the modules relevant to panicle node. The number ahead of the items indicates the gene number. (c) the expression of several genes in the node A negative module (blue). (d) gene interaction network and key regulator expression. The bigger the node, the greater the number of connections it has. Nodes with different colors are with different number of connections.
DEGs and modules associated with low Cd-accumulative phenotype
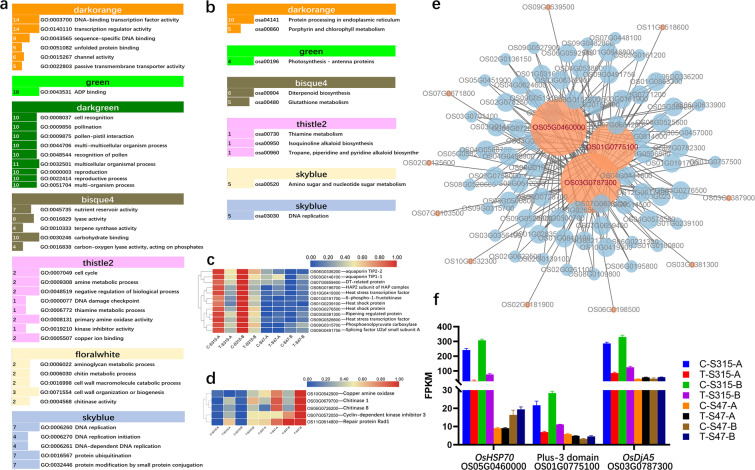
The present results showed that Cd treatment induced more DEGs in the low Cd-accumulative cultivar (S315) versus high Cd-accumulative cultivar (S47). We speculated that these DEGs in S315 cultivar might be responsible for the Cd-induced abiotic stresses. Using WGCNA analysis we found 2 modules (darkorange and green) had positive correlation with S315 (low Cd-accumulative phenotype, cor > 0.5, p < 0.05), while 6 modules (palevioletred3, bisque4, darkgreen, thistle2, floralwhite and skyblue) negatively correlated with S315 (cor < −0.5, p < 0.05). GO enrichment analysis showed that DEGs in the 2 positive modules were significantly enriched in “DNA-binding transcription factor activity”, “transcription regulator activity” and “ADP binding” (Fig. 5a). For negative modules, enrichment analysis showed that DEGs in thistle2 were mainly associated with cell cycle. DEGs in floralwhite were associated with cell wall and chitin metabolic process. In addition, DEGs in skyblue module were mainly associated with BP terms like “DNA replication”, “protein ubiquitination” (Fig. 5a). In the results of KEGG enrichment results, 10 pathways were significantly enriched in these six modules, including protein processing related pathways, photosynthesis, glutathione metabolism, DNA replication pathways (Fig. 5b). The expression profiles of DEGs in the positive modules showed higher reads numbers in S315 cultivar than that in S47 and were decreased by Cd treatment in the S315 cultivar, like heat shock proteins (OS01G0239100 and OS03G0276500), heat stress transcription factors (OS09G0526600 and OS10G0419300), etc. (Fig. 5c). Most DEGs were found in negative modules (darkgreen, bisque4, thistle2, floralwhite, and skyblue), of which DEGs in floralwhite were significantly enriched into GO terms related cell wall, indicating that the cell wall plays a key role in plant resistance to Cd stress. Chitinase 1 (OS06G0726200) and Chitinase 8 (OS10G0542900) were the domain DEGs in cell wall related terms and highly expressed in S47, especially after Cd treatment (Fig. 5d). In thistle2 module, Cyclin-dependent kinase inhibitor 3 (OS11G0614800), Copper amine oxidase (OS07G0572050), and Repair protein Rad1 (OS03G0679700) showed higher expression level in S47 than that of S315 (Fig. 5d). The gene interaction network analysis results showed that OsHSP70 (OS05G0460000), OsDJA5 (OS03G0787300) and Plus-3 domain (OS01G0775100) were the key regulators in responding to Cd stress in S315 (negatively regulated by Cd stress in S315, Fig. 5e,f). These data showed that the up-regulation of these genes might be responsible for or at least correlated with the low Cd accumulation. In particular, stress-related signals are active in S47 cells, which is related to the characteristics of high cadmium accumulation in S47.
Figure 5.
The modules relevant to different rice varieties. (a,b) the Gene Ontology biological processes (GO-BP) and KEGG pathways associated with modules associated with high Cd accumulative trait. The number ahead of the items indicates the gene number. (c,d) the reads number of several DEGs in the high Cd accumulation positive and negative modules, respectively. e, gene interaction network analysis results of DEGs negatively regulated by Cd stress in S315. f, the expression profiles of key regulators in the interaction network. The bigger the node, the greater the number of connections it has. Nodes with different colors are with different number of connections.
DEGs associated with Cd treatment
Our previous analysis showed that only palevioletred3 module associated with the trait of Cd treatment based on the criteria of absolute Cor > 0.5 and p < 0.05 (Fig. 3b). GO enrichment analysis showed that “defense response” and “response to stress” were significantly enriched (Fig. 6a). All the significantly enriched DEGs had low FPKM value (Fig. 6b). The gene interaction network analysis results indicated three key regulators: OS12G0263800 (OsIRL, Isoflavone reductase-like protein 1), OS03G0254200 (no annotated information), and OS10G0343500 (Transposase, Fig. 6c), of which OS12G0263800 and OS03G0254200 were highly expressed in S47 and S315, respectively (Fig. 6d).
Figure 6.
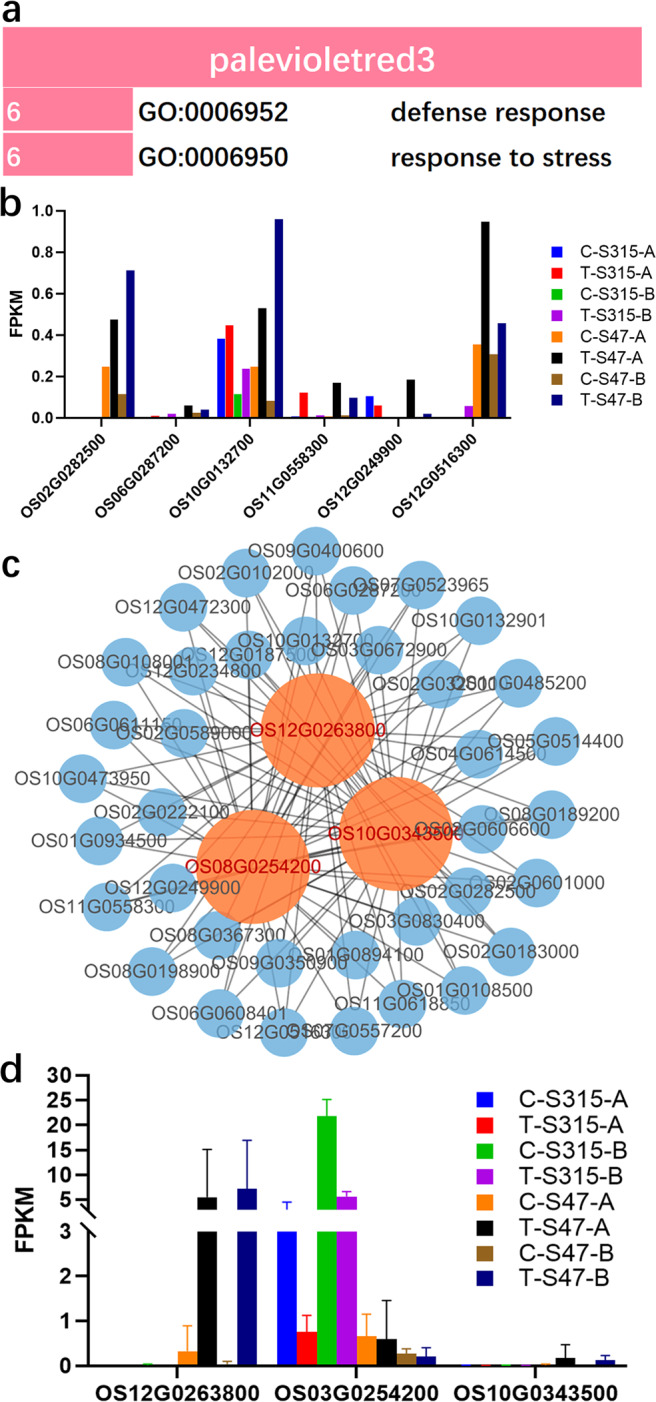
The modules associated with Cd treatment. (a) the Gene Ontology biological processes (GO-BP). (b) expression of enriched DEGs in GO term “defense response”. The number ahead of the items indicates the gene number. (c,d) gene interaction network and the expression profiles of key regulators in the interaction network. The bigger the node, the greater the number of connections it has. Nodes with different colors are with different number of connections.
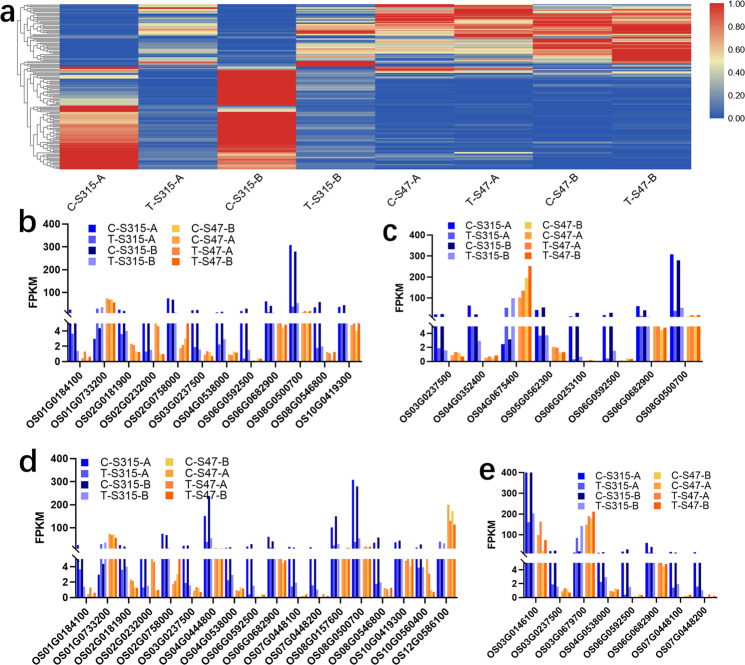
Because of the great difference between S315 and S47, most of the modules in WGCNA are not significant. Therefore, we analyzed all co-expressed DEGs by GO and KEGG enrichment methods. After screening the co-expressed DEGs induced by Cd treatment, we found the expression patterns were quite different between S315 and S47 (Fig. 7a). The GO enrichment analysis results showed that “response to heat”, “response to temperature stimulus”, “protein folding”, “response to abiotic stimulus”, and “response to drug” were significantly enriched. Most DEGs enriched in these GO terms, including OS08G0500700 (OsHSP82A, Heat shock protein 82), OS02G0232000 (OsHSFC2A, Heat shock transcription factor 29), OS04G0444800 (OsFRO1, Ferric reductase-like transmembrane component family protein), OS07G0448100 (OsPIP2, Plasma membrane integral protein), showed higher expression in S315 than S47 in control, which decreased by Cd treatment in S315, but no significant changes in S47 (Fig. 7b–e). No significant enriched KEGG pathways found. These findings showed that genes might have crucial roles in regulating Cd accumulation in rice.
Figure 7.
Enrichment analysis results of co-expressed DEGs between S315 and S47. (a) heatmap of all the co-expressed DEGs between S315 and S47. (b to e) expression of DEGs in these significantly enriched GO terms of “response to heat”, “response to temperature stimulus”, “protein folding”, “response to abiotic stimulus”, and “response to drug”.
qRT-PCR validation of selected genes
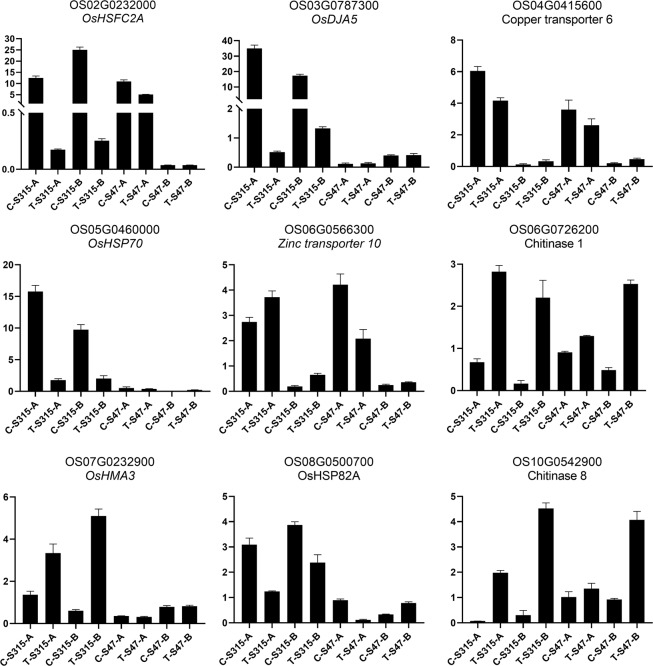
The qRT-PCR experiment was performed to confirm the computational analysis results, we selected 9 candidate genes that associated with the Cd accumulation in rice from GO and KEGG enrichment analysis results and WGCNA modules. The results showed that the expression levels of all the genes in qRT-PCR were consistent with RNA-seq. All these 9 candidate genes were significantly changed between different node types, between Cd treatment and control, or between S315 and S47, which demonstrated that these genes were all responsive to Cd (Fig. 8).
Figure 8.
qRT-PCR Validation results. The abscissa shows the genes ID and the ordinate shows the foldchange. Quantification of gene expression was performed by the comparative 2−ΔΔCT method.
Discussion
The effects of Cd stress on photosynthesis, respiration, and ion transportation in plant have been reviewed in previous studies17–22. Our present study demonstrated that the node A of rice had a higher capacity in accumulating and sequestrating Cd ion compared with the panicle node. WGCNA modules and genes associated with the Cd accumulation phenotype and the node A agronomic trait were identified.
Based on the WGCNA, we identified the modules positively associated with Cd treatment, thus the Cd positive modules consisted of upregulated DEGs by Cd treatment. Heavy metal stress has probably triggered the synthesis of many defense proteins as the total protein contents in stressed plants increased23. In the present study, chitinase (OS03G0679700 and OS06G0726200) were increased by Cd treatment. Previous studies reported that chitinases are considered to act primarily during pathogen attack by hydrolyzing microbial cell walls24,25. Apparently, they might provide advantages for plants during heavy metal stress. Similarly, Meszaros26 and Bekesiova23 found that heavy metal stress could induce more chitinases in plants. Dana et al. reported overexpressing chitinases tobacco showed exhibit enhanced levels of resistance to biotic and abiotic stress27. In addition, Wang et al. found the up-regulated AcCHI I mRNA in response to Cd stress28. All these findings further confirmed the important role of chitinases in against Cd stress. Bekesiova et al. found that chitinases should be included among defence components that are responsible for inter- as well as intra-species differences in heavy metal tolerance of plants23. However, their role and mechanism of action in the plant cells still remain unknown, but are apparently more diverse and complex than expected23. WGCNA analysis results also indicated the critical role of OsHSAP70 and OsDjA5. Correspondingly, OsHSP82A and OsHSFC2A were also found differentially expressed between different nodes and rice varieties. The important roles of HSF and HSPs (large or small) in plant immunity, growth, defense, and stress responses have been identified29–32 and Cd-stress induced HSPs expression in rice inhibited Cd-induced damage in plant cell in turns33. It has been reported that the overexpression of a small HSP gene enhanced tolerance to abiotic stresses (including heat, drought, abscisic acid, salinity, and cold) in rice34. Cai et al. showed the silencing of HSFA1a in tomato plants blocked Cd stress-induced HSP expression, while HSFA1a overexpression promoted HSP expression32. The stable expression of HSF and HSPs encoding genes, including OsHSP70, OsHSP82A, and OsHSFC2A showed the insensitivity to Cd stress of S47 compared with S315. HSPs/molecular chaperones are normally found to be involved in the response to stress35. The DnaJ proteins are found in plants and other organisms and are important molecular chaperones, referred to as cellular stress sensors, that are involved in signal transduction, cellular protein homeostasis, and tolerance to multiple stresses in plants36,37. Overexpression of the DnaJ-like protein gene could enhance the tolerance to chilling and heat stresses in transgenic tobacco plants38. While the decreased OsDJA5 by Cd treatment in S315 indicated the sensitivity to Cd Stress.
The mRNA expression profiles showed that S315 responded strongly to Cd stress, while S47 responded weakly to Cd stress (Fig. 7a). These differences might mediate lower Cd accumulation in S315. DEGs like OS08G0500700 (OsHSP82A), OS02G0232000 (OsHSFC2A), OS04G0444800 (OsFRO1), and OS07G0448100 (OsPIP2) had higher expression level in S315 than that in S47. HSF and HSPs (large or small) play critical roles in plant immunity, growth, defense, and stress responses29–32. In rice, Cd-stress induces HSPs expression, in turns it inhibits Cd-induced damage in plant cells33. Also, PIPs play critical roles in resisting heavy metal stress [49–53]. Accordingly, the expression of these genes was significantly reduced by Cd treatment in S315, but showed small or undetectable changes in S47 cultivar, indicating a relative insensitivity of S47 cultivar to Cd stress. In addition to the DEGs mentioned above, there were many other DEGs involved in the complex Cd stress response process. The difference between the two rice varieties is mainly due to genetic factors, which dominates their different responses to Cd stress.
Stem nodes are responsible for the transport of ions, nutrients and metabolites, and are the central organ from the xylem to the phloem39. The different capacities in Cd accumulation between the shoot base and panicle node had been confirmed in previous reports40–42. Feng et al.41 and Fujimaki et al.40 traced the accumulation and transport of Cd in the rice stem and root and confirmed the gradual decrease of Cd accumulation in rice nodes. Fujimaki et al. found Cd was predominantly accumulated in the shoot base (unelongated nodes, then upward transported to the panicle through xylem-to-phloem transfer40. Leaf had low Cd accumulation capacity compared with the shoot base and the panicle node40. These data showed that the root node might be crucial for the immobilization of Cd. These facts were confirmed by the identification of WGCNA modules associated with the panicle node trait. We identified that the WGCNA modules positively correlated with the node A (named as panicle positive modules) were related to ion transport, photosynthesis and response to stress. However, the modules positively correlated with panicle node (node B) were associated with translation, peptide biosynthetic process, etc. This finding might demonstrate that the node A was crucial for Cd accumulation, cellular localization and upward transport of Cd. Among the DEGs positively related to node A trait, Copper transporter 6, Zinc transporter 10, and some heavy-metal associated proteins were highly expressed in node A compared with node B of the two cultivars. To deal with heavy metal ions, plants, as well as other organisms, have developed a sophisticated homeostatic network to control heavy metal ions uptake, trafficking, utilization, and detoxification or exportation43,44. Copper transporter is a main protein that contributes copper ions uptake through the cell membrane45. Also, Zinc transporters mediated the uptake of Zinc ions in plant cells46. The present study showed the important roles of copper and zinc transporter in different node types. Expression of copper and zinc transporters in node A were significantly higher than that in node B, which is consistent with higher Cd concentration in nodes (Fig. 4c). Therefore, we believe that these genes mediate the accumulation of Cd in node A. Although these genes had been reported to be related to the transport of copper and zinc, they may also play an important role in the transport of Cd. The decreased expression of them in node A after Cd treatment confirmed that these genes were related to the Cd accumulation and transportation in the node A of rice, and might be responsible for the different Cd accumulation mechanisms between the node A and node B. In addition, OsNramp genes and OsHMA3 are both well know Cd uptake transporters47,48. Most OsNramp transcripts showed no significant changes after Cd stress but were highly expressed in node B compared with node A. Another Cd related transporter OsHMA3 was significantly increased by Cd treatment in S315 but showed slightl changes in S47. These results indicated that OsNramp might mediate the Cd uptake in node B. For S315, the up-regulated OsHMA3 by Cd stimulation showed a critical role in Cd accumulation.
In addition, some regulators were also identified in the gene interaction network analysis, such as OS12G0263800, OS03G0254200, etc. However, there is a lack information for the association of their expression with stresses. The increase expression of them by Cd treatment might show that their expressions were responsive to Cd stress.
Conclusions
Our present study demonstrated that Cd stress induced huge changes in gene expression profiles. different rice varieties have different processes and intensities in response to Cd stress. The node A might function as the key tissue for blocking Cd upward transport into the panicle via vigorous processes. DEGs in heavy metal ions transportation (including Copper transporter 6, Zinc transporter 10, and some heavy-metal associated proteins), response to stress (OSHSPs, OsHSFs, OsDJA5, etc.), and cell wall (chitinase) play critical roles in resisting Cd stress. In addition, many new regulatory factors have been identified in this study, but further experiments would be performed to investigate the mechanism of these DEGs in controlling Cd accumulation in rice and other plants. All the candidate DEGs were verified by qRT-PCR, which will provide new supports for rice breeding.
Methods
Plant materials and experimental design
The low Cd-accumulative cultivar “Shennong 315” (O. s. japonica, short for S315) and high Cd-accumulative cultivar “Shendao 47” (O. s. japonica, short for S47) were used as plant materials. All the seeds were obtained from the Germplasm Resources Bank of Liaoning Province with the access number of Liaoshendao[2001]No.96 and Liaoshendao[2010]No.235 for S315 and S47, respectively. The experiment was performed in an experimental greenhouse located in Northeast Agricultural University. At three true-leaf stage, rice seedlings were transplanted into greenhouse with conventional density, illumination and fertilization strategy. A total of 60 rice seedlings (including 30 seedlings of S315 and S47 each) were used as plant materials. Each rice variety (30 seedlings) was randomly divided into two pools (15 plants for each), one of which was filled with Cd2+-free muddy water (control group, marked as C) and the other one was treated with CdCl2·2.5H2O (10 mg/Kg) until maturity (Cd treatment group, marked as T). In total, four groups were designed, including C-S315, T-S315, C-S47, and T-S47. The samples of the first node (unelongated nodes, marked as A, Fig. 1), panicle node (marked as B, Fig. 1), and grains were collected at grain-filling stage for Cd content determination with five biological repetitions (three technical repetitions for each). All the stem nodes samples (the first and panicle nodes) were collected for transcriptome analysis and marked as C-S315-A, T-S315-A, C-S315-B, T-S315-B, C-S47-A, T-S47-A, C-S47-B, and T-S47-B, respectively, and three biological replicates were set for each group (each biological replicate contained three individuals). All fresh samples were stored at −80 °C until assayed.
Figure 1.
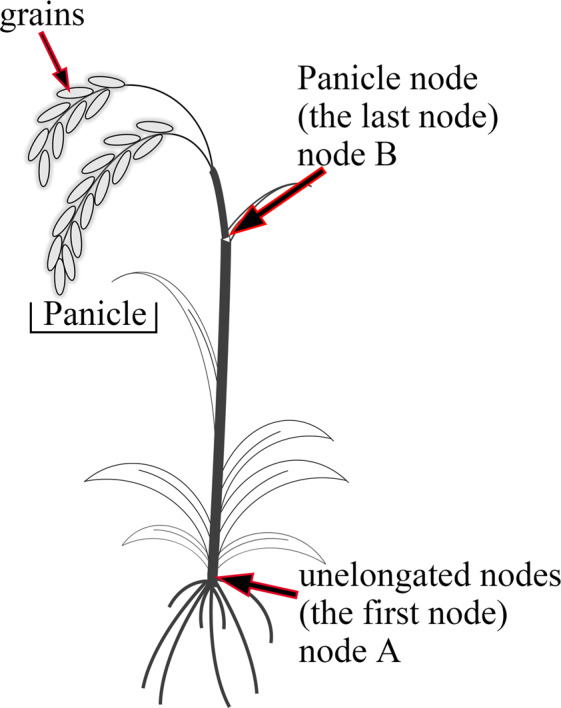
The diagrammatic drawing of rice with indicated sampling sites.
Determination of total Cd concentrations
To determine the Cd concentration in node A, node B, and rice grains, an atomic absorption spectrophotometer (AAS) was used according to the instructions. Briefly, fresh tissues were shredded, dried and powdered. 100 mg of powder was treated with 1 mL HNO3 and was diluted in 20 mL ultrapure water. Standard Cd solution (CdCl2) was used as quality control samples.
Total RNA extraction and mRNA libraries construction
The total RNA was extracted from stem nodes tissues using an RNAprep pure Plant Kit (Tiangen, China). The RNA quality was evaluated using gel electrophoresis and Nanodrop (Thermo, USA). Equal RNA samples from three individuals in each group were pooled to one composite sample (as a biological repetition), and 3 composite samples were prepared in each group (n = 24 samples) accordingly. All the RNA samples were reversely transcribed to cDNA samples using a QuantScript RT Kit (Tiangen, China). The sequence libraries were then constructed using mRNA-seq V3 Library Prep Kit for Illumina (Vazyme, China) according to the manufacturer’s instruction. Library quality was evaluated using Agilent 2100 Bioanalyzer (Agilent Technologies, USA). Finally, an Illumina HiSeq X sequencing platform (a pair-end 2×150 bp mode) was used to obtain sequencing data.
mRNA sequence data processing
The quality of raw sequencing data (.fastq format) was controlled using the FastQC (version 0.11.5, http://www.bioinformatics.babraham.ac.uk/projects/fastqc/). Low quality reads and adaptor reads were removed from raw data and the clean data were assembled and compared to the reference genome of rice (IRGSP-1.0.28, http://rice.plantbiology.msu.edu/pub/data/Eukaryotic_Projects/o_sativa/) using hisat2 (http://ccb.jhu.edu/software/hisat2). The value of FPKM (expected number of Fragments Per kb per Millions reads) of reads was calculated using Cufflinks (version 2.2.1, http://cole-trapnell-lab.github.io/cufflinks/). Principal component analysis (PCA) and Pearson’s correlation analysis were performed based on the FPKM. The differentially expressed genes (DEGs) were identified using DESeq (http://bioconductor.org/packages/release/bioc/html/DESeq.html)49, with the criteria of p < 0.05 and |log2(Fold Change, FC) | ≥ 2. Genes with log2FC > 2 and log2FC < −2 were identified as up- and down-regulated DEGs, respectively. Hierarchical clustering based on the expression profiles of DEGs was presented by pheatmap (version 1.0.10; https://cran.r-project.org/web/packages/pheatmap/index.html).
WGCNA analyses for DEGs
The R package WGCNA (v1.61; https://cran.r-project.org/web/packages/WGCNA/index.html) was employed for the analysis of DEGs’ co-expression module50. The WGCNA parameters of soft threshold power of the adjacency matrix and the criteria of correlation coefficient square of eigengenes were defined according to the approximate scale-free topology preconditions and the criteria of cut-off of ≥30 genes and cut height = 0.15. The adjacency matrix dissimilarity was 0.2. Then, the WGCNA modules (co-expression network) of eigengenes were identified and the networks correlated with agronomic traits were identified with the criterion of stability correlation p ≤ 0.05. The modules with gene significance (Pearson’s correlation coefficient) ≥0.6 for agronomic traits (Cd treatment, Cd accumulation and different tissue nodes) were retained for further analyses.
GO and KEGG enrichment analysis
The DEGs in modules correlated with the agronomic traits were separately subjected to the enrichment analysis for Gene Ontoloy (GO; http://www.Geneontology.org/) and KEGG (Kyoto Encyclopedia of Genes and Genomes) pathways51. Significant GO biological processes (BP) and KEGG pathways were identified with the criterion of p < 0.05.
qRT-PCR gene expression analysis
qRT-PCR analysis was performed to verify the expression of candidate DEGs. Primers of the candidate DEGs were designed using Primer Premier 5.0 (http://www.PremierBiosoft.com). The 20 μL reaction volume contained 2 μL of diluted cDNA, 0.5 μL of forward and reverse primers (10 μM), 10 μL of 2×POWRUP SYBR MASTER MIX (Thermo, USA) and 7 μL of dd H2O. The PCR amplification were performed on an Eppendorf Mastercycler pro PCR System (Eppendorf, Germany) with 95 °C for 5 min, followed by 40 cycles of 95 °C for 15 s, 58 °C for 30 s, then followed by 72 °C for 5 min. The relative quantification was calculated by 2−ΔΔCT method. Three independent biological replicates were designed here.
Statistical analysis
Statistical analysis was performed using GraphPad Prism 6 (https://www.graphpad.com/support/prism-6-updates/). All experimental data were expressed as mean ± standard deviation (SD), and differences between groups or treatments were analyzed using the unpaired t-test. Differences across tissues were analyzed using one-way ANOVA test. P < 0.05 was set as significant threshold for statistical differences.
Ethical approval
This article does not contain any studies with human participants or animals performed by any of the authors.
Supplementary information
Acknowledgements
This work was supported by National key research and development plan (grant number 2016YFD0300204), the Natural Science Foundation of Heilongjiang (grant number QC2018026) and the Foundation of Heilongjiang Academy of Agricultural Sciences (grant number 2018YYYF030). The funding body had no role in study design, the collection, analysis, interpretation of data and manuscript writing.
Author contributions
Q.W. summaried the transcriptome sequencing data, performed the data analysis and prepared the original manuscript. X.N.Z. Q.L.S. attended data re-interpreting discussion. Q.W. X.N.Z. Q.L.S. Y.S. Y.J.F. prepared the plant material and attended the transcriptomes data analyses and discussion. Y.C.L. designed the experiments, provided research platform, performed the pathway enrichment analysis, and revised the manuscript. All authors have read and approved the final manuscript.
Data availability
The sequencing data were submitted to the SRA database with the Submission numbers SUB6287579.
Competing interests
The authors declare no competing interests.
Footnotes
Publisher’s note Springer Nature remains neutral with regard to jurisdictional claims in published maps and institutional affiliations.
Supplementary information
is available for this paper at 10.1038/s41598-020-66132-4.
References
- 1.Mu T, et al. Geographical variation in arsenic, cadmium, and lead of soils and rice in the major rice producing regions of China. Science of the Total Environment. 2019;677:373–381. doi: 10.1016/j.scitotenv.2019.04.337. [DOI] [PubMed] [Google Scholar]
- 2.Dai H, Yang Z. Variation in Cd accumulation among radish cultivars and identification of low-Cd cultivars. Environmental Science and Pollution Research. 2017;24:15116–15124. doi: 10.1007/s11356-017-9061-y. [DOI] [PubMed] [Google Scholar]
- 3.Mak, M. et al. Chloride transport at plant-soil Interface modulates barley cd tolerance. Plant and Soil, 1–13 (2019).
- 4.Dai H, Yang Z, Xin J. Genotype variation in Cd accumulation and chemical forms and histochemical distribution of Cd in low-and high-Cd cultivars of Chinese leaf mustard. Fresenius Environ Bull. 2012;21:2746–2757. [Google Scholar]
- 5.Luo, J. S., Yang, Y., Gu, T., Wu, Z. & Zhang, Z. The Arabidopsis defensin gene AtPDF2. 5 mediates cadmium tolerance and accumulation. Plant, cell & environment, 10.1111/pce.13592 (2019). [DOI] [PubMed]
- 6.Zhang, Z.-H. et al. Multiomics landscapes uncover the pivotal role of subcellular reallocation of cadmium in regulating rapeseed resistance to cadmium toxicity. Journal of Experimental Botany (2019). [DOI] [PMC free article] [PubMed]
- 7.Li Y, et al. Differences of Cd uptake and expression of MT family genes and NRAMP2 in two varieties of ryegrasses. Environmental Science and Pollution Research. 2019;26:13738–13745. doi: 10.1007/s11356-018-2649-z. [DOI] [PubMed] [Google Scholar]
- 8.Tang L, et al. Knockout of OsNramp5 using the CRISPR/Cas9 system produces low Cd-accumulating indica rice without compromising yield. Scientific Reports. 2017;7:14438. doi: 10.1038/s41598-017-14832-9. [DOI] [PMC free article] [PubMed] [Google Scholar]
- 9.Zhou Q, et al. Comparative transcriptome analysis between low-and high-cadmium-accumulating genotypes of pakchoi (Brassica chinensis L.) in response to cadmium stress. Environmental science & technology. 2016;50:6485–6494. doi: 10.1021/acs.est.5b06326. [DOI] [PubMed] [Google Scholar]
- 10.Zhou M, et al. Comparative analysis of root transcriptome profiles between low-and high-cadmium-accumulating genotypes of wheat in response to cadmium stress. Functional & integrative genomics. 2019;19:281–294. doi: 10.1007/s10142-018-0646-4. [DOI] [PubMed] [Google Scholar]
- 11.Naeem A, et al. Genetic variation in cadmium accumulation and tolerance among wheat cultivars at the seedling stage. Communications in Soil Science and Plant Analysis. 2016;47:554–562. doi: 10.1080/00103624.2016.1141918. [DOI] [Google Scholar]
- 12.Sun L, et al. Genetic diversity, rather than cultivar type, determines relative grain Cd accumulation in hybrid rice. Frontiers in Plant Science. 2016;7:1407. doi: 10.3389/fpls.2016.01407. [DOI] [PMC free article] [PubMed] [Google Scholar]
- 13.Hopper DW, Ghan R, Schlauch KA, Cramer GR. Transcriptomic network analyses of leaf dehydration responses identify highly connected ABA and ethylene signaling hubs in three grapevine species differing in drought tolerance. BMC plant biology. 2016;16:118. doi: 10.1186/s12870-016-0804-6. [DOI] [PMC free article] [PubMed] [Google Scholar]
- 14.Kommadath A, et al. Gene co-expression network analysis identifies porcine genes associated with variation in Salmonella shedding. Bmc Genomics. 2014;15:452. doi: 10.1186/1471-2164-15-452. [DOI] [PMC free article] [PubMed] [Google Scholar]
- 15.Li Z, et al. Overexpressing the Sedum alfredii Cu/Zn superoxide dismutase increased resistance to oxidative stress in transgenic Arabidopsis. Frontiers in Plant Science. 2017;8:1010. doi: 10.3389/fpls.2017.01010. [DOI] [PMC free article] [PubMed] [Google Scholar]
- 16.Milc, J. et al. Comparative transcriptome profiling of the response to Pyrenochaeta lycopersici in resistant tomato cultivar Mogeor and its background genotype—susceptible Moneymaker. Functional & integrative genomics, 1–16 (2019). [DOI] [PubMed]
- 17.Das P, Samantaray S, Rout G. Studies on Cadmium Toxicity in Plants: A Review. Environmental pollution (Barking, Essex: 1987) 1997;665:29–36. doi: 10.1016/S0269-7491(97)00110-3. [DOI] [PubMed] [Google Scholar]
- 18.Dong J, Mao WH, Zhang GP, Wu F, Cai Y. Root excretion and plant tolerance to cadmium toxicity - A review. Plant, Soil and Environment. 2007;53:193–200. doi: 10.17221/2205-PSE. [DOI] [Google Scholar]
- 19.Rizwan, M. et al. Cadmium minimization in wheat: A critical review. Ecotoxicology and Environmental Safety130, 10.1016/j.ecoenv.2016.04.001 (2016). [DOI] [PubMed]
- 20.Rizwan, M. et al. A critical review on effects, tolerance mechanisms and management of cadmium in vegetables. Chemosphere182, 10.1016/j.chemosphere.2017.05.013 (2017). [DOI] [PubMed]
- 21.Rizwan, M. et al. Cadmium stress in rice: toxic effects, tolerance mechanisms and management: A critical review. Environmental Science and Pollution Research23, 10.1007/s11356-016-6436-4 (2016). [DOI] [PubMed]
- 22.Sebastian, A. & Majeti, P. Cadmium minimization in rice. A review. Agronomy for Sustainable Development34, 10.1007/s13593-013-0152-y (2013).
- 23.Békésiová B, Hraška Š, Libantová J, Moravčíková J, Matušíková I. Heavy-metal stress induced accumulation of chitinase isoforms in plants. Molecular Biology Reports. 2008;35:579–588. doi: 10.1007/s11033-007-9127-x. [DOI] [PubMed] [Google Scholar]
- 24.Moravčíková J, et al. Stress-induced expression of cucumber chitinase and Nicotiana plumbaginifoliaβ-1,3-glucanase genes in transgenic potato plants. Acta Physiologiae Plantarum. 2007;29:133–141. doi: 10.1007/s11738-006-0017-y. [DOI] [Google Scholar]
- 25.Sels J, Mathys J, De Coninck BMA, Cammue BPA, De Bolle MFC. Plant pathogenesis-related (PR) proteins: A focus on PR peptides. Plant Physiology and Biochemistry. 2008;46:941–950. doi: 10.1016/j.plaphy.2008.06.011. [DOI] [PubMed] [Google Scholar]
- 26.Mészáros P, et al. Plant chitinase responses to different metal-type stresses reveal specificity. Plant Cell Reports. 2014;33:1789–1799. doi: 10.1007/s00299-014-1657-9. [DOI] [PubMed] [Google Scholar]
- 27.Dana MdlM, Pintor-Toro JA, Cubero B. Transgenic Tobacco Plants Overexpressing Chitinases of Fungal Origin Show Enhanced Resistance to Biotic and Abiotic Stress Agents. Plant Physiology. 2006;142:722. doi: 10.1104/pp.106.086140. [DOI] [PMC free article] [PubMed] [Google Scholar]
- 28.Wang L-Y, Wang Y-S, Cheng H, Zhang J-P, Yeok FS. Cloning of the Aegiceras corniculatum class I chitinase gene (AcCHI I) and the response of AcCHI I mRNA expression to cadmium stress. Ecotoxicology. 2015;24:1705–1713. doi: 10.1007/s10646-015-1502-0. [DOI] [PubMed] [Google Scholar]
- 29.Mcloughlin F, et al. Class I and II small heat-shock proteins protect protein translation factors during heat stress. Plant Physiology. 2016;172:00536.02016. doi: 10.1104/pp.16.00536. [DOI] [PMC free article] [PubMed] [Google Scholar]
- 30.Pandey, S. et al. Abiotic Stress Tolerance in Plants: Myriad Roles of Ascorbate Peroxidase. Frontiers in Plant Science8 (2017). [DOI] [PMC free article] [PubMed]
- 31.Park CJ, Seo YS. Heat Shock Proteins: A Review of the Molecular Chaperones for Plant Immunity. Plant Pathology Journal. 2015;31:323–333. doi: 10.5423/PPJ.RW.08.2015.0150. [DOI] [PMC free article] [PubMed] [Google Scholar]
- 32.Cai SY, et al. HsfA1a upregulates melatonin biosynthesis to confer cadmium tolerance in tomato plants. Journal of Pineal Research. 2017;62:e12387. doi: 10.1111/jpi.12387. [DOI] [PubMed] [Google Scholar]
- 33.Reddy GN, Prasad M. Cadmium-induced protein phosphorylation changes in rice (Oryza sativa L.) seedlings. Journal of Plant Physiology. 1995;145:67–70. doi: 10.1016/S0176-1617(11)81848-1. [DOI] [Google Scholar]
- 34.Wang A, et al. Overexpression of a small heat-shock-protein gene enhances tolerance to abiotic stresses in rice. Plant Breeding. 2015;134:384–393. doi: 10.1111/pbr.12289. [DOI] [Google Scholar]
- 35.Wang W, Vinocur B, Shoseyov O, Altman A. Role of plant heat-shock proteins and molecular chaperones in the abiotic stress response. Trends in Plant Science. 2004;9:244–252. doi: 10.1016/j.tplants.2004.03.006. [DOI] [PubMed] [Google Scholar]
- 36.Rajan V, D’Silva VB, Arabidopsis P. thaliana J-class heat shock proteins: cellular stress sensors. Functional & Integrative Genomics. 2009;9:433. doi: 10.1007/s10142-009-0132-0. [DOI] [PubMed] [Google Scholar]
- 37.Kong F, et al. A chloroplast-targeted DnaJ protein contributes to maintenance of photosystem II under chilling stress. Journal of Experimental Botany. 2013;65:143–158. doi: 10.1093/jxb/ert357. [DOI] [PMC free article] [PubMed] [Google Scholar]
- 38.Lee KW, et al. Overexpression of the alfalfa DnaJ-like protein (MsDJLP) gene enhances tolerance to chilling and heat stresses in transgenic tobacco plants. Turk J Biol. 2018;42:12–22. doi: 10.3906/biy-1705-30. [DOI] [PMC free article] [PubMed] [Google Scholar]
- 39.Yamaji N, Ma JF. The node, a hub for mineral nutrient distribution in graminaceous plants. Trends in Plant Science. 2014;19:556–563. doi: 10.1016/j.tplants.2014.05.007. [DOI] [PubMed] [Google Scholar]
- 40.Fujimaki S, et al. Tracing cadmium from culture to spikelet: noninvasive imaging and quantitative characterization of absorption, transport, and accumulation of cadmium in an intact rice plant. Plant Physiology. 2010;152:1796–1806. doi: 10.1104/pp.109.151035. [DOI] [PMC free article] [PubMed] [Google Scholar]
- 41.Feng X, et al. Ionomic and transcriptomic analysis provides new insight into the distribution and transport of cadmium and arsenic in rice. Journal of hazardous materials. 2017;331:246–256. doi: 10.1016/j.jhazmat.2017.02.041. [DOI] [PubMed] [Google Scholar]
- 42.Yamaguchi N, et al. Role of the node in controlling traffic of cadmium, zinc, and manganese in rice. Journal of Experimental Botany. 2012;63:2729–2737. doi: 10.1093/jxb/err455. [DOI] [PMC free article] [PubMed] [Google Scholar]
- 43.Clemens S. Molecular mechanisms of plant metal tolerance and homeostasis. Planta. 2001;212:475–486. doi: 10.1007/s004250000458. [DOI] [PubMed] [Google Scholar]
- 44.Himelblau E, Amasino RM. Delivering copper within plant cells. Current Opinion in Plant Biology. 2000;3:205–210. doi: 10.1016/S1369-5266(00)80066-7. [DOI] [PubMed] [Google Scholar]
- 45.Puig S, Thiele DJ. Molecular mechanisms of copper uptake and distribution. Current Opinion in Chemical Biology. 2002;6:171–180. doi: 10.1016/S1367-5931(02)00298-3. [DOI] [PubMed] [Google Scholar]
- 46.Desbrosses-Fonrouge A-G, et al. Arabidopsis thaliana MTP1 is a Zn transporter in the vacuolar membrane which mediates Zn detoxification and drives leaf Zn accumulation. FEBS Letters. 2005;579:4165–4174. doi: 10.1016/j.febslet.2005.06.046. [DOI] [PubMed] [Google Scholar]
- 47.Zhao J, et al. Genome-wide association study and candidate gene analysis of rice cadmium accumulation in grain in a diverse rice collection. Rice. 2018;11:61. doi: 10.1186/s12284-018-0254-x. [DOI] [PMC free article] [PubMed] [Google Scholar]
- 48.Sasaki A, Yamaji N, Ma JF. Overexpression of OsHMA3 enhances Cd tolerance and expression of Zn transporter genes in rice. Journal of experimental botany. 2014;65:6013–6021. doi: 10.1093/jxb/eru340. [DOI] [PMC free article] [PubMed] [Google Scholar]
- 49.Anders S. Analysing RNA-Seq data with the DESeq package. Mol Biol. 2010;43:1–17. [Google Scholar]
- 50.Langfelder P, Horvath S. WGCNA: an R package for weighted correlation network analysis. BMC bioinformatics. 2008;9:559. doi: 10.1186/1471-2105-9-559. [DOI] [PMC free article] [PubMed] [Google Scholar]
- 51.Kanehisa M, et al. KEGG for linking genomes to life and the environment. Nucleic Acids Research. 2007;36:D480–D484. doi: 10.1093/nar/gkm882. [DOI] [PMC free article] [PubMed] [Google Scholar]
Associated Data
This section collects any data citations, data availability statements, or supplementary materials included in this article.
Supplementary Materials
Data Availability Statement
The sequencing data were submitted to the SRA database with the Submission numbers SUB6287579.


