Abstract
Background:
Growth abnormalities in single ventricle survivors may reduce quality of life (QoL) and exercise capacity.
Methods:
This multicenter, longitudinal analysis evaluated changes in height and body mass index (BMI) compared to population norms and their relationship to mortality, ventricular morphology, QoL, and exercise capacity in the Pediatric Heart Network (PHN) Fontan studies.
Results:
Fontan1 (F1) included 546 participants (12±3.4 yrs.), Fontan 2 (F2) 427 (19±3.4 yrs.), and Fontan 3 (F3) 362 (21±3.5 yrs.), ~60% male at each time-point. Height z-score was −0.67±−1.27, −0.60±1.34, and −0.43±1.14 at F1-F3, lower compared to norms at all time-points (p≤0.001). BMI z-score was similar to population norms. Compared to survivors, participants who died had lower height z-score (p≤0.001). Participants with dominant right ventricle (n=112) had lower height z-score (p≤0.004), compared to dominant left (n=186) or mixed (n=64) ventricular morphologies. Higher height z-score was associated with higher PedsQL for the total score (slope=2.82±0.52; p≤0.001). Increase in height z-score (F1 to F3) was associated with increased oxygen consumption (slope=2.61±1.08; p=0.02), whereas, for participants >20 years old, an increase in BMI (F1 to F3) was associated with a decrease in oxygen consumption (slope=−1.25±0.33; p≤0.001).
Conclusions:
Fontan survivors, especially those with right ventricular morphology, are shorter when compared to the normal population, but have similar BMI. Shorter stature was associated with worse survival. An increase in height z-score over the course of the study was associated with better QoL and exercise capacity; an increase in BMI was associated with worse exercise capacity.
Keywords: Fontan, anthropometry
Introduction
A majority of children born with single ventricle physiology are now expected to survive into adulthood. Patients with single ventricle physiology typically undergo three complex staged palliative procedures culminating in a Fontan circulation. Although the Fontan procedure provides satisfactory surgical palliation separating the deoxygenated and oxygenated blood [1], it leaves these patients with suboptimal hemodynamics and a chronic low cardiac output state, exercise intolerance, hepatic dysfunction, increased gastrointestinal protein loss, abnormal bone mineralization and other metabolic disorders, predisposing them to a life-long risk of abnormal anthropometric indices [2], [3].
It is well known that there are severe growth abnormalities in single ventricle infants and these growth abnormalities are associated with worse outcomes [4],[5],[6]. Growth abnormalities in older children and young adults in a multitude of chronic diseases are known to adversely affect quality of life (QoL) and exercise performance [2],[7]. However, there is a lack of robust longitudinal studies evaluating anthropometric changes in Fontan survivors, and the effects of specific abnormalities in anthropometric measurements on QoL and exercise performance in this population are unknown. As surgical mortality declines, the focus of clinical care and surgical modifications has turned to reducing morbidity and improving health and QoL outcomes [8] as long-term management strategies.
The aims of this study were to evaluate longitudinal changes in height and BMI in Fontan survivors and (1) compare them to population norms, (2) examine their associations with survival and ventricular morphology, (3) assess their relationship with QoL, and (4) assess their association with changes in exercise capacity.
Methods
This study is a multicenter longitudinal analysis of the Pediatric Heart Network (PHN) data from the Fontan studies: Fontan 1 (F1), Fontan 2 Follow-up (F2), and Fontan 3 Follow-up (F3), at the 7 original PHN Centers. Briefly, F1 was designed as a prospective, cross-sectional study of children who had undergone a palliative Fontan procedure. F1 enrolled 546 children, 6–19 years of age at enrollment from 2003–2004 [9]. F2 was limited to the reassessment of vital status and functional health status, with 427 of the original cohort enrolled, ages 13–26 years (2009–2011) [10]. Participants were re-contacted between 2013 and 2014 and 362 participants, ages15–29 years, enrolled in F3. This was a reassessment of vital and health status as well as repeat measures of ventricular function and exercise performance during a time in which many of the original F1 participants were transitioning to adulthood. [5] Participants were excluded from participating in F3 if they had undergone conversion to a biventricular circulation, had a heart transplant or died. Annual follow up continues on the F3 cohort assessing vital status. All three Fontan studies were approved by local Institutional Review Boards. Consent and assent were obtained per institutional requirements at each time point.
Height and BMI: Height and BMI data were obtained from standardized height and weight measurements completed at F1 and F3 and self-report or medical record review for F2. Height and BMI z-scores were calculated using Centers for Disease Control and Prevention (CDC) algorithms [11] for those age ≤ 20 years old. Height z-score was used for all participants, with z-scores for those aged >20 years calculated using norms at age 20 years. BMI z-score was used for participants aged less than 20 years. This was consistent with previously published BMI data in children who have undergone the Fontan procedure [2]. Due to lack of BMI z-scores for participants older than 20 years, raw calculated BMI was used. The NHANES III data for the normal US population was used to classify participants >20 years as normal or overweight/obese. [12]
Survival and Heart Transplant: Vital and cardiac transplantation status was determined by medical record review supplemented by public records (e.g., the Social Security Index, National Death Index, or other local public death records) as needed. Participants were considered alive if there was no date of death reported or identified at the time of the data freeze for this analysis in 2018. Fourteen participants (2%) underwent heart transplant and were excluded from this analysis.
Ventricular morphology: A central echo core lab defined ventricular morphology as right ventricular (RV), left ventricular (LV) or mixed [9].
Quality of Life: QoL was assessed at F2 and F3 in patients using the Pediatric Quality of Life Inventory (PedsQL) 4.0 Generic Core Scales and the PedsQL Cardiac Module. Items are linearly transformed to a 0 to 100 scale, with higher scores denoting better QoL. The PedsQL Generic Core Scales and the PedsQL Cardiac Module have been demonstrated to be reliable and valid [13] [14] in participants with congenital heart disease, including single ventricle patients. The PedsQLCardiac Module has 6 scales related to symptoms, treatment barriers (for patients on medications), perceived physical appearance, treatment anxiety, cognitive problems, and communication. QoL was also assessed at the time of F1. However, it was not included in this analysis because the Child Health Questionnaire (CHQ)-Parent Form (PF)-50 was used rather than the PedsQL.
Exercise stress test: At F1 and F3, participants who were at least 132 cm tall and free of neurological or developmental impairments that precluded exercise underwent maximal exercise testing [9]. The ramp protocol on an electronically braked cycle ergometer was interpreted at the local sites. Exercise capacity was measured by maximum oxygen consumption (VO2 max).
The study was supported by grants (HL068270, HL068290, HL 109673, HL109737, HL109741, HL109741, HL109743, HL109777, HL109778, HL109781, HL109816, HL109818) from the National Heart, Lung, and Blood Institute, NIH. The authors are solely responsible for the design and conduct of this study, all study analyses, the drafting and editing of the paper and its final contents.
Statistical Analysis
Height and BMI trends over time were assessed using LOESS non-linear curve fitting across all time periods combined. Although this curve fitting did not take into account the longitudinal structure of the data, it was still useful for illustrative purposes. At each time-point, height and BMI were compared to population norms using one-sample t-tests. Trends in growth were evaluated with repeated measures linear regression models (visits at F1, F2, F3) to evaluate effects of age on height and BMI. An unstructured covariance model was utilized as it demonstrated the best fit statistics (−2 Res log likelihood, AIC, AICC, BIC).
Repeated measures regression models were used to assess height and BMI by ventricular type, controlling for age. Repeated measures logistic regression models were used to assess the association between death and growth measures, controlling for age and ventricular type. The relationship of height and BMI to QoL (PedsQL) was analyzed using repeated measures multivariable regression, controlling for gender, age, race, family income, caregiver education, and ventricular type. Lastly, the associations between change in height and BMI (F1 to F3) and change in exercise capacity (F1 to F3) were assessed using linear regression models, controlling for exercise capacity at F1, gender, age at last Fontan, age at stage 2, Fontan type, and ventricle type.
All analyses were conducted using SAS v9.4 (SAS Institute Inc., Cary, NC), and statistical significance was tested at level 0.05.
Results
Participant characteristics are described in Table 1. There were 546 participants at the time of F1, 427 at F2 and 362 at F3. Attrition was due to a combination of loss to follow up, transplant, death, and participants’ unwillingness to consent (Table 1). Approximately 60% were males at all three time-points with mean ages of all participants 12 years (SD± 3.4 years) at F1, 19 years (SD± 3.4 years) at F2 and 21 years (SD± 3.5 years) at F3. The proportion of dominant ventricular morphology remained unchanged across all three time-points and the proportions of specific (RV, LV and mixed) ventricular morphology remained the same across time-points (Table 1), with approximately one-third being right ventricular, half left ventricular and the remaining mixed.
Table 1:
Demographics of the Fontan Cohort
| Fontan 1 2003–2004 |
Fontan 2 2009–2011 |
Fontan 3 2013–2014 |
|
|---|---|---|---|
| N | 546 | 427 | 362 |
| Males (n, %) | 329 (60%) | 249 (58%) | 221 (61%) |
| Mean age (yrs; mean±SD) | 12 ± 3.4 | 19 ± 3.4 | 21 ± 3.5 |
| Transplanted before next study visit (n) | NA | 13 | 1 |
| Death before next study visit (n) | 16 | 10 | 6 |
| Lost to Follow-up or unwilling to consent (n) | NA | 80 (from F1-F2) | 58 (from F2-F3) |
| Anthropometry | |||
| Height z-scores (mean±SD) | −0.67 ± 1.27 (N=544) | −0.60 ± 1.34 (N=423) | −0.43 ± 1.14 (N=362) |
| BMI z-scores (ages ≤20 years; mean±SD) | −0.05 ± 1.13 (N=544) | −0.06 ± 1.26 (N=288) | −0.15 ± 1.27 (N=161) |
| BMI (ages >20 years; mean±SD) | NA | 24.08 ± 4.22 (N=135) | 24.38 ± 4.81 (N=201) |
| Change in Anthropometry | |||
| Change in Height z-scores from F1 (mean±SD) | NA |
0.04±0.91 (N=421) |
0.17±0.85 (N=361) |
| Change in BMI z-scores from F1 (ages ≤20 years; mean±SD) | NA |
0.08±0.92 (N=421) |
0.13±0.95 (N=361) |
| Change in BMI from F2 (ages >20 years; mean±SD) | NA | NA |
3.99±3.58 (N=102) |
| Ventricular Morphology | |||
| RV (n, %) | 184 (34%) | 140 (33%) | 112 (31%) |
| LV (n, %) | 265 (48%) | 214 (50%) | 186 (51%) |
| Mixed (n, %) | 97 (18%) | 73 (17%) | 64 (18%) |
| Quality of Life | |||
| PedsQL | |||
| Total PedsQL Score | NA |
74.19±16.15 (N=405) |
74.67±16.36 (N=362) |
| Physical Functioning | NA |
74.69±18.24 (N=403) |
74.21±19.38 (N=362) |
| Perceived Physical Appearance | NA |
76.93±23.71 (N=401) |
79.49±23.96 (N=362) |
| Emotional functioning | NA |
73.67±20.55 (N=403) |
73.54±21.37 (N=362) |
| Social functioning | NA |
78.24±20.28 (N=404) |
79.64±18.52 (N=362) |
| School functioning | NA |
70.21±19.93 (N=402) |
71.21±20.25 (N=362) |
| Psychosocial health summary | NA |
73.98±16.90 (N=404) |
74.92±16.80 (N=362) |
| Health problems and treatment | NA |
68.24±19.53 (N=405) |
68.74±18.92 (N=362) |
| Treatment II | NA |
89.00±13.32 (N=352) |
77.54±33.76 (N=362) |
| Treatment anxiety | NA |
81.06±23.76 (N=403) |
82.99±22.50 (N=362) |
| Cognitive problem | NA |
67.23±22.64 (N=402) |
68.57±22.65 (N=362) |
| Communication problem | NA |
72.88±25.01 (N=401) |
74.26±24.37 (N=362) |
| Exercise Testing | |||
| VO2 Max (mean±SD) |
64.55±16.41 (N=403) |
NA |
58.15±17.12 (N=336) |
| Change in VO2 Max from F1 (mean±SD) | NA | NA | −7.36±16.83 (N=264) |
Anthropometry
Height: The mean height z-score of participants was −0.67±−1.27 at F1, −0.60 ±1.34 at F2, −0.43±1.14 at F3. Height of the Fontan cohort, both males and females, was below the mean for the normal population (p≤0.001; Figure 1) at all time-points.
Figure 1:
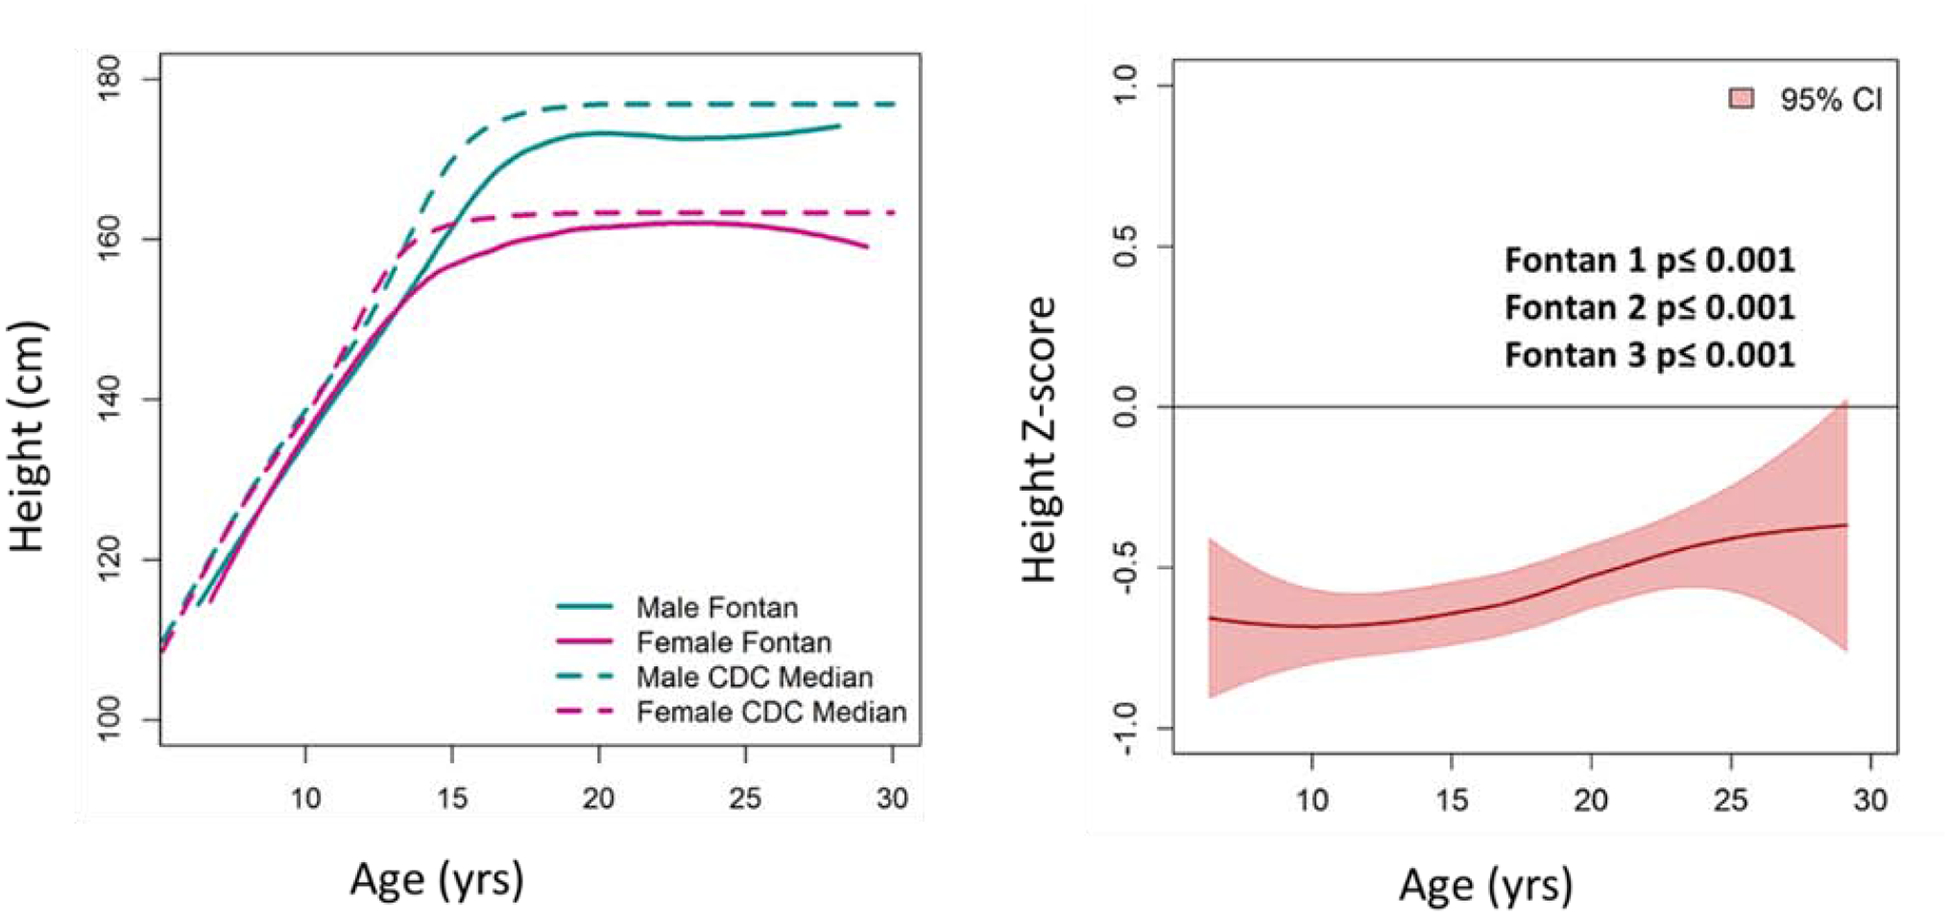
Height Comparison of the Fontan Cohort with the Normal Population. (A) Heights of male and female Fontan participants were lower than CDC norms. (B) Average height z-score of the Fontan cohort was below normal (Z=0) across ages and study time-points.
BMI: The mean BMI z-score was −0.05±1.00, −0.059±1.26, and −0.15±1.27 for F1, F2 and F3, respectively. BMI z-scores for both male and female Fontan participants, age ≤ 20 years, were not significantly different from the normal population (Figure 2). In adult participants >20 years at F2 and F3, 41% (CI 34–48%) of the males and 33% (CI 26–41%) of the females were overweight or obese. The prevalence of overweight and obesity in adults, age > 20 years, in the study cohort was lower than the general US population (p<0.001) (Figure 3).
Ventricular Morphology
Participants with dominant right ventricle (n=112) had lower height z-score (p=0.004), but did not differ by BMI (z-scores ≤20 years p=0.79 and BMI >20 years p=0.73), compared to dominant left or mixed ventricular morphologies (Figure 4).
Figure 4:
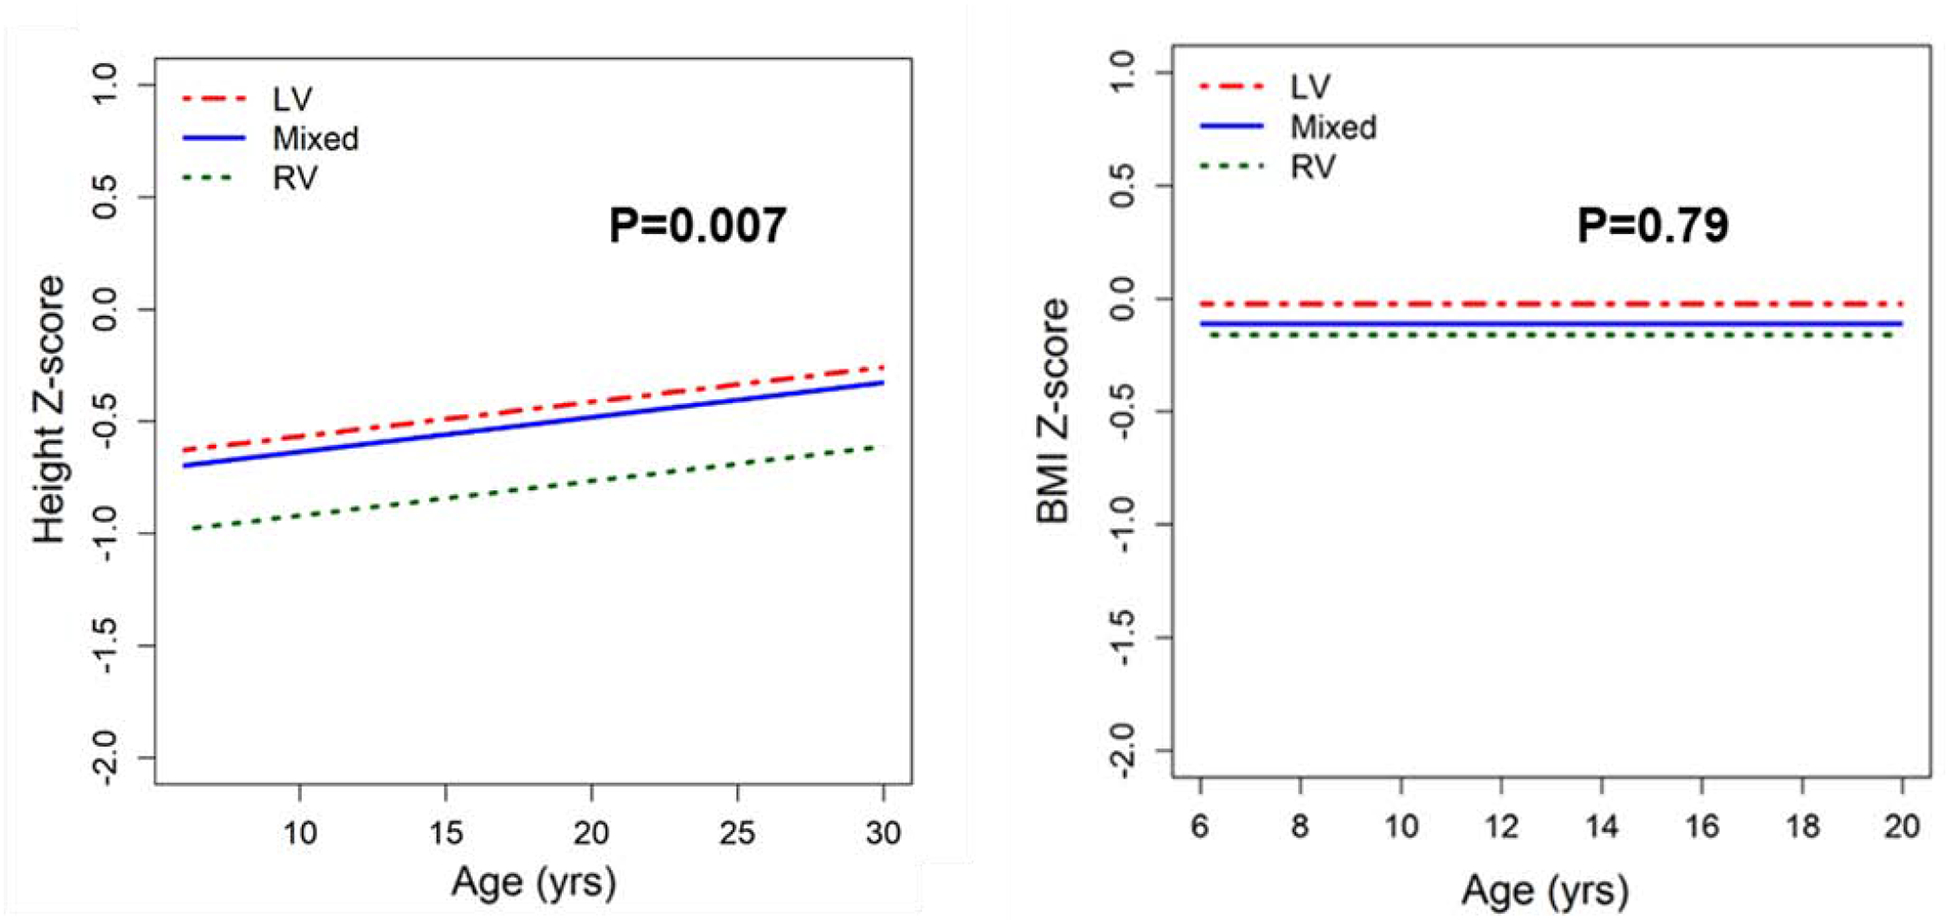
Comparisons of Height and BMI z-scores by Ventricular Morphology-Fontan participants with RV dominant morphology compared to left and mixed ventricular morphologies had lower height z-score (p=0.007: −0.35±0.11 RV vs. LV; −0.28±0.15 RV vs. mixed), but did not differ by BMI z-score (p=0.79: −0.04±0.11 RV vs. LV; −0.05±0.14 RV vs. mixed).
Survivors vs. Non-Survivors
Anthropometric data were compared between survivors and non-survivors, including data up to the last study visit prior to death. Overall, there were 32 deaths in this cohort, with height and BMI z-scores available at F1 for all 32 participants. Sixteen deaths occurred between F1 and F2. Ten deaths occurred between F2 and F3 and 6 deaths occurred after F3 during annual follow up.
Figure 5A depicts the height z-scores of survivors and non-survivors by age. Participants who died had lower height z-score (−1.55±1.63, n=32 at F1, −2.01±2.32, n=14 at F2, and −1.94±2.74, n=5 at F3) compared to survivors, even when controlling for age and ventricular type (p<0.001). Participants who died had a trend toward lower BMI z-score (F1 −0.33 ± 1.32 n=32, F2 −0.49 ± 1.27, n=10; p=0.09), but this was not significant (Figure 5B). BMI for those who died after age >20 years (F2 21.24 ± 2.89 n=4, F3 19.19 ± 2.59, n=5) was lower than for survivors, but the small sample size precluded statistical testing.
Figure 5A and 5B:
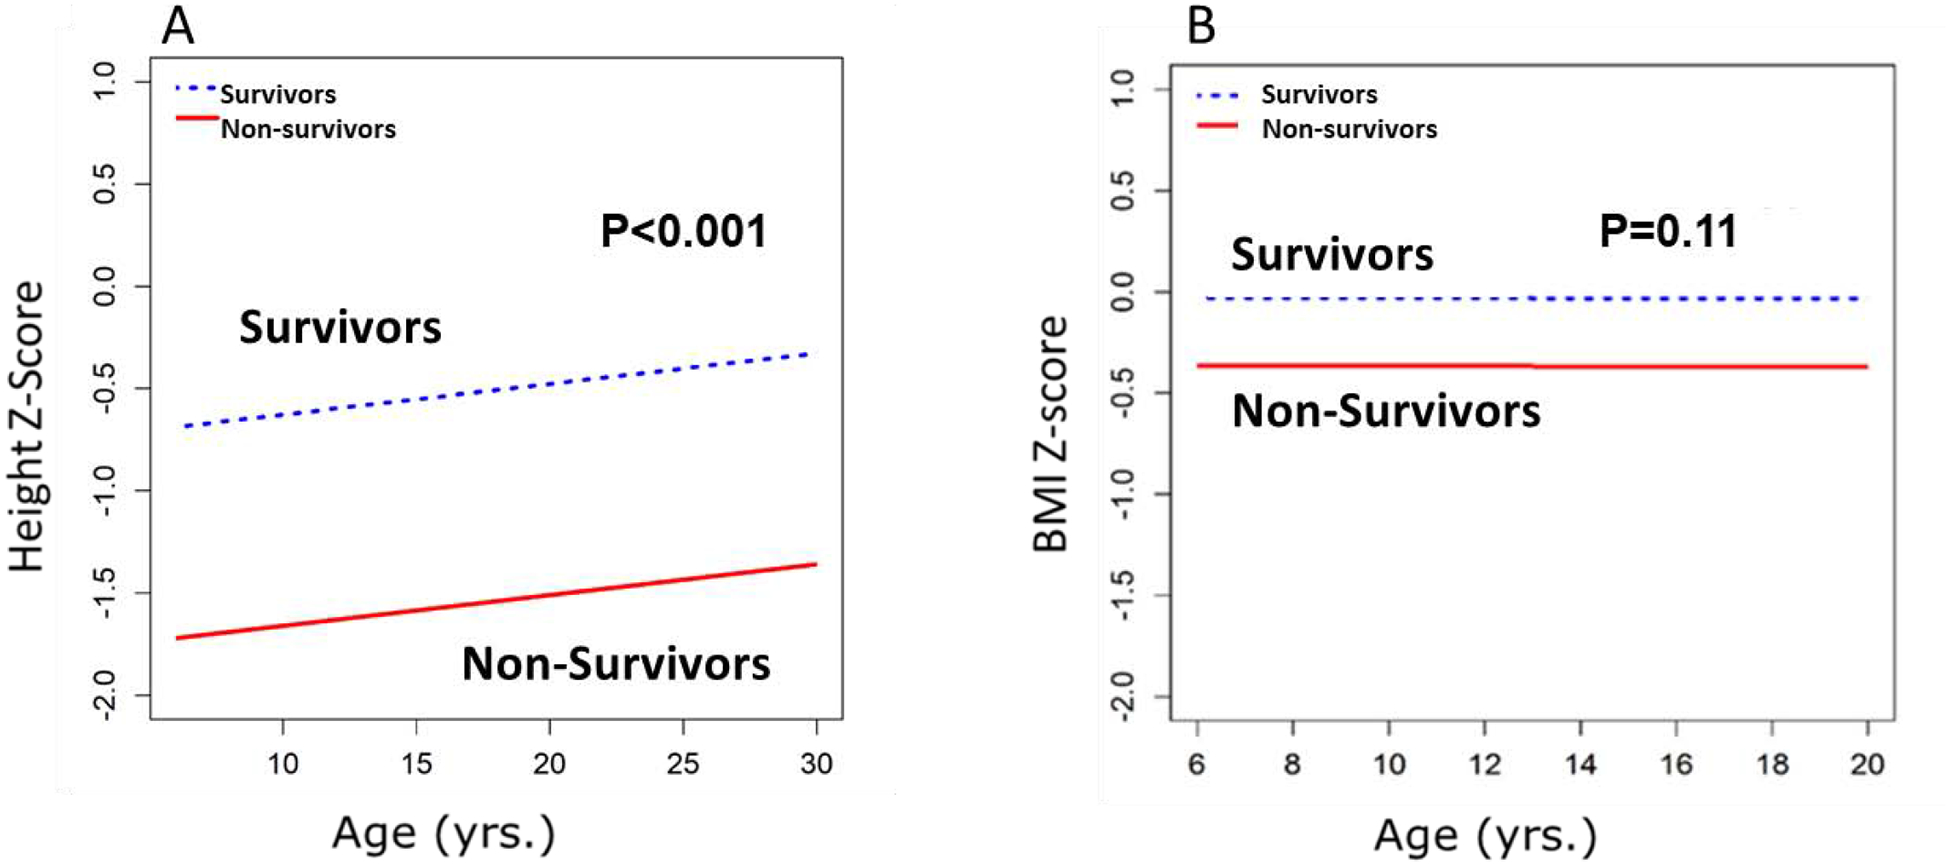
Comparisons of Height and BMI z-scores for Fontan Survivors vs. Non-survivors (N=32 non-survivors). Odds of death were lower with increasing height z-score: p<0.001; OR=0.56 [95% CI: 0.46, 0.68], but did not change with increasing BMI z-score: p=0.11; OR=0.82 [95% CI: 0.64, 1.05]. All 32 non-survivors had data on height and BMI at F1. Of the 16 deaths after F2, 14 participants had data on height and BMI, with 4 of these participants over age 20. Of the 6 deaths after F3, 5 participants had data on height and BMI at F3; all of them were over age 20.
QoL
At F2 and F3, higher height z-score was associated with higher PedsQL total score (p<0.001) and physical function subdomain score (p<0.001) (Table 2). However, BMI z-score (age ≤20) and BMI (age >20) were not associated with PedsQL total score (p=0.58, 0.15) or physical function subdomain score (p= 0.14, 0.19).
Table 2.
| Height z-score All ages | BMI z-score Age ≤20 years | BMI Age >20 years | |||||||
|---|---|---|---|---|---|---|---|---|---|
| Slope | SE | p-value | Slope | SE | p-value | Slope | SE | p-value | |
| QoL | |||||||||
| Total PedsQL Score | 2.73 | 0.52 | <0.001 | −0.39 | 0.69 | 0.58 | −0.32 | 0.22 | 0.15 |
| Physical Functioning | 2.83 | 0.61 | <0.001 | −1.16 | 0.78 | 0.14 | −0.35 | 0.26 | 0.19 |
| Perceived Physical Appearance | 1.28 | 0.80 | 0.11 | −1.42 | 1.01 | 0.16 | −0.16 | 0.35 | 0.64 |
| Emotional functioning | 2.13 | 0.70 | 0.003 | 0.51 | 0.91 | 0.57 | −0.33 | 0.30 | 0.27 |
| Social functioning | 3.59 | 0.63 | <0.001 | −0.20 | 0.86 | 0.81 | −0.23 | 0.26 | 0.38 |
| School functioning | 2.27 | 0.65 | <0.001 | −0.34 | 0.86 | 0.69 | −0.36 | 0.27 | 0.19 |
| Psychosocial health summary | 2.58 | 0.55 | <0.001 | 0.03 | 0.73 | 0.96 | −0.33 | 0.23 | 0.15 |
| Health problems and treatment | 1.71 | 0.62 | 0.006 | −0.52 | 0.81 | 0.52 | −0.45 | 0.26 | 0.08 |
| Treatment II | −1.27 | 0.90 | 0.16 | −0.56 | 0.90 | 0.53 | −0.29 | 0.46 | 0.53 |
| Treatment anxiety | −0.77 | 0.77 | 0.32 | 0.05 | 0.96 | 0.96 | −0.57 | 0.33 | 0.09 |
| Cognitive problem | 2.20 | 0.74 | 0.003 | −0.18 | 0.94 | 0.84 | −0.01 | 0.32 | 0.98 |
| Communication problem | 1.00 | 0.83 | 0.23 | 0.36 | 1.06 | 0.73 | −0.27 | 0.36 | 0.46 |
| Change in Height z-score All ages | Change in BMI z-score Age ≤20 years | Change inBMI Age >20 years | |||||||
| Slope | SE | p-value | Slope | SE | p-value | Slope | SE | p-value | |
| Exercise Capacity | |||||||||
| VO2 max | 2.61 | 1.08 | 0.02 | −2.02 | 1.83 | 0.27 | −1.25 | 0.33 | <0.001 |
SE=standard error
repeated measures multivariable regression, controlling for gender, age, race, family income, caregiver education, and ventricular type.
linear regression models, controlling for exercise capacity at F1, gender, age at last Fontan, age at stage 2, Fontan type, and ventricle type.
Exercise Capacity
An increase in height z-score from F1 to F3 was associated with an increase in exercise capacity measured by VO2 max (p=0.02), whereas an increase in BMI in those >age 20 was associated with reduction in VO2 max (p<0.001) (Table 2).
Discussion
Although anthropometric aberrations in infants with single ventricle heart defects are well known, there remains a lack of longitudinal data on anthropometric changes and the impact on survival, QoL, and exercise performance. The PHN-sponsored Fontan studies provided a unique opportunity for longitudinal analysis spanning 10 years. We sought to evaluate longitudinal changes in height and BMI over three time-points (F1, F2, F3) to compare with population norms and evaluate the relationship to mortality, ventricular morphology, QoL, and exercise capacity in a large group of well-characterized Fontan patients at multiple centers. The salient findings of this study were that Fontan survivors were shorter when compared to the normal population. However, in survivors <20 years of age, BMI was similar to the normal population. For subjects ≥ 20 years, prevalence of obesity and overweight was lower compared to population norms. Interestingly, height was lower in subjects with RV morphology. Fontan subjects who were taller had better QoL and lower mortality. On longitudinal follow-up, greater height gain was associated with increased exercise capacity. On the contrary, increase in BMI in adults was associated with reduced exercise capacity.
The key finding of reduced height in Fontan survivors on longitudinal follow-up compared to CDC population norms is similar to a previous cross-sectional study in the same population, which reported lower height z-scores in children following the Fontan procedure [2]. In our study, participants who died were among the shortest in the cohort. We speculate that lower height in Fontan subjects may be a marker for sicker participants with poor hemodynamics and higher risk of mortality. It is plausible that there are common risk factors for shorter height and mortality. Subjects with dominant RV in this study were shorter than those with dominant LV or mixed ventricular morphology. Although the pathophysiological mechanism for these findings are unknown and beyond the scope of this study, it is possible that participants with hypoplastic left ventricle and a dominant right ventricle had worse hemodynamics or comorbidities compared to those with a dominant left ventricle or combined ventricular morphology. In a recent single center prospective study of 395 patients [15], those with dominant RV, both with and without hypoplastic left heart syndrome, had a higher incidence of death or transplant due to heart failure. The alteration in neurohormonal mechanism, either primarily or secondarily to low cardiac output and poor hemodynamics, may negatively impact height gain in the dominant RV cohort. There was no difference in BMI Z scores (≤20 years) between study subjects and the normal population.
The prevalence of overweight/obesity in participants > 20 years of age (male 41% and female 33%) was significantly lower when compared to the normal population, where the prevalence of overweight and obesity is 70.2%. [12]. This is consistent with a study by Chung, et.al, [16], where 39% of adult Fontan patients were overweight (22%) or obese (17%). Although the prevalence of overweight/obesity was lower in our study population compared to norms, overweight/obese subjects clearly had adverse outcomes indicating the deleterious effects of overweight/obesity as an important comorbidity in congenital heart disease. [17], [7]
QoL findings in our study were consistent with previous studies in which abnormal anthropometry was associated with lower overall and physical appearance scores [18], [2]. Our study showed that the Peds QL total and physical function scores are negatively impacted by lower height z-score. It has been previously shown that Fontan participants have lower physical functioning compared to their normal peers [8]. Although the factors associated with poorer physical function and overall QoL in this population are not completely understood, given the relationship of height with mortality, it may be that those who are shorter are sicker or have additional comorbidities that may predispose them to lower QoL. Other independent mechanisms, like lower self-esteem associated with short stature, may also contribute to lower QoL [19].
We found that participants whose height z-score increased from F1 to F3 had improved exercise capacity. This finding provides more credence to the speculation that taller stature and height gain are markers of better overall hemodynamic and health status that leads to improved survival, QoL and exercise performance. Increase in BMI in the adults, but not the children, was associated with reduced exercise performance. Increased weight may be a marker for a sedentary lifestyle and/or poor hemodynamics resulting in lower physical activity and increased weight gain. In recent studies, exercise training was found to be beneficial and safe after the Fontan, resulting in improved exercise capacity and self-reported QoL. [20], [21] Thus, encouraging regular physical exercise could potentially improve not only exercise performance, but quality of life.
Limitations
Not all participants who were alive consented to F2 and F3, and not all data were collected for all consented participants. Like other longitudinal studies, study dropout, loss to follow-up, and deaths may have created some selection bias and favored those participants who were well enough to complete most of the study testing. However, prospective study design, relatively large numbers and excellent follow-up overcome some of these limitations.
Conclusions
Fontan survivors are shorter compared to the normal population, but have similar BMI in those less than 20 years old on longitudinal follow up. However, the prevalence of obesity/overweight in young adult Fontan survivors was significantly lower than the general population. Fontan subjects with lower height had higher mortality and were more likely of single RV morphology, whereas taller Fontan survivors had better total QoL and physical functioning scores. A larger height gain on follow-up was associated with increased exercise capacity. On the contrary, an increase in BMI in adult Fontan survivors was associated with reduction in exercise capacity. Worse survival and QoL in shorter Fontan subjects likely point to common risk factors for survival and height gain. Future studies should target the pathophysiology of height gain in the Fontan population to improve outcomes.
Figure 2:
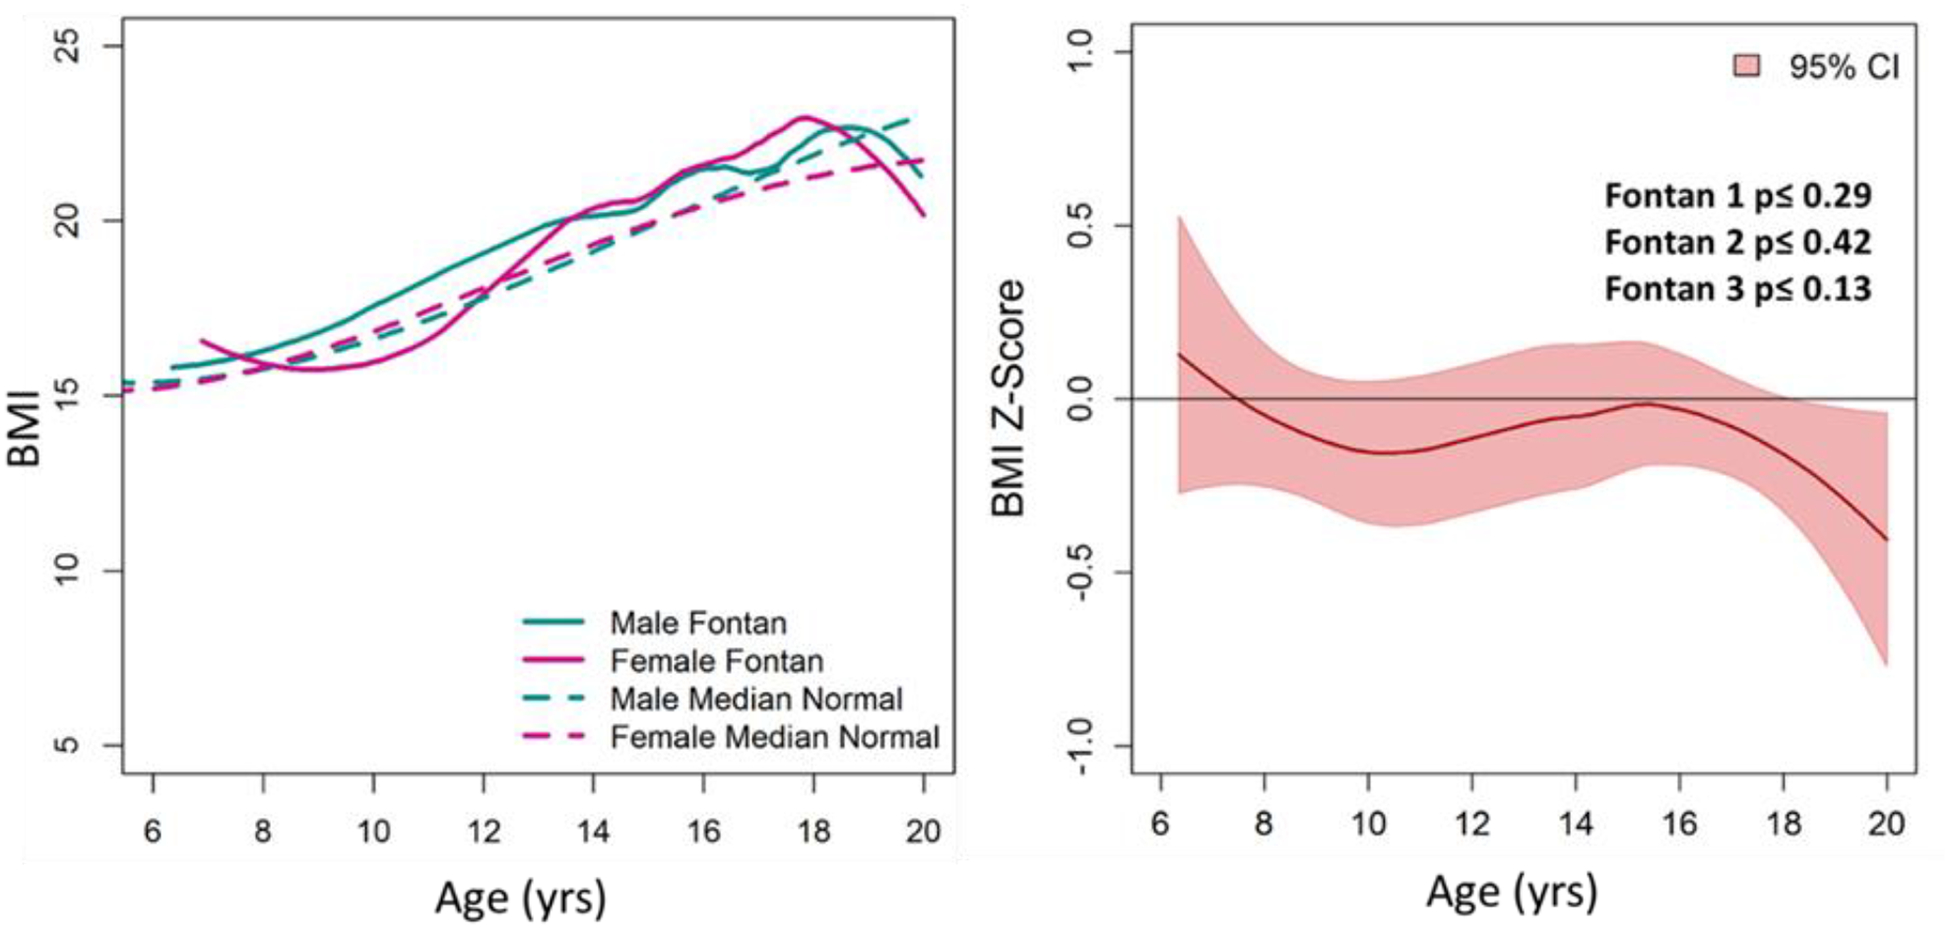
BMI Comparison of the Fontan Cohort with the Normal Population. (A) BMI of male and female Fontan participants was similar to CDC norms. (B) Average BMI z-score (for age≤20 years) of the Fontan cohort was similar to normal (Z=0) across ages and study time-points.
Figure 3:
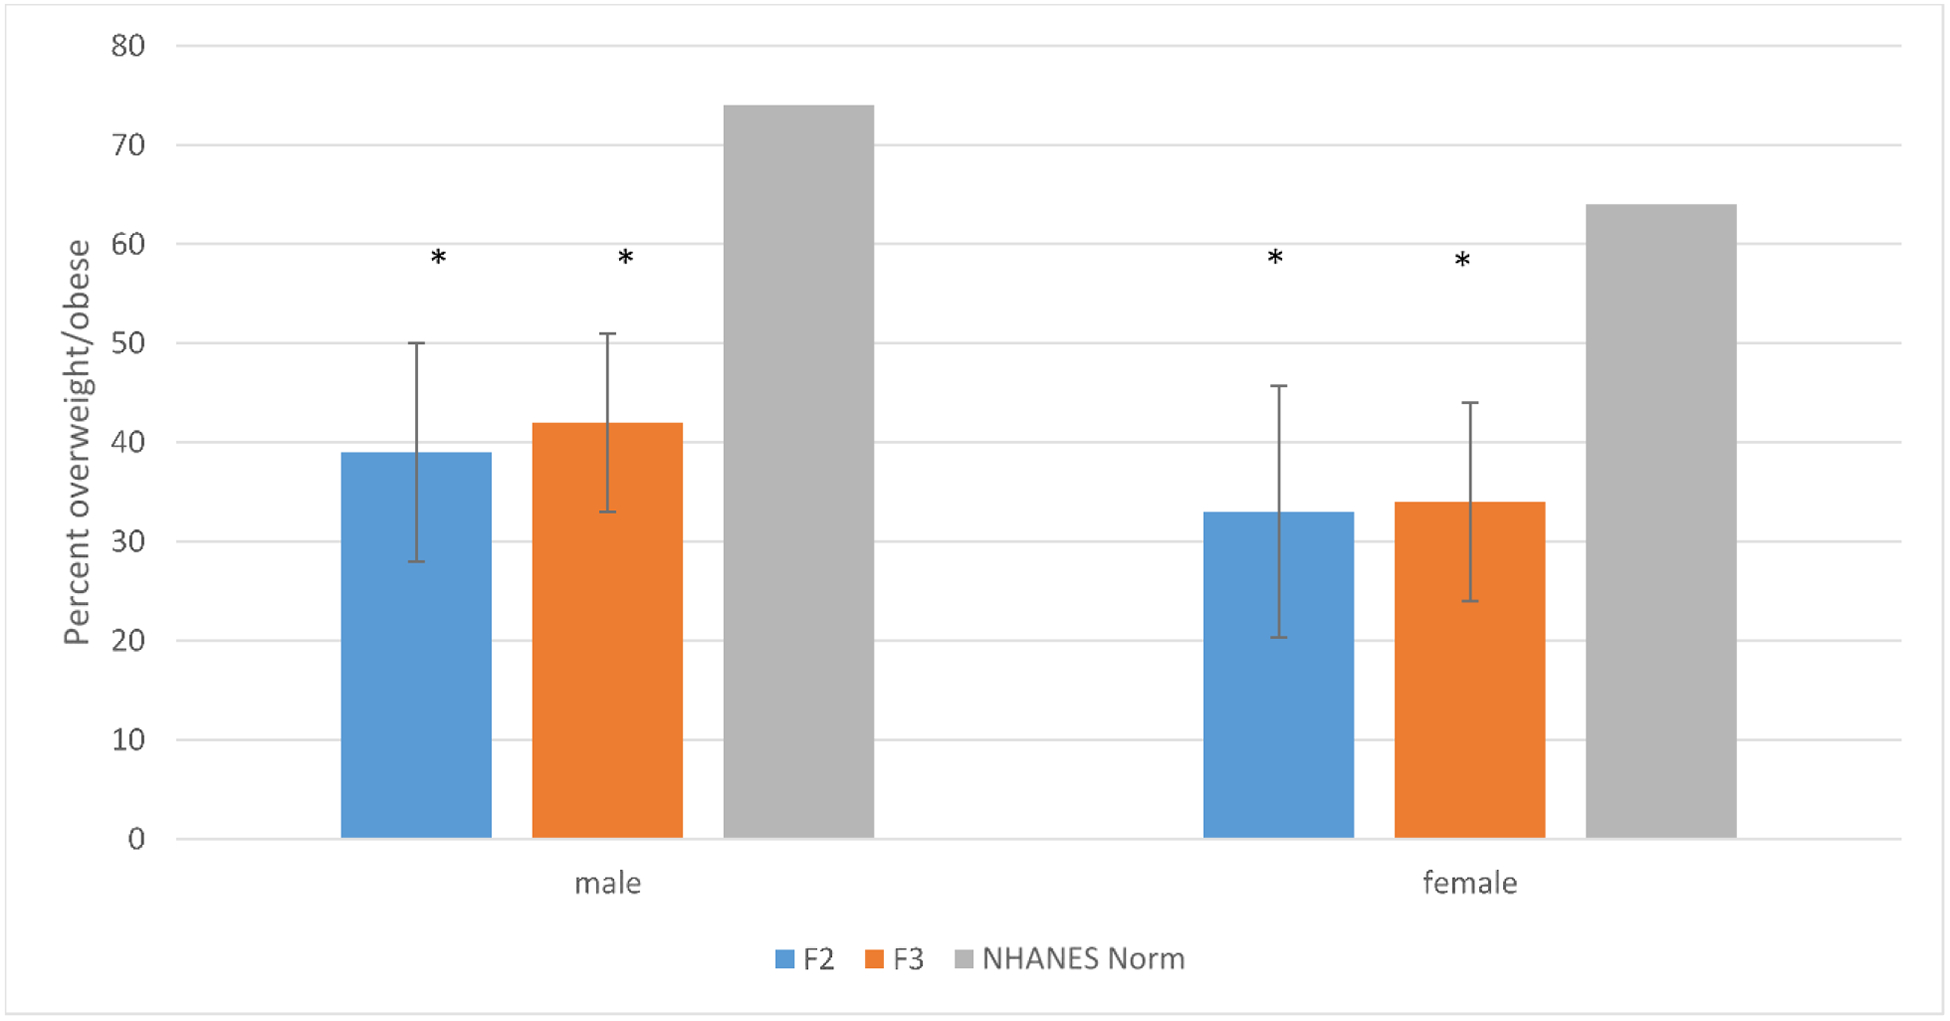
Percent of the Fontan Cohort Overweight/Obese at F2 and F3, compared to Population Norms among participants > 20 years. There were significantly fewer overweight/obese adult Fontan subjects compared to NHANES norms.
* p<0.05
Acknowledgements:
The authors thank Nicholas Dagincourt and Brenda Ni from New England Research Institutes for statistical support.
Footnotes
Publisher's Disclaimer: This is a PDF file of an unedited manuscript that has been accepted for publication. As a service to our customers we are providing this early version of the manuscript. The manuscript will undergo copyediting, typesetting, and review of the resulting proof before it is published in its final form. Please note that during the production process errors may be discovered which could affect the content, and all legal disclaimers that apply to the journal pertain.
Publisher's Disclaimer: Disclaimer: The contents of this work are solely the responsibility of the authors and do not necessarily represent the official views of the National Heart, Lung, and Blood Institute.
Conflicts of Interest: None
References
- 1.Driscoll DJ, Long-term results of the Fontan operation. Pediatr Cardiol, 2007. 28(6): p. 438–42. [DOI] [PubMed] [Google Scholar]
- 2.Cohen MS, et al. , Anthropometric Measures After Fontan Procedure: Implications for Suboptimal Functional Outcome. Am Heart J, 2010. 160(6): p. 1092–1098 e1. [DOI] [PMC free article] [PubMed] [Google Scholar]
- 3.Pike NA, et al. , Sex and Age Differences in Body-Image, Self-Esteem, and Body Mass Index in Adolescents and Adults After Single-Ventricle Palliation. Pediatr Cardiol, 2012. 33(5): p. 705–12. [DOI] [PMC free article] [PubMed] [Google Scholar]
- 4.Burch PT, et al. , Longitudinal Assessment of Growth in Hypoplastic Left Heart Syndrome: Results From the Single Ventricle Reconstruction Trial. J Am Heart Assoc, 2014. 3(3). [DOI] [PMC free article] [PubMed] [Google Scholar]
- 5.Burch PT, et al. , Assessment of Growth 6 Years after the Norwood Procedure. J Pediatr, 2017. 180: p. 270–274.e6. [DOI] [PMC free article] [PubMed] [Google Scholar]
- 6.Miller TA, et al. , Growth Asymmetry, Head Circumference, and Neurodevelopmental Outcomes in Infants with Single Ventricles. J Pediatr, 2016. 168: p. 220–5.e1. [DOI] [PMC free article] [PubMed] [Google Scholar]
- 7.Atz AM, et al. , Longitudinal Outcomes of Patients with Single Ventricle after the Fontan Procedure. J Am Coll Cardiol, 2017. 69(22): p. 2735–44. [DOI] [PMC free article] [PubMed] [Google Scholar]
- 8.McCrindle BW, et al. , Functional health status in children and adolescents after Fontan: comparison of generic and disease-specific assessments. Cardiol Young, 2014. 24(3): p. 469–77. [DOI] [PMC free article] [PubMed] [Google Scholar]
- 9.Anderson PA, et al. , Contemporary outcomes after the Fontan procedure: a Pediatric Heart Network multicenter study. J Am Coll Cardiol, 2008. 52(2): p. 85–98. [DOI] [PMC free article] [PubMed] [Google Scholar]
- 10.Atz AM, et al. , Survival data and predictors of functional outcome an average of 15 years after the Fontan procedure: the pediatric heart network Fontan cohort. Congenit Heart Dis, 2015. 10(1): p. E30–42. [DOI] [PMC free article] [PubMed] [Google Scholar]
- 11.CDC. CDC. Available from: (https://www.cdc.gov/growthcharts/percentile_data_files.htm).
- 12.NHANES. NHANES. Available from: http://www.ndei.org/NHANES_obesity_bmi_trends_adults_2010.aspx.html.
- 13.Varni JW, The PedsQL 4.0 as a pediatric population health measure: feasibility, reliability, and validity. Ambulatory Pediatrics, 2003. 3(6): (Nov-Dec): p. 329–41. [DOI] [PubMed] [Google Scholar]
- 14.Uzark K, et al. , Assessment of Quality of Life in Young Patients with Single Ventricle after the Fontan Operation. J Pediatr, 2016. 170: p. 166–172 e1. [DOI] [PMC free article] [PubMed] [Google Scholar]
- 15.Erikssen G, et al. , Survival in patients with univentricular hearts: the impact of right versus left ventricular morphology. Open Heart, 2018. 5(2): p. e000902. [DOI] [PMC free article] [PubMed] [Google Scholar]
- 16.Chung ST, et al. , Measurements of Gluconeogenesis and Glycogenolysis: A Methodological Review. Diabetes, 2015. 64(12): p. 3996–4010. [DOI] [PMC free article] [PubMed] [Google Scholar]
- 17.Pinto NM, M. B, Wernovsky G, de Ferranti SD, Walsh AZ, Laronde M, Hyland K, Dunn SO Jr, Cohen MS, Obesity is a common comorbidity in children with congenital and acquired heart disease. Pediatrics, 2007. 120(5)(November): p. 1157–64. [DOI] [PubMed] [Google Scholar]
- 18.Menon SC, et al. , Delayed puberty and abnormal anthropometry and its associations with quality of life in young Fontan survivors: A multicenter cross-sectional study. Congenit Heart Dis, 2018. 1 3(3): p. 463–469. [DOI] [PubMed] [Google Scholar]
- 19.Silva N, et al. , Children’s psychosocial functioning and parents’ quality of life in paediatric short stature: The mediating role of caregiving stress. Clin Psychol Psychother, 2018. 25(1): p. e107–e118. [DOI] [PubMed] [Google Scholar]
- 20.Sutherland N, et al. , Home- and hospital-based exercise training programme after Fontan surgery. Cardiol Young, 2018. 28(11): p. 1299–1305. [DOI] [PubMed] [Google Scholar]
- 21.Hedlund ER, et al. , Reduced physical exercise and health-related quality of life after Fontan palliation. Acta Paediatr, 2016. 105(11): p. 1322–1328. [DOI] [PubMed] [Google Scholar]


