

Abstract
Objectives:
Compare the incidence and mortality of gynecologic cancers of American Indian/Alaska Native (AI/AN) women to the Non-Hispanic White (NHW) population in the Pacific Northwest.
Methods:
Age-adjusted cancer incidence (1996–2016) and mortality (2006–2016) rates were calculated from population-based state cancer registry and death certificate data obtained from Washington, Oregon, and Idaho, and corrected for AI/AN misclassification. Incidence and mortality rate ratios (RR) were calculated to compare AI/AN and NHW women with gynecologic cancers.
Results:
Across all gynecologic cancer sites, AI/AN women were diagnosed at a younger age compared to NHW women. AI/AN women had a higher incidence of cervical cancer compared to NHW women with a RR of 1.53 (95% CI: 1.34, 1.75). For all age groups, AI/AN women had a higher incidence of cervical cancer and the disparity was greatest in the 50–64 age group with a RR of 1.76 (95% CI: 1.36, 2.30). Cervical cancer mortality was greater among AI/AN women, with an all-ages RR of 1.79 (95% CI: 1.30, 2.46); the disparity was greatest in the 50–64 age group (RR: 2.88, 95% CI: 1.89, 4.38). For uterine cancer, AI/AN women had similar incidence rates as NHW women but higher mortality rates (RR: 1.35, 95% CI: 1.03–1.75). Incidence and mortality for ovarian cancer were similar between groups.
Conclusion:
Our analysis of gynecologic cancers among AI/AN in the PNW found significant disparities relative to NHW women in cervical cancer incidence and mortality. These disparities persist despite advances in prevention strategies.
Introduction
Gynecologic cancers include malignancies of the uterus, ovary, cervix, vagina, and vulva. In the United States, the gynecologic cancer with the highest incidence is uterine cancer while the cancer with the highest associated mortality is ovarian cancer.1 Data collected over the 2009–2014 time period showed an increase in the incidence rate of uterine cancer to 26.1/100,000 women with a 1.2% increase in average annual percent change (AAPC) over that interval and decreases in the incidence rate of cervical (7.7/100,000 women, −1.6% AAPC) and ovarian (12.0/100,000 women, −1.6% AAPC) cancers. Similarly, the mortality rate and AAPC from uterine cancer increased (4.6/100,000 women, +2.0%) with decreases seen in ovarian (7.4/100,000, −2.3%) and cervical (2.3/100,000 women, −0.8%) cancers.1 Despite these improvements for the general U.S. population, disparities persist in the incidence and mortality of gynecologic cancers among different racial and ethnic groups.2–4
The most recent national data describing the burden of gynecologic cancer in the American Indian/Alaska Native (AI/AN) population was published in 2014 and included epidemiologic data from 1990–2009 from the SEER cancer registry. Uterine cancer had the greatest incidence of all gynecologic cancers. Ovarian and cervical cancer ranked 2nd and 3rd, respectively, for incidence. Ovarian cancer had the highest mortality rate of all the gynecologic cancers. Cervical and uterine cancers ranked 2nd and 3rd for mortality.5
Review of the literature shows a paucity of research pertaining to the impact of gynecologic cancers in the population of AI/AN women, with even less information addressing these cancers in each of the Indian Health Service regions. Of the sixty-nine articles reviewed in PubMed, six included information on gynecologic cancers among AI/AN women of the Pacific Northwest (Washington, Oregon, Idaho).6–11 For all counties in this region, the relative risk (RR) of cervical cancer incidence among AI/AN women was 1.15 (95% CI: 0.98, 1.35) when compared to non-Hispanic White (NHW) women. When looking at contract health service delivery areas (CHSDA – areas bordering or on reservation lands), the RR of cervical cancer is 1.36 (95% CI: 1.13, 1.63) compared to the NHW population. There also appeared to be a trend toward increased mortality from cervical cancer in the AI/AN population as compared to NHW women, though this result did not reach statistical significance.11 For ovarian and uterine cancer, the incidence and mortality among AI/AN women for all counties and CHSDA counties were less than or equal to that of NHW women.9
The purpose of this study is to further explore and update the incidence and mortality of gynecologic cancers among AI/AN women living in the Pacific Northwest (Washington, Oregon, and Idaho) and compare to the Non-Hispanic White (NHW) population for the same region using data from state cancer registries and state vital records.
Methods
Institutional review board (IRB) approval was obtained from the Portland Area Indian Health Service IRB as well as each participating state agency when applicable. All data linkage, data sharing, and analysis activities have been approved by the Northwest Portland Area Indian Health Board (NPAIHB) through tribal resolutions, and are conducted under data sharing agreements with the states of Idaho, Oregon and Washington.
Incidence
We analyzed population-based cancer registry data for the years 1996–2016 obtained from the Cancer Data Registry of Idaho, the Oregon State Cancer Registry, and the Washington State Cancer Registry. State cancer registry data were corrected for AI/AN racial misclassification through probabilistic linkages with the Northwest Tribal Registry - a database of personal identifiers for AI/AN patients seen in Indian Health Service, tribal, and urban Indian health clinics in Idaho, Oregon, and Washington. Linkage methods have been previously described.8,12 Briefly, cancer registry data were matched to the Northwest Tribal Registry using social security number, date of birth, name (last, first, middle), and sex using the probabilistic linkage software Match*Pro. Two staff members clerically reviewed all potential matched pairs to identify true matches between the cancer registry data and the Northwest Tribal Registry.
We identified gynecologic cancer sites using primary cancer site, histology, and behavior International Classification of Diseases for Oncology, 3rd edition (ICD-O-3) codes. The following primary site codes were used to identify cancer outcomes of interest: cervical cancer (C53.0-C53.9), ovarian cancer (C56.9), uterine cancer (C54.0-C54.9, C55.9), vaginal cancer (C52.9), vulvar cancer (C51.0-C51.9), and cancers to other female genital organs (C57.0-C57.9, C58.9). Due to small case counts for AI/AN, we combined vaginal, vulvar, and cancers to other female genital organs into a single “Other Gynecologic Cancers” category. We analyzed stage at diagnosis using the summary stage variables provided by the state cancer registries.
Mortality
We analyzed state death certificate for the years 2006–2016 obtained from the Idaho Bureau of Vital Records and Health Statistics, Oregon Center for Health Statistics, and Washington Center for Health Statistics. State death certificates were corrected for AI/AN racial misclassification using similar methods as those used for the incidence data. We identified gynecologic cancer deaths using the following International Classification of Diseases, 10th edition (ICD-10 codes) in the underlying cause of death field:, cervical cancer (C53), uterine cancer (C54, C55), ovarian cancer (C56), vaginal cancer (C52), vulvar cancer (C51), and cancers to other female genital organs (C57-C58). Due to small case counts for AI/AN, we combined vaginal, vulvar, and cancers to other female genital organs into a single “Other Gynecologic Cancers” category.
Analysis
For both incidence and mortality data, AI/AN counts and rates include records with any mention of American Indian or Alaska Native background in the multiple race fields in the cancer registry record or death certificate, plus individuals who matched with the Northwest Tribal Registry but had no indication of AI/AN background in the record. AI/AN counts and rates include those with Hispanic ethnicity. Comparisons were made to the non-Hispanic White population to identify disparities relative to the majority population in the region. Chi-square and t-tests were used to test for differences between categorical and continuous variables, respectively. Rates were calculated per 100,000 population, and (with the exception of age-specific rates) were age-adjusted to the U.S. 2000 standard population using National Center for Health Statistics (NCHS) vintage 2017 bridged race estimates as population denominators. For AI/AN incidence and mortality rates, 95% confidence intervals (CI) were based on a gamma distribution to account for small cell sizes, while the confidence intervals for NHW rates of incidence and mortality were calculated using the normal approximation method.13 Metropolitan and non-metropolitan counties were designated using the NCHS 2013 Urban-Rural Classification scheme.14 Incidence and mortality rate ratios (RR) and 95% CIs were calculated to evaluate differences between AI/AN and NHW women. To evaluate trends in cancer incidence and mortality, three-year rolling averages of age-adjusted rates were calculated, and the Annual Percent Change (APC) was calculated using the Joinpoint Regression Program. All other analyses were conducted in SAS v.9.4.
Results
From 1996–2016, gynecologic cancers accounted for 12.5% and 11.3% of all cancers among women for AI/AN and NHW in the Pacific Northwest (PNW), respectively. For both groups, uterine cancer had the highest incidence while ovarian cancer had the highest mortality (Figures 1 and 2). For all cancer sites, AI/AN women were diagnosed at a younger average age compared to NHW women (Table 1); the age difference between AI/AN and NHW was 4.5 years for cervical cancer, 5 years for uterine cancer, and 5.7 years for ovarian cancer (p<0.0001). For cervical cancer, a lower proportion of AI/AN women were diagnosed at the localized stage of their disease compared to NHW women. For uterine and ovarian cancers, AI/AN and NHW women had similar distributions for the stage at which their cancer was diagnosed. A higher proportion of AI/AN women diagnosed with gynecologic cancers lived in non-metropolitan areas compared to NHW.
Figure 1.
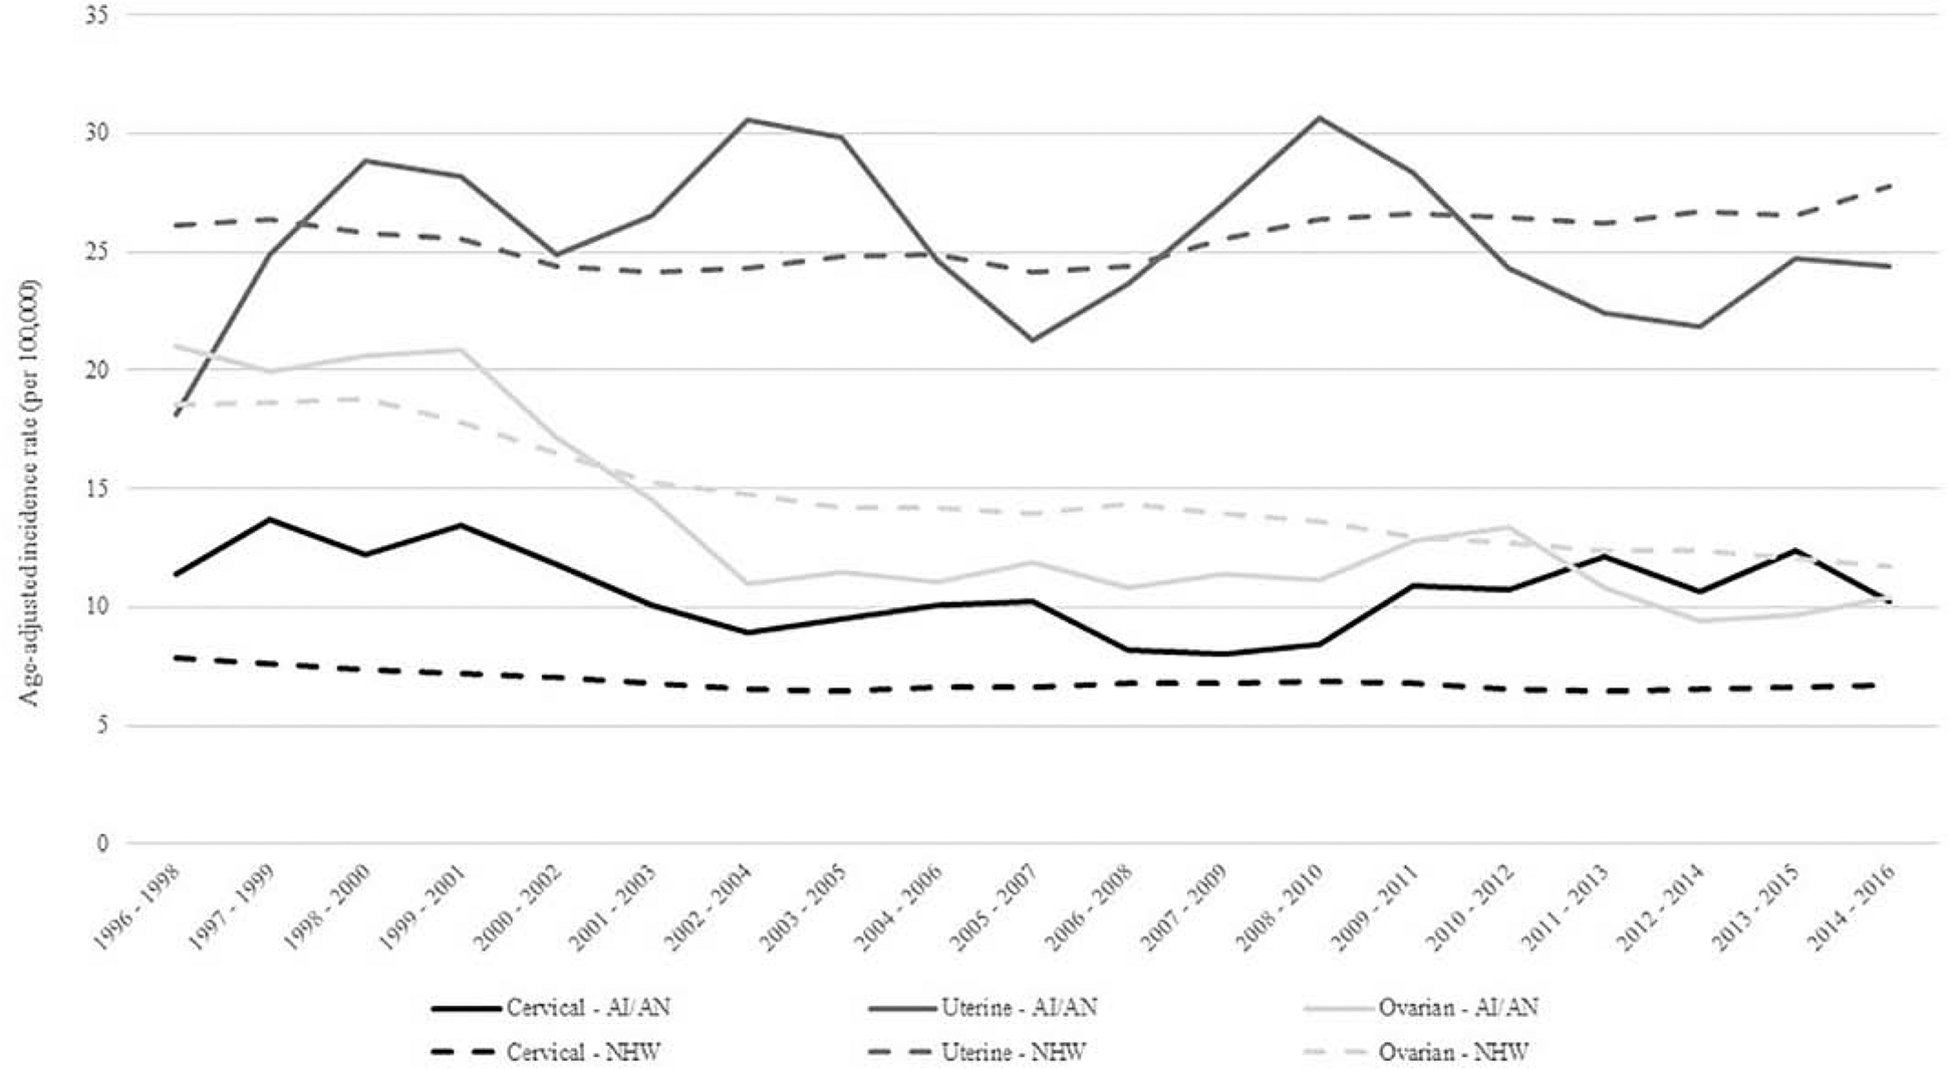
Trends in age-adjusted cervical, uterine, and ovarian cancer incidence rates among AI/AN and NHW, Northwest Region, 1996–2016.
Abbreviations: AI/AN = American Indian/Alaska Native, NHW = Non Hispatic White
Figure 2.
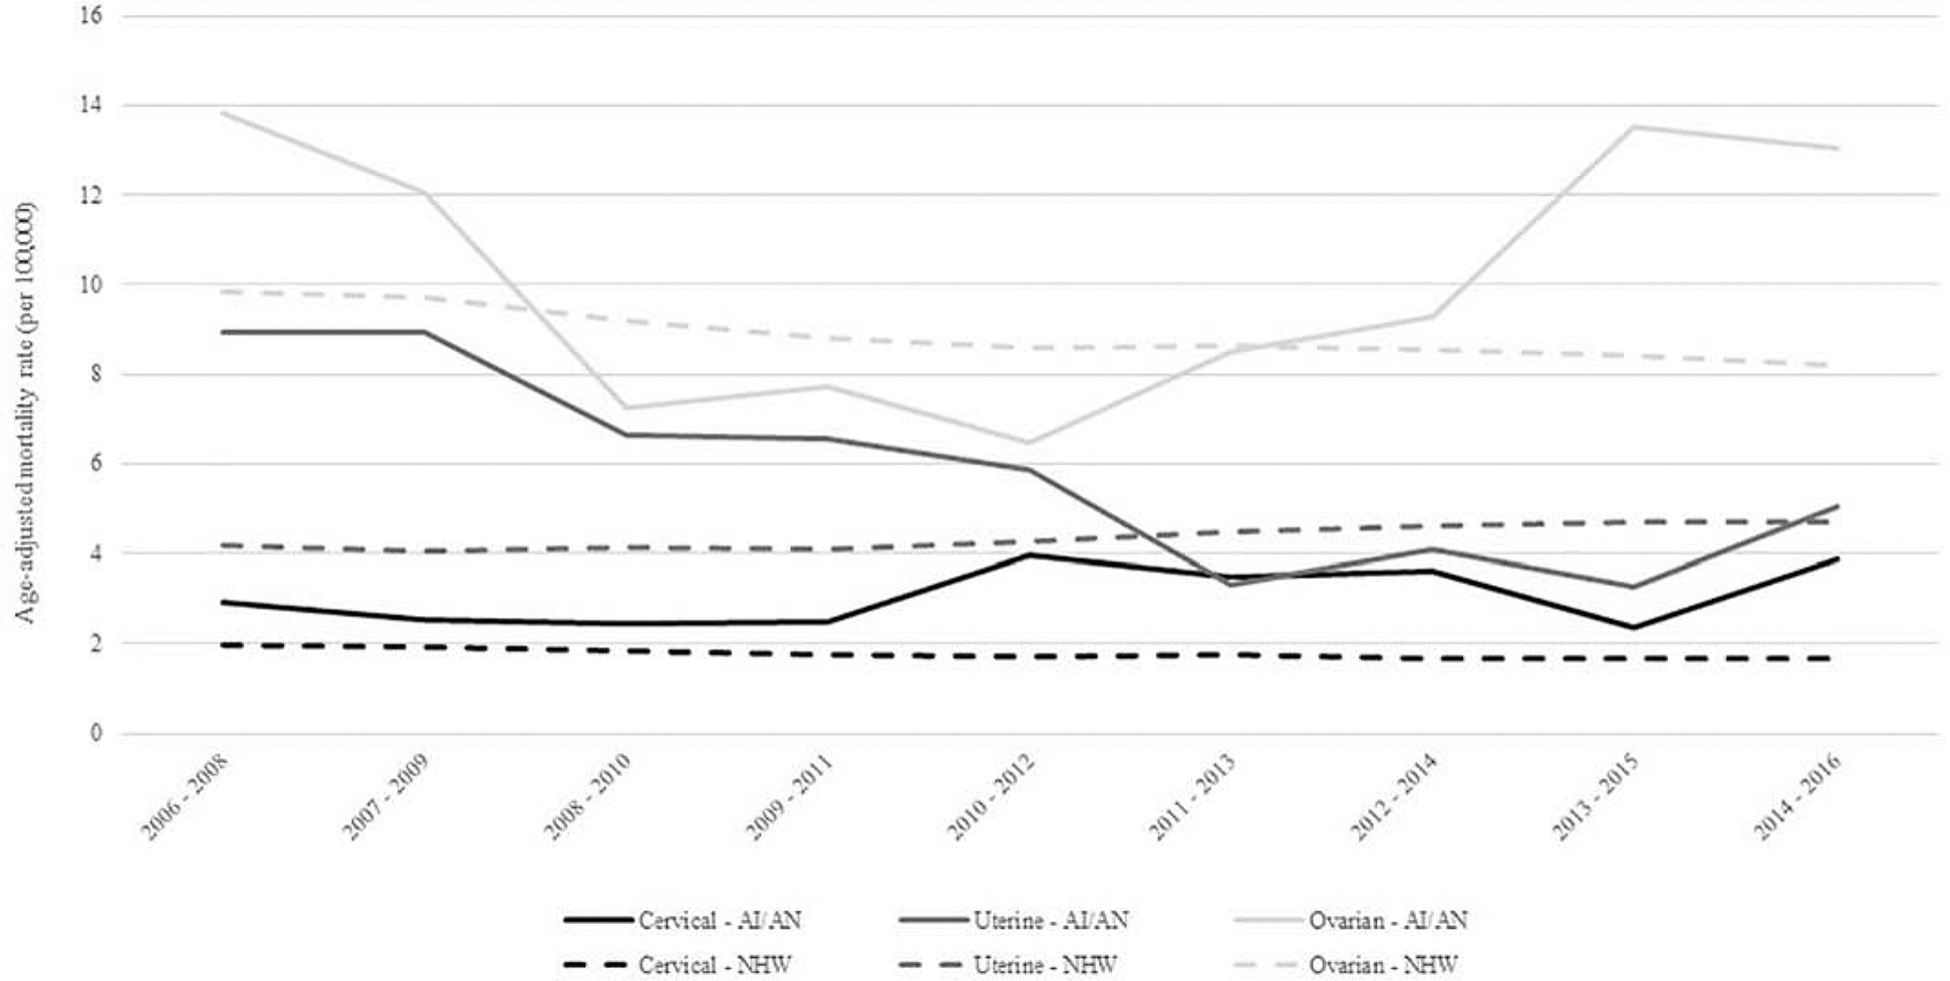
Trends in age-adjusted cervical, uterine, and ovarian cancer mortality rates among AI/AN and NHW, Northwest Region, 2006–2016
Abbreviation: AI/AN = American Indian/Alaska Native, NHW = Non Hispatic White
Table 1.
Characteristics of AI/AN and NHW women diagnosed with gynecologic cancers, by cancer site, Northwest Region, 1996–2016.
| Cervical Cancer | Uterine Cancer | Ovarian Cancer | Other Gynecologic Cancers* | |||||||||
|---|---|---|---|---|---|---|---|---|---|---|---|---|
| AI/AN No. (%) |
NHW No. (%) |
p-value | AI/AN No. (%) |
NHW No. (%) |
p-value | AI/AN No. (%) |
NHW No. (%) |
p-value | AI/AN No. (%) |
NHW No. (%) |
p-value | |
| Mean Age At Diagnosis (SE) | 44.7 (0.9) | 49.2 (0.2) | <0.0001 | 58.6 (0.6) | 63.6 (0.1) | <0.0001 | 58.2 (1.1) | 63.9 (0.1) | <0.0001 | 59.4 (2.1) | 66.8 (0.2) | <0.0001 |
| Age Group | 0.0003 | <0.0001 | <0.0001 | 0.0002 | ||||||||
| <35 | 48 (21.7) | 1,189 (17.0) | 12 (2.6) | 310 (1.0) | 16 (7.6) | 659 (3.8) | 7 (9.6) | 128 (2.4) | ||||
| 35–49 | 101 (45.7) | 2,769 (39.6) | 84 (18.5) | 3,274 (10.4) | 48 (22.9) | 2,336 (13.6) | 10 (13.7) | 617 (11.4) | ||||
| 50–64 | 57 (25.8) | 1,824 (26.1) | 220 (48.4) | 13,793 (43.6) | 67 (31.9) | 5,578 (32.4) | 26 (35.6) | 1,562 (28.8) | ||||
| 65+ | 15 (6.8) | 1,219 (17.4) | 139 (30.5) | 14,252 (45.1) | 79 (37.6) | 8,661 (50.3) | 30 (41.1) | 3,112 (57.4) | ||||
| Stage at Diagnosis | 0.0600 | 0.5337 | 0.5800 | 0.2344 | ||||||||
| Localized | 95 (43.0) | 3,603 (51.5) | 316 (69.5) | 22,274 (70.4) | 41 (19.5) | 2,755 (16.0) | 29 (39.7) | 2,642 (48.8) | ||||
| Regional | 75 (33.9) | 2,095 (29.9) | 78 (17.1) | 5,424 (17.1) | 27 (12.9) | 2,698 (15.7) | 19 (26.0) | 1,332 (24.6) | ||||
| Distant | 35 (15.8) | 814 (11.6) | 28 (6.2) | 2,130 (6.7) | 124 (59.0) | 10,144 (58.9) | 19 (26.0) | 951 (17.5) | ||||
| Unstaged | 16 (7.2) | 489 (7.0) | 33 (7.3) | 1,801 (5.7) | 18 (8.6) | 1,635 (9.5) | 6 (8.2) | 494 (9.1) | ||||
| County Type of | 0.0379 | <0.0001 | <0.0001 | 0.0257 | ||||||||
| Residence | ||||||||||||
| Metropolitan | 169 (76.5) | 5,737 (81.9) | 333 (73.2) | 26,012 (82.2) | 135 (64.3) | 14,142 (82.1) | 53 (72.6) | 4,476 (82.6) | ||||
| Non-Metropolitan | 52 (23.5) | 1,264 (18.1) | 122 (26.8) | 5,617 (17.8) | 75 (35.7) | 3,092 (17.9) | 20 (27.4) | 943 (17.24 | ||||
Abbreviations: AI/AN = American Indian/Alaska Native, NHW = Non-Hispanic Whites, No. = Number, SE = Standard Error
Other gynecologic cancers include vaginal, vulvar, and cancers to other female genital organs.
During 1996–2016, AI/AN woman had a significantly higher incidence of cervical cancer compared to NHW women with a rate ratio of 1.53 (95% CI: 1.34, 1.75) (Table 2). For all age groups, AI/AN had higher incidence of cervical cancer, and women 35–49 (RR: 1.53, 95% CI: 1.26–1.87) and 50–64 (RR: 1.76, 95% CI: 1.36–2.30) had significantly higher cervical cancer incidence rates compared to NHW in the same age groups (Table 2). AI/AN also had a significantly higher rate of patients diagnosed at advanced stages of cervical cancer than their NHW counterparts. The disparity was largest among women diagnosed at the distant stage of their disease; AI/AN women were 2.44 times more likely than NHW women to be diagnosed at the distant stage. AI/AN cervical cancer incidence rates decreased from 1996 to 2007 (APC = −4.0, p = 0.007), but have since increased by an annual average of 3.9% (p = 0.043) per year through 2016 (Figure 1). Mortality from cervical cancer was also greater in the AI/AN population compared to the NHW population with an all-ages rate ratio of 1.79 (95% CI: 1.30, 2.46) (Table 3). Similar to the incidence data, the age group with the greatest disparity between AI/AN and NHW is 50–64 with 2.88 times higher mortality among AI/AN (95% CI: 1.89, 4.38). While cervical cancer mortality significantly decreased for NHW women during 2006–2016, it increased for AI/AN women by an annual average of 3.6%, though this APC was not statistically significant (Figure 2). AI/AN women living in metropolitan counties had significantly higher cervical cancer incidence and mortality rates compared to NHW women living in these areas (Tables 2 and 3).
Table 2:
Age-adjusted gynecologic cancer incidence rates (per 100,000) and rate ratios by cancer site and race, Northwest Region, 1996–2016.
| Cervical Cancer | Uterine Cancer | Ovarian Cancer | Other Gynecologic Cancers† | |||||||||
|---|---|---|---|---|---|---|---|---|---|---|---|---|
| AI/AN Count (Rate) |
NHW Count (Rate) |
AI/AN:NHW Rate Ratio (95% CI) |
AI/AN Count (Rate) |
NHW Count (Rate) |
AI/AN:NHW Rate Ratio (95% CI) |
AI/AN Count (Rate) |
NHW Count (Rate) |
AI/AN:NHW Rate Ratio (95% CI) |
AI/AN Count (Rate) |
NHW Count (Rate) |
AI/AN:NHW Rate Ratio (95% CI) |
|
| Overall Rate | 221 (10.5) | 7,001 (6.8) | 1.53 (1.34, 1.75)* | 455 (25.2) | 31,629 (25.9) | 0.97 (0.89, 1.07) | 210 (13.1) | 17,234 (14.5) | 0.90 (0.79, 1.03) | 73 (4.6) | 5,419 (4.5) | 1.03 (0.82, 1.30) |
| Age Group | ||||||||||||
| <35 | 48 (3.4) | 1,189 (2.9) | 1.18 (0.88, 1.57) | 12 (0.8) | 310 (0.7) | 0.97 (0.89, 1.07) | 16 (1.1) | 659 (1.6) | 0.90 (0.79, 1.03) | 7 (0.5) | 128 (0.3) | 1.60 (0.75, 3.42) |
| 35–49 | 101 (20.2) | 2,769 (13.2) | 1.53 (1.26, 1.87)* | 84 (16.8) | 3,274 (15.6) | 1.13 (0.63, 2.01) | 48 (9.6) | 2,336 (11.1) | 0.71 (0.43, 1.16) | 10 (2.0) | 617 (2.9) | 0.68 (0.36, 1.27) |
| 50–64 | 57 (16.8) | 1,824 (9.5) | 1.76 (1.36, 2.30)* | 220 (64.7) | 13,793 (71.8) | 1.08 (0.87, 1.34) | 67 (19.7) | 5,578 (29.1) | 0.86 (0.65, 1.15) | 26 (7.6) | 1,562 (8.1) | 0.94 (0.64, 1.39) |
| 65+ | 15 (10.0) | 1,219 (7.7) | 1.30 (0.78, 2.17) | 139 (93.1) | 14,252 (90.2) | 0.90 (0.79, 1.03) | 79 (52.9) | 8,661 (54.8) | 0.68 (0.53, 0.86)* | 30 (20.1) | 3,112 (19.7) | 1.02 (0.71, 1.46) |
| Stage at Diagnosis | ||||||||||||
| Localized | 95 (4.3) | 3,603(3.7) | 1.15(0.94, 1.41) | 316 (17.2) | 22,274 (18.3) | 0.94 (0.84, 1.05) | 41 (2.1) | 2,755 (2.5) | 0.84 (0.62, 1.15) | 29 (1.7) | 2,642 (2.2) | 0.78 (0.54, 1.13) |
| Regional | 75 (3.6) | 2,095 (2.0) | 1.83 (1.45, 2.30)* | 78 (4.3) | 5,424 (4.4) | 0.96 (0.77, 1.21) | 27 (1.6) | 2,698 (2.3) | 0.67 (0.46, 0.98)* | 19 (1.3) | 1,332 (1.1) | 1.17 (0.75, 1.85) |
| Distant | 35 (1.8) | 814 (0.7) | 2.44 (1.74, 3.42)* | 28 (1.6) | 2,130 (1.7) | 0.94 (0.65, 1.36) | 124 (7.8) | 10,144 (8.4) | 0.93 (0.78, 1.11) | 19 (1.2) | 951 (0.8) | 1.52 (0.97, 2.40) |
| Unstaged | 16 (0.9) | 489 (0.5) | 1.88 (1.14, 3.09)* | 33 (2.1) | 1,801 (1.4) | 1.48 (1.05, 2.08)* | 18 (1.6) | 1,635 (1.3) | 1.26 (0.79, 2.01) | 6 (0.4) | 494 (0.4) | 1.07 (0.48, 2.40) |
| County of Residence | ||||||||||||
| Metropolitan | 169 (10.7) | 5,737(6.7) | 1.59 (1.36, 1.85)* | 333 (25.6) | 26,012 (26.3) | 0.97 (0.87, 1.09) | 135 (11.9) | 14,142 (14.6) | 0.82 (0.69, 0.97)* | 53 (4.6) | 4,476 (4.5) | 1.02 (0.78, 1.34) |
| Non-Metropolitan | 52 (9.9) | 1,264 (7.6) | 1.30 (0.99, 1.72) | 122 (24.6) | 5,617 (24.6) | 1.00 (0.84, 1.20) | 75 (16.4) | 3,092 (13.9) | 1.18 (0.94, 1.48) | 20 (4.6) | 943(4.2) | 1.08 (0.70, 1.69) |
Abbreviations: AI/AN = American Indian/Alaska Native; NHW = Non-Hispanic White; CI = Confidence Interval
p<0.05
Other Gynecologic Cancers include vaginal, vulvar, and cancers to other female genital organs
Table 3.
Age-adjusted gynecologic cancer mortality rates (per 100,000) and rate ratios by site and race, Northwest Region, 1996–2016.
| Cervical Cancer | Uterine Cancer | Ovarian Cancer | Other Gynecologic Cancers† | |||||||||
|---|---|---|---|---|---|---|---|---|---|---|---|---|
| AI/AN Count (Rate) |
NHW Count (Rate) |
AI/AN:NHW Rate Ratio (95% CI) |
AI/AN Count (Rate) |
NHW Count (Rate) |
AI/AN:NHW Rate Ratio (95% CI) |
AI/AN Count (Rate) |
NHW Count (Rate) |
AI/AN:NHW Rate Ratio (95% CI) |
AI/AN Count (Rate) |
NHW Count (Rate) |
AI/AN:NHW Rate Ratio (95% CI) |
|
| Overall Rate | 39 (3.2) | 1,132 (1.8) | 1.79 (1.30, 2.46)* | 56 (5.9) | 3,203 (4.4) | 1.35 (1.03, 1.75)* | 87 (10.9) | 6,410 (8.9) | 1.23 (0.99, 1.51) | 16 (2.0) | 808 (1.1) | 1.81 (1.1, 2.96)* |
| Age Group | ||||||||||||
| <50 | 9 (0.8) | 296 (0.9) | 0.87 (0.45, 1.69) | 8 (0.7) | 137 (0.4) | 1.67 (0.82, 3.41) | 6 (0.5) | 317 (1.0) | 0.54 (0.24, 1.21) | -- | 30 (0.1) | -- |
| 50–64 | 23 (10.4) | 419 (3.6) | 2.88 (1.89, 4.38)* | 21 (9.5) | 859 (7.4) | 1.28 (0.83, 1.97) | 24 (10.8) | 1,807 (15.6) | 0.70 (0.47, 1.04) | -- | 167 (1.4) | -- |
| 65+ | 7 (7.1) | 417 (4.6) | 1.55 (0.73, 3.27) | 27 (27.5) | 2,207 (24.4) | 1.13 (0.77, 1.65) | 57 (58.0) | 4,286 (47.4) | 1.23 (0.94, 1.59) | 9 (9.2) | 611 (6.8) | 1.36 (0.7, 2.62) |
| County of Residence | ||||||||||||
| Metropolitan | 29 (3.2) | 918 (1.7) | 1.83 (1.27, 2.66)* | 41 (6.0) | 2,612 (4.4) | 1.35 (0.99, 1.84) | 58 (10.1) | 5,262 (9.0) | 1.12 (0.87, 1.45) | -- | 641 (1.1) | -- |
| Non-Metropolitan | 10 (3.1) | 214 (2.0) | 1.52 (0.80, 2.86) | 15 (5.8) | 591 (4.2) | 1.39 (0.83, 2.32) | 29 (12.8) | 1,148 (8.5) | 1.51 (1.05, 2.18)* | -- | 167(1.2) | -- |
Abbreviations: AI/AN = American Indian/Alaska Native; NHW = Non-Hispanic White; CI = Confidence Interval
p<0.05
Other Gynecologic Cancers include vaginal, vulvar, and cancers to other female genital organs
= Suppressed due to small cell sizes for AI/AN
AI/AN women in the PNW had comparable rates of uterine cancer compared to NHW in the same region for all age groups and across geographic distributions. AI/AN women had a higher rate of unstaged uterine cancers with a RR of 1.48 (95% CI: 1.05, 2.08) (Table 2). The overall mortality rate for AI/AN women with uterine cancer was 35% higher compared to NHW women (95% CI: 1.03, 1.75). No statistically significant difference was noted when evaluating uterine mortality rates by age groups or metropolitan vs rural geographic setting (Table 3). While uterine cancer mortality significantly increased for NHW women during 2006–2016 (APC = 2.1, p =0.0002), mortality for AI/AN women significantly decreased by an annual average of 10.1% (p = 0.005) (Figure 2).
For ovarian cancer, overall incidence was similar between AI/AN and NHW with statistically significant lower rates in AI/AN women aged 65 years and older. AI/AN women who were diagnosed at the regional stage of their disease and who lived in metropolitan areas had significantly lower ovarian cancer incidence rates compared to NHW women (Table 2). Mortality rates were similar between AI/AN and NHW overall and when stratified by age (Table 3). Geographic location showed a worse mortality rate for AI/AN living in non-metropolitan areas compared to NHW, with a rate ratio of 1.51 (95% CI: 1.05, 2.18). Ovarian cancer incidence rates significantly decreased for both AI/AN and NHW women since 1996 (Figure 1); the APC for AI/AN during the 21-year time period was −4.1 (p<0.0001), while the APC for NHW was −2.6 (p<0.0001). Ovarian cancer mortality rates significantly decreased for NHW women during 2006–2016 (Figure 2). However, after decreasing between 2006 and 2011, ovarian cancer mortality rates for AI/AN have significantly increased through 2016 (APC = 21.8, p = 0.029).
Discussion
In this manuscript, we sought to characterize the incidence and mortality of gynecologic cancers among AI/AN living in the PNW and compare to the Non-Hispanic White population. Gynecologic cancers represent 11–12% of all cancers for both AI/AN and NHW women in the PNW. Across all gynecologic cancer sites, AI/AN women were diagnosed at a younger age than NHW women. There is one published study evaluating the incidence of cancers among AI/AN ages 20–44 that showed a lower incidence of all cancer compared to NHW individuals with a rate ratio of 0.77 (95%CI: 1.04–1.28).15 In our study, gynecologic cancers among women less than 50 years of age had a slightly greater rate ratio of 1.18 (95% CI: 1.06–1.32) compared to NHW women.
Cervical cancer incidence and mortality in all populations have been decreasing since widespread adoption of pap smear screening and initiation of government sponsored programs for underserved women such as the National Breast and Cervical Cancer Early Detection Program (NBCCEDP) in the 1970s and 1990s, respectively.16 Inequities between racial subgroups persist despite these interventions, and our analyses show there is 1.53 times the incidence and nearly twice the mortality from cervical cancer among AI/AN compared to the NHW population for the same region. Further, our analysis of trends indicate that cervical cancer incidence and mortality appear to be increasing for AI/AN. Epidemiologic studies using the National Cancer Institute’s Surveillance, Epidemiology, and End Results (SEER) database exploring AI/AN cancer rates have shown similar results for the U.S. overall. However, one study evaluated cervical cancer incidence by region and the Pacific Coast (WA, OR, ID, CA, HI) incidence rate ratio compared to NHW was 0.70 (95% CI: 0.55–0.88).3,11 The discordance between our data and this publication may be for several reasons. First, the databases for reporting these numbers come from two different sources. Second, the time periods are slightly different with our reporting period including 1996–2016 and the other publications spanning 1999–2009. Third, the states included in the other studies define the Pacific Coast (WA, OR, ID, CA, HI) whereas our study focused its scope to include the PNW (WA, OR, ID), paralleling the Portland Area Indian Health Service region.
We found a markedly higher incidence and mortality rates for cervical cancer in the 50–64 age group compared to NHW women, a novel finding. Reasons for this disparity are unclear but may include barriers to accessing care, both patient-centered and system-centered. We also found a higher rate of death from cervical cancer for AI/AN women of all ages who live in metropolitan areas. A recent national study evaluating the incidence of several index cancers comparing rural vs urban residence reported that cancers associated with modifiable risk factors such as smoking, HPV, and screening tools (e.g. pap smear screening, HPV vaccination, colposcopy) had the greatest incidence in rural areas.17 Their data do not include the AI/AN population; thus, it is difficult to determine to what degree this finding impacts geography and our findings.
Cervical cancer is preventable through HPV vaccination and early detection of pre-invasive lesions via pap smear screening. A review by Spence and colleagues found that nearly half of women with new cervical cancer diagnoses had either never had a pap smear performed or had a significant lapse in between pap smear screening.18 The proportion of women up-to-date on pap smear screening (i.e. pap smear cytology within 3 years, co-testing with HPV and cytology every 5 years, or primary HPV screening) for AI/AN and NHW are 54.8% and 69%, respectively.19–21 Most invasive cervical cancers are attributed to high-risk HPV subtypes 16 and 18.22,23 The Centers for Disease Control and Prevention Advisory Committee on Immunization Practices recommend HPV vaccination to males and females at target ages of 11–12, with FDA approval for ages 9–45. Vaccination uptake in the U.S. has been far less than the goal of 80% set forth by the Centers for Disease Control and Prevention. Published data show only 41.9% of U.S. females and 28.1% of males ages 13–17 were fully vaccinated for HPV and AI/AN youth have initiation and completion rates of 60% and 50%, respectively.24,25 The benefits of HPV vaccination and pap smear screening are well understood and continued public health efforts to increase access and utilization are critical to achieve a reduction in disease burden.
Uterine cancer incidence and mortality are on the rise among all racial and ethnic subgroups across the U.S.26 Our analyses from AI/AN and NHW in the PNW show similarities in terms of incidence, age at diagnosis, and geographic location of residence. For AI/AN in the PNW, we did not find a clear trend for uterine cancer incidence, but found that uterine cancer mortality has significantly decreased to rates that are comparable with NHW women. A greater proportion of AI/AN women had unstaged endometrial cancer, a procedure which includes a lymph node assessment such as frozen section assessment of the uterine tumor, sentinel lymph node mapping, or full pelvic and para-aortic lymph node dissection.27,28 With frozen section assessment of endometrial cancer, women with grade 1 or 2 endometrioid histology, tumor size < 2 cm, and < 50% myometrial invasion on frozen section pathology assessment are extremely unlikely to have lymph node metastases and therefore do not need to undergo comprehensive staging. Women in this category have had an appropriate evaluation that aligns with national guidelines; however, they will be considered “unstaged” in cancer registry databases. Thus, the higher proportion of AI/AN women with unstaged cancers in our dataset include this subpopulation and the statistically significant difference between AI/AN and NHW may be less clinically relevant.
The relatively higher mortality rate from uterine cancer among AI/AN women compared to NHW may be due to other factors associated with endometrial cancer. For all racial and ethnic groups combined, the cause of death for most women with a diagnosis of endometrial cancer is not due to their cancer but of other associated medical comorbidities such as obesity and cardiovascular disease.29,30 According to the Centers for Disease Control and Prevention summary health statistics, AI/AN individuals are 1.5 times more likely to be obese than NHW and 1.3 times more likely to have cardiovascular disease. Thus, if a greater proportion of AI/AN women experience a greater burden of co-morbid disease, this can impact the mortality disparity that we have observed in our analysis.
Our work shows overall incidence and mortality rates for ovarian cancer among AI/AN women are similar to that of NHW women with a statistically significant lower incidence of ovarian cancer among AI/AN women at ages less than 65. The scientific rationale behind this is not entirely clear. Hereditary breast and ovarian cancer (HBOC) syndromes, e.g. BRCA, are associated with earlier age at diagnosis of cancer and presumably contribute to the prevalence among the NHW population in ovarian cancer diagnosis at age < 50 years. Among women with family history concerning for a genetic syndrome, the prevalence of BRCA1 or BRCA2 germline mutation is 25–40% and 6–15%, respectively and an overall and a general U.S. prevalence of 15.3% among ovarian cancer patients in an unselected population.31 This study evaluated multiple racial and ethnic groups, and AI/AN were not included in the analysis. To the best of our knowledge, there are no published studies examining the prevalence of HBOC mutations in AI/AN. Our study found a higher rate of ovarian cancer mortality among AI/AN women living in rural areas compared to NHW. Access to specialty care in rural areas is a global population barrier that may be a greater challenge for populations with a higher proportion with lower socioeconomic status, such as AI/AN.
This study is subject to at least three limitations. First, while we utilized data that had been corrected for AI/AN misclassification, the linkage process may not have identified all misclassified AI/AN records in the state cancer registry and death certificate data utilized for this study. The Northwest Tribal Registry that is used in the probabilistic linkages to correct AI/AN misclassification represents approximately 76% of the Northwest AI/AN population.32 The Registry contains records of individuals who received services from Indian Health Service, tribal, and urban Indian health clinics in Idaho, Oregon, and Washington, and does not include AI/AN individuals who are not eligible for these services or who seek care outside the Indian health care system. Therefore, the true number of AI/AN gynecologic cancer cases and deaths, and their corresponding rates, may be higher than those reported in this study. Second, the NCHS bridged race estimates used as our population denominators are known to inflate the Hispanic AI/AN population in the U.S., and therefore result in underestimates of rates that include Hispanic AI/AN (as is the case for this study).33 Third, the small number of incident cancers cases and cancer deaths among AI/AN required us to combine multiple years of data across multiple states to obtain stable rate estimates. While we are unaware of changes in data collection and reporting standards that might result in data not being comparable, such discrepancies may exist and therefore affect the comparability of data across time and geographies.
Our analysis of gynecologic cancers among AI/AN in the PNW found significant disparities relative to NHW women in cervical cancer incidence and mortality, and identified sub-groups who appear to be at higher risk for being diagnosed with and dying from cervical cancer. The disparity for the incidence and mortality of cervical cancer persists despite advances in prevention strategies and more intervention efforts should be put forth to address the health inequities in this preventable disease.
Highlights:
AI/AN women have a higher incidence of cervical cancer and a higher mortality from this disease than their NHW counterparts.
Incidence and mortality for ovarian cancer were similar between AI/AN women and NHW women.
AI/AN women have a higher rate of mortality from uterine cancer than NHW women, despite similar incidence rates.
Footnotes
Publisher's Disclaimer: This is a PDF file of an unedited manuscript that has been accepted for publication. As a service to our customers we are providing this early version of the manuscript. The manuscript will undergo copyediting, typesetting, and review of the resulting proof before it is published in its final form. Please note that during the production process errors may be discovered which could affect the content, and all legal disclaimers that apply to the journal pertain.
CONFLICT OF INTEREST STATEMENT:
The following authors have national grant funding supporting this work: Joshi: Centers for Disease Control and Prevention #NU58DP006385 Bruegl: Research reported in this publication was supported by the National Center for Advancing Translational Sciences of the National Institutes of Health under award number KL2TR002370. The content is solely the responsibility of the authors and does not necessarily represent the official views of the National Institutes of Health.
References
- 1.Jemal A, Ward EM, Johnson CJ, et al. Annual Report to the Nation on the Status of Cancer, 1975–2014, Featuring Survival. Journal of the National Cancer Institute 2017;109. [DOI] [PMC free article] [PubMed] [Google Scholar]
- 2.McDougall JA, Madeleine MM, Daling JR, Li CI. Racial and ethnic disparities in cervical cancer incidence rates in the United States, 1992–2003. Cancer causes & control : CCC 2007;18:1175–86. [DOI] [PubMed] [Google Scholar]
- 3.Becker TM, Espey DK, Lawson HW, Saraiya M, Jim MA, Waxman AG. Regional differences in cervical cancer incidence among American Indians and Alaska Natives, 1999–2004. Cancer 2008;113:1234–43. [DOI] [PubMed] [Google Scholar]
- 4.Sabatino SA, Stewart SL, Wilson RJ. Racial and ethnic variations in the incidence of cancers of the uterine corpus, United States, 2001–2003. J Womens Health (Larchmt) 2009;18:285–94. [DOI] [PubMed] [Google Scholar]
- 5.White MC, Espey DK, Swan J, Wiggins CL, Eheman C, Kaur JS. Disparities in cancer mortality and incidence among American Indians and Alaska Natives in the United States. American journal of public health 2014;104 Suppl 3:S377–87. [DOI] [PMC free article] [PubMed] [Google Scholar]
- 6.Becker TM, Bettles J, Lapidus J, et al. Improving cancer incidence estimates for American Indians and Alaska Natives in the Pacific Northwest. American journal of public health 2002;92:1469–71. [DOI] [PMC free article] [PubMed] [Google Scholar]
- 7.Espey DK, Wu XC, Swan J, et al. Annual report to the nation on the status of cancer, 1975–2004, featuring cancer in American Indians and Alaska Natives. Cancer 2007;110:2119–52. [DOI] [PubMed] [Google Scholar]
- 8.Hoopes MJ, Petersen P, Vinson E, Lopez K. Regional differences and tribal use of American Indian/Alaska Native cancer data in the Pacific Northwest. J Cancer Educ 2012;27:S73–9. [DOI] [PubMed] [Google Scholar]
- 9.Singh SD, Ryerson AB, Wu M, Kaur JS. Ovarian and uterine cancer incidence and mortality in American Indian and Alaska Native women, United States, 1999–2009. American journal of public health 2014;104 Suppl 3:S423–31. [DOI] [PMC free article] [PubMed] [Google Scholar]
- 10.Strickland CJ, Squeoch MD, Chrisman NJ. Health promotion in cervical cancer prevention among the Yakama Indian women of the Wa’Shat Longhouse. Journal of transcultural nursing : official journal of the Transcultural Nursing Society / Transcultural Nursing Society 1999;10:190–6. [DOI] [PubMed] [Google Scholar]
- 11.Watson M, Benard V, Thomas C, Brayboy A, Paisano R, Becker T. Cervical cancer incidence and mortality among American Indian and Alaska Native women, 1999–2009. American journal of public health 2014;104 Suppl 3:S415–22. [DOI] [PMC free article] [PubMed] [Google Scholar]
- 12.Dankovchik J, Hoopes MJ, Warren-Mears V, Knaster E. Disparities in life expectancy of pacific northwest American Indians and Alaska natives: analysis of linkage-corrected life tables. Public Health Rep 2015;130:71–80. [DOI] [PMC free article] [PubMed] [Google Scholar]
- 13.Fay MP, Feuer EJ. Confidence intervals for directly standardized rates: a method based on the gamma distribution. Stat Med 1997;16:791–801. [DOI] [PubMed] [Google Scholar]
- 14.Ingram DDFS. 2013 NCHS urban-rural classification scheme for counties In: Statistics NCfH, ed.: Centers for Disease Control and Prevention; 2014. [PubMed] [Google Scholar]
- 15.Weir HK, Jim MA, Marrett LD, Fairley T. Cancer in American Indian and Alaska Native young adults (ages 20–44 years): US, 1999–2004. Cancer 2008;113:1153–67. [DOI] [PubMed] [Google Scholar]
- 16.Lee NC, Wong FL, Jamison PM, et al. Implementation of the National Breast and Cervical Cancer Early Detection Program: the beginning. Cancer 2014;120 Suppl 16:2540–8. [DOI] [PMC free article] [PubMed] [Google Scholar]
- 17.Zahnd WE, James AS, Jenkins WD, et al. Rural-Urban Differences in Cancer Incidence and Trends in the United States. Cancer Epidemiol Biomarkers Prev 2018;27:1265–74. [DOI] [PMC free article] [PubMed] [Google Scholar]
- 18.Spence AR, Goggin P, Franco EL. Process of care failures in invasive cervical cancer: systematic review and meta-analysis. Prev Med 2007;45:93–106. [DOI] [PubMed] [Google Scholar]
- 19.IHS FY 2016, 2017, 2018 Performance (GPRA) Measures - Tribal, IHS Direct and Urban Programs. 2017. at www.ihs.gov/crs/includes/themes/responsive2017/display_objects/documents/gpra/2018/2016-208_Matrix.pdf.)
- 20.Percent of women aged 18 and over who had a pap test within the past 3 years. 2015. at www.cdc.gov/nchs/data/hus/2017/071.pdf.)
- 21.Huh WK, Ault KA, Chelmow D, et al. Use of primary high-risk human papillomavirus testing for cervical cancer screening: interim clinical guidance. Gynecologic oncology 2015;136:178–82. [DOI] [PubMed] [Google Scholar]
- 22.Institute. TPsCPNC. Accelerating HPV Vaccine Uptake: Urgency for Action to Prevent Cancer. A report to the President of the United States from the President’s Cancer Panel 2014. [Google Scholar]
- 23.de Sanjose S, Quint WG, Alemany L, et al. Human papillomavirus genotype attribution in invasive cervical cancer: a retrospective cross-sectional worldwide study. The lancet oncology 2010;11:1048–56. [DOI] [PubMed] [Google Scholar]
- 24.Reagan-Steiner S, Yankey D, Jeyarajah J, et al. National, Regional, State, and Selected Local Area Vaccination Coverage Among Adolescents Aged 13–17 Years - United States, 2015. MMWR Morb Mortal Wkly Rep 2016;65:850–8. [DOI] [PubMed] [Google Scholar]
- 25.Walker T. National, Regional, State, and Selected Local Area Vaccination Coverage Among Adolescents Aged 13–17 Years - United States, 2017. Morbidity and Mortality Weekly Report 2018;67. [DOI] [PMC free article] [PubMed] [Google Scholar]
- 26.Henley SJ, Miller JW, Dowling NF, Benard VB, Richardson LC. Uterine Cancer Incidence and Mortality - United States, 1999–2016. MMWR Morb Mortal Wkly Rep 2018;67:1333–8. [DOI] [PMC free article] [PubMed] [Google Scholar]
- 27.Bogani G, Dowdy SC, Cliby WA, Ghezzi F, Rossetti D, Mariani A. Role of pelvic and para-aortic lymphadenectomy in endometrial cancer: current evidence. J Obstet Gynaecol Res 2014;40:301–11. [DOI] [PMC free article] [PubMed] [Google Scholar]
- 28.Rossi EC, Kowalski LD, Scalici J, et al. A comparison of sentinel lymph node biopsy to lymphadenectomy for endometrial cancer staging (FIRES trial): a multicentre, prospective, cohort study. The lancet oncology 2017;18:384–92. [DOI] [PubMed] [Google Scholar]
- 29.Ward KK, Shah NR, Saenz CC, McHale MT, Alvarez EA, Plaxe SC. Cardiovascular disease is the leading cause of death among endometrial cancer patients. Gynecologic oncology 2012;126:176–9. [DOI] [PubMed] [Google Scholar]
- 30.Arem H, Chlebowski R, Stefanick ML, et al. Body mass index, physical activity, and survival after endometrial cancer diagnosis: results from the Women’s Health Initiative. Gynecologic oncology 2013;128:181–6. [DOI] [PMC free article] [PubMed] [Google Scholar]
- 31.Kurian AW. BRCA1 and BRCA2 mutations across race and ethnicity: distribution and clinical implications. Curr Opin Obstet Gynecol 2010;22:72–8. [DOI] [PubMed] [Google Scholar]
- 32.Board NTEC-NPAIH. Northwest Tribal Registry, 9th version (NTR9) Data Assessment 2012.
- 33.Edwards BK, Noone AM, Mariotto AB, et al. Annual Report to the Nation on the status of cancer, 1975–2010, featuring prevalence of comorbidity and impact on survival among persons with lung, colorectal, breast, or prostate cancer. Cancer 2014;120:1290–314. [DOI] [PMC free article] [PubMed] [Google Scholar]