Abstract
Singular value decomposition (SVD)-based clutter filters can robustly reject the tissue clutter as compared with the conventional high pass filter-based clutter filters. However, the computational burden of SVD makes real time SVD-based clutter filtering challenging (e.g. frame rate at least 10–15 Hz with region of interest of about 4×4 cm2). Recently, we proposed an acceleration method based on randomized SVD (rSVD) clutter filtering and randomized spatial downsampling, which can significantly reduce the computational complexity without compromising the clutter rejection capability. However, this method has not been implemented on an ultrasound scanner and tested for its performance. In this study, we implement this acceleration method on a Verasonics scanner using a multi-core CPU architecture, and evaluate the selections of the imaging and processing parameters to enable real time micro-vessel imaging. The Blood-to-Clutter Ratio (BCR) performance was evaluated on a Verasonics machine with different settings of parameters such as block size and ensemble size. The demonstration of real time process was implemented on a 12-core CPU (downsampling factor of 12, 12-threads in this study) host computer. The processing time of the rSVD-based clutter filter was less than 30 ms and BCRs were higher than 20 dB as the block size, ensemble size and the rank of tissue clutter subspace were set as 30×30, 45 and 26 respectively. We also demonstrate that the micro-vessel imaging frame rate of the proposed architecture can reach approximately 22 Hz when the block size, ensemble size and the rank of tissue clutter subspace were set as 20×20 pixels, 45 and 26 respectively (using both images and supplementary videos). The proposed method may be important for real time 2D scanning of tumor microvessels in 3D to select and store the most representative 2D view with most abnormal micro-vessels for better diagnosis.
Keywords: Randomized SVD, spatial downsampling, micro-vessel imaging
I. Introduction
Ultrafast plane wave imaging [1] offers high frame rate data acquisition to capture large number of ultrasound frames, resulting in increased signal to noise ratio and sensitivity of Doppler signals [2, 3]. To detect the existence of small blood vessels or micro-vessels, strong tissue clutter or stationary signals should be removed. Conventionally, high-pass filtering was used to remove tissue clutter signal. However, it is difficult to separate slow motion blood vessel signals from the tissue clutter signals using high-pass filtering method, thus, making detection of the small blood vessels infeasible.
To better separate tissue clutter signals from slow motion blood vessel signals, spatial-temporal filtering approach based on eigenvalue or singular value decomposition were [4–8] proposed. Tissue backscatter signal reveals higher spatiotemporal coherence and power than blood signal, which can be conveniently separated from blood signals in the domain of singular-values. By using ultrafast plane wave excitation and spatial-temporal filtering, large number of Doppler ensembles can be obtained to improve the detection of slow blood flow signals of small vessels for microvessel imaging. Note that micro-vessel imaging in this study refers to the detection of slow blood flow signals in the micro-vessels using the proposed method, the exact size of micro-vessels are not really being evaluated in this work. However, a significant part in spatial-temporal filtering is to determine the threshold to separate tissue and blood signals. To address this issue, spatial-correlation method [9] and lower order thresholding [10] have been proposed to determine the required threshold. Besides, robust principal component analysis (RPCA) [11] has been proposed to estimate tissue and blood signals, however, the drawback of this approach is the selections of threshold parameters. Therefore, a convolution-based deep learning RPCA [12] has been proposed which revealed higher clutter suppression capability and lower computational complexity than that of RPCA.
To realize SVD, central processing unit (CPU) and/or graphical processing unit (GPU) architectures have been proposed in the previous studies. One of the efficient algorithms for SVD is to use Golub-Reinsch (Bidiagonalization and Diagonalization) algorithm where the bidiagonalization process was performed in a GPU and the diagonalization process was performed in a CPU [13, 14]. The SVD-based clutter filter requires forming a two-dimensional spatio-temporal matrix from the entire three-dimensional data set (spatial domain: nz by nx; and slow-time temporal domain/ensemble size: nt). The theoretical computational complexity of the SVD of a spatio-temporal matrix is O(nz×nx×nt2) [14, 15]. Due to the large amount of ultrasound data acquired by ultrafast ultrasound plane wave Doppler imaging, high computational complexity is demanded for the SVD process. For example, for an ultrafast plane wave Doppler acquisition with the image size (nz×nx) of 90×90 pixels (corresponding to about 4 cm × 4 cm with a spatial resolution of 0.45 mm) and 64 ensembles (nt), the full SVD process took nearly 5.1 seconds using a CPU (Intel dual core 2.66GHz) and a GPU (GTX 280) as mentioned in [14]. This computation time does not include the computation time for the reconstruction of blood signal, software-based beamforming, and image processing. Consequently, it is essential to accelerate the SVD calculation to make real time microvessel imaging feasible.
Recently our group presented the use of randomized SVD (rSVD) [16] combined with randomized spatial downsampling (rSD) [17] as a solution for real-time SVD clutter filtering. Instead of computing all singular values, rSVD only computes the first nk singular values (where nk ≪ nt) representing the tissue clutter signal, which significantly reduces its computational complexity compared to SVD calculation. Theoretically, the computational complexity of rSVD is O(nz × nx × nt × log(nk)). Thus, computational complexity can be dramatically reduced as nk ≪ nt.
rSVD can be further accelerated by rSD, which converts the large original matrix into several small downsampled sub-matrices for faster parallel computation using the rSVD. The combination of rSVD and rSD is well suited for a multicore or multithread architecture because the computation process of each downsampled sub-matrix has identical dimensions and processing steps, and they can be processed independently in parallel.
Our previous work showed that clutter suppression capability using rSVD+rSD clutter filtering can achieve similar performance as compared to global SVD methods. It also showed that rSVD-based clutter filtering outperformed high-pass filtering [17]. However, only the feasibility of rSVD+rSD clutter filtering was presented without implementing the method on an ultrasound scanner to perform real time micro-vessel imaging. Therefore, the goal of this study was to implement rSVD+rSD on the Verasonics Vantage system based on multi-CPU architecture, and to investigate the imaging parameter selections for optimal real-time micro-vessel imaging performance. Noted that typical real-time Doppler imaging reached frame rate around 10–20 Hz with ensemble size of 6–12 [18]. In this study, the frame rate is aimed at around 20 Hz for the real-time imaging.
Furthermore, it is well recognized that ultrafast micro-vessel imaging is vulnerable to electronic noise, which manifests in the form of a ramp-shaped background noise profile [10] which hamper the flow detection performance. The expression of the clutter filtered signal (X) consists of complex blood flow signal and additive noises:
| (1) |
where B is complex blood signal, N’ is the additive noise after clutter filtering, x and z correspond to the lateral and axial dimensions of the ultrasound image, respectively, and i corresponds to the temporal dimension (referred to the slow-time dimension). One effective approach to mitigate the background noise is adaptive block-wise SVD clutter filtering [14], which suppresses background noise by rejecting high-order singular values. However, the block-wise SVD is computationally expensive because large amount of SVD calculations should be required for the spatially overlapping subsets of data. Another noise suppression method is based on noise equalization [19]. A full SVD calculation is used to compute the highest order singular value to derive the required noise field, then the noise field is used to equalize the power Doppler image. Therefore, both methods are not suitable for rSVD because rSVD does not calculate the high-order singular values. For the real time micro-vessel imaging, a computationally simple yet effective noise suppression method is used to reduce the background noise power in this study.
The remainder of this paper is organized as follows: Section II presents an overview of the principle of rSVD, rSD, noise suppression, multi-thread architecture, and imaging sequence. The setups for the flow phantom and in vivo experiments are also presented in this section. Section III presents the results of the processing times of rSVD-based clutter filter with the proposed architecture. Blood-to-clutter ratios of flow phantom and in vivo experiments are also presented in this section. Discussion and conclusions are in Sections IV and V, respectively.
II. Materials and Method
A. rSVD and Randomized Spatial Downsampling
sAn ultrasound data set (with t frames of 2D image each consisting of m×n pixels) can be reshaped into a 2D spatial-temporal data matrix S with a dimension of (mn×t), with each column representing one ultrasound frame. The matrix form can be expressed as
| (2) |
where T, B and N represent the tissue, blood and additive noise matrix. The basic concept of the SVD-based clutter filtering is to find the tissue clutter signal which are typically embedded in the SVD components of the ultrasound time series and then to subtract them from the original beamformed signal. Randomized SVD [16] is a computational strategy that estimates a subset of SVD components with reduced computation time, at the cost of minor approximation error. rSVD first multiplies S with a random matrix R with a dimension of (t×k):
| (3) |
where the dimension of projected matrix S’ is (mn×k). The rank of the tissue clutter k is usually much smaller than t. In addition, each entry of R is drawn from a Gaussian distribution with zero mean and unit variance.
Then the Q matrix is computed by QR decomposition of the projected matrix S’. To increase the singular value decay rate of rSVD decomposition, power iteration [16] is used to compute Q matrix. Assuming that the tissue signal is located at the first k singular values and the blood and noise signal are located at the last (t-k) singular values, the tissue signal can be approximated as
| (4) |
where Q* means the complex conjugate transpose matrix of Q.
The final step is to subtract the QQ * S from the original matrix S to obtain the required blood signals
| (5) |
It should be noted that background noise can be distributed over the full range of singular values; thus, in practice, a minor portion of noise components may be removed along with the rejection of first k singular values indicated by (5).
Since the complexity of the QR decomposition can be reduced after matrix projection in the first step, the computational cost of QR decomposition for each matrix is O(mnk2). Consequently, the computational complexity of rSVD is much lower than the traditional SVD calculation process when k ≪ t. It should be noted that the tissue clutter can be removed to obtain blood signal.
Due to the linear complexity of the rSVD process, the computational time decreases quickly as the number of rows of the spatiotemporal matrix decreases. rSD can be used to decompose a large matrix into several downsampled sub-matrices for faster rSVD calculation. Compared to uniform or block-wise downsampling, the main advantage of randomized spatial downsampling is reduced gridding/block artifacts [17]. The procedure of rSD method is shown in Fig 1. rSD randomly distributes pixels of the entire region of interest (ROI) for micro-vessel imaging to multiple downsampled sub-matrices for parallel processing. In the example in Fig. 1, the original matrix consists of 6 frames of ultrasound data; each frame has 9×12 pixels (spatial domain). rSD randomly distributes the pixels to downsampled sub-matrices. Each downsampled sub-matrix has a spatial dimension (called “block size” for the rest of this paper) of 3×3 pixels and a temporal dimension of 6 frames (equivalent to a 9×6 spatio-temporal downsampled sub-matrix). For a computer with 12 CPUs, 12 downsampled sub-matrices can go through rSVD in parallel to reduce computation time for tissue clutter rejection. After tissue clutter filtering, pixels from the 12 sub-matrices can be placed back to their original position to reconstruct the micro-vessel image.
Fig. 1.
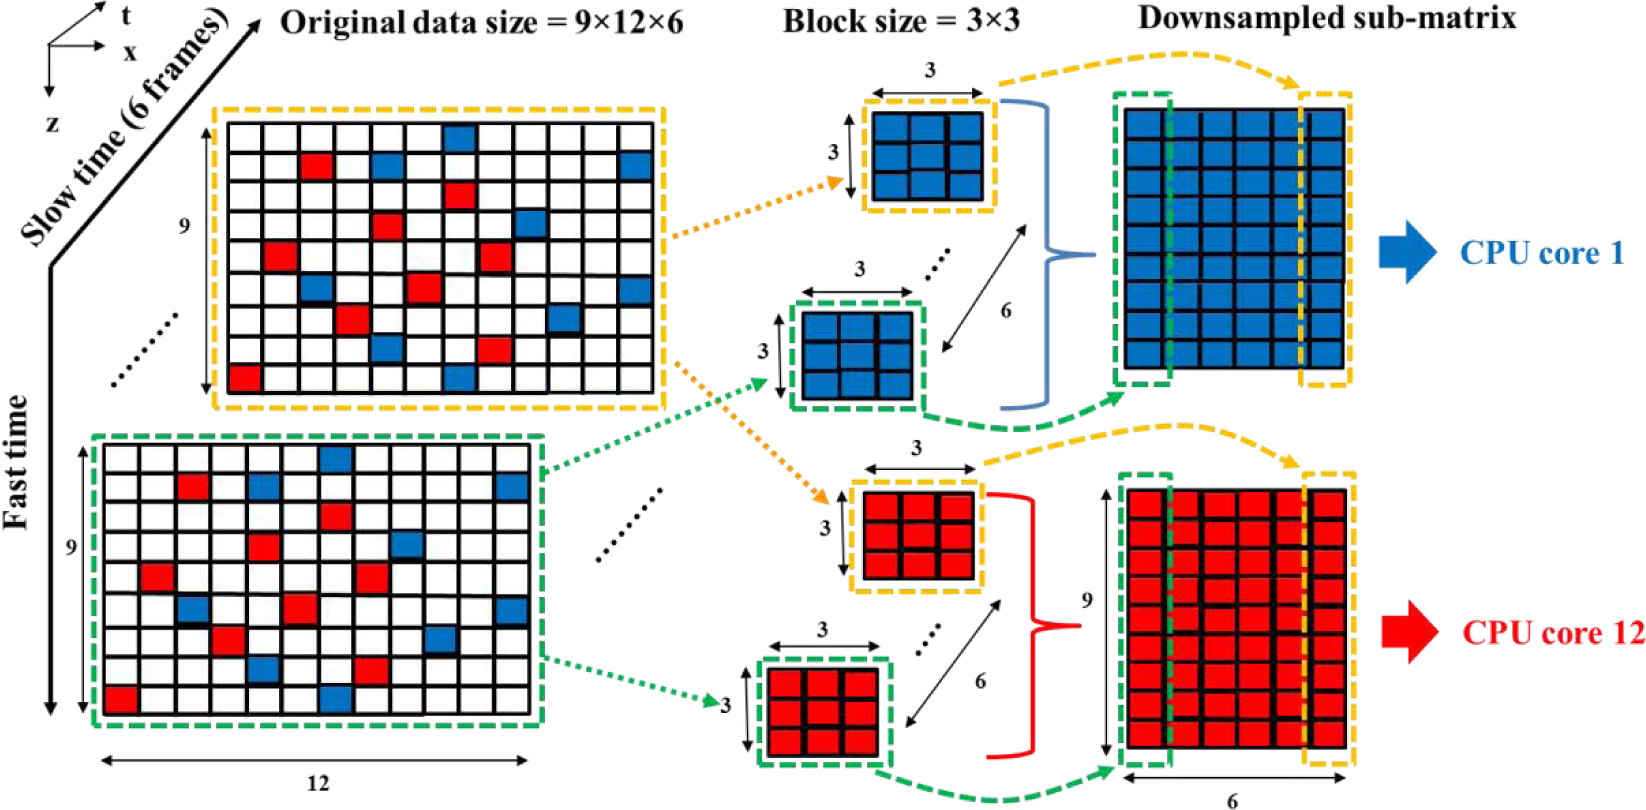
Schematic plot of randomized spatial downsampling to construct two downsampled sub-matrices. The blue and red pixels indicate the samples to construct the 1st and the 12th downsampled sub-matrix. To construct a downsampled sub-matrix, 3×3 pixels (block size) are randomly drawn in spatial domain (blue pixels in the green dashed box), and then the corresponding pixels along temporal domain (e.g. blue pixels in the yellow dashed box) are also selected. 12 downsampled sub-matrices (9×6 pixels each) then go through rSVD process in parallel using different CPU cores.
B. Noise Suppression
The fusion image of B mode and micro-vessel images using diverging wave transmission is shown in Fig. 2 (a). The power Doppler (PD) microvessel image can be calculated as the power of Doppler signal at each spatial pixel, and the expectation of PD microvessel image is given by
| (6) |
| (7) |
Fig. 2.
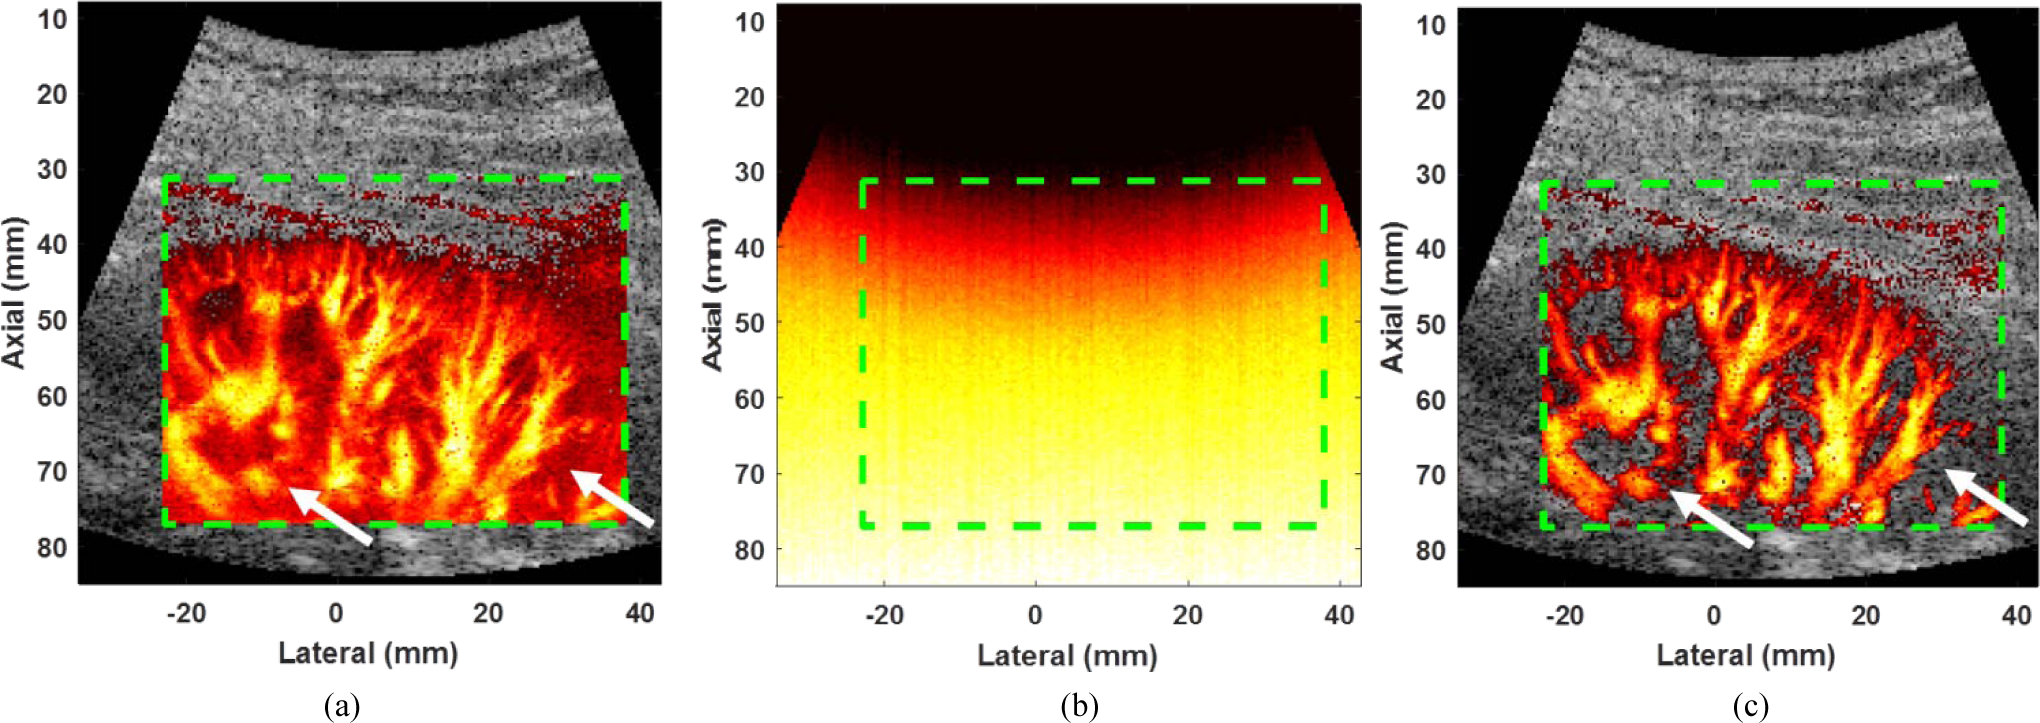
(a) Original micro-vessel image: background noise is clearly visible at depth greater than 40 mm (see white arrows). (b) Power Doppler image of noise obtained by turning off the ultrasound transmission. (c) Micro-vessel image after subtracting (b) from (a), background noise is suppressed at depth greater than 40 mm (see white dashed box). The green dashed boxes represent the region of interests for (a), (b) and (c). The minimum and the maximum dynamic range values of dual-mode images were set as −50 dB and 0 dB, respectively.
The first term at the right side of eq. (7) is the desired power Doppler signal and the second term is the noise power term. Noted that the cross-terms in eq. (6)) are all zeros and (a)* indicates complex conjugate of a, and P is the ensemble size. In this study, we estimate the background noise power in the second term at the right side of eq. (7)), and the noise power map as shown in Fig. 2 (b) are then subtracted from the power Doppler signal (Fig. 2 (a)) to achieve high quality micro-vessel imaging as shown in Fig. 2 (c) [20].
C. Imaging Sequence and Signal Processing
The real time imaging sequence included repeated sessions of hybrid acquisition. Each hybrid session consisted of one B-mode acquisition (with a full field-of-view) and one micro-vessel acquisition (with a rectangular ROI smaller than the full field-of-view). As shown in Fig. 3 (a), three diverging waves with different transmission angles were used for compounding for both B-mode and micro-vessel imaging mode. Each transmission angle was fired twice, and the radio frequency (RF) echoes were summed to increase SNR (Signal-to-noise ratio): this summation was performed before beamforming to reduce computation load (i.e., only one beamforming for two pulse-echo events). The software-based beamforming process was performed using the Verasonics internal reconstruction function; which is based on pixel-oriented processing to suit the multi-core CPU architecture [21]. After beamforming, the IQ data from 3 different angles were summed together to form a single post-compounded IQ data frame. In this study, the transmitted angles were −4 (red bar), 0 (green bar), and 4 (orange bar) degrees. The post-compounded IQ frame rate (PCFR) is defined as the frame rate to acquire 1 post-compounded IQ frame. Noted that the PCFR only considered the acquisition rate to acquire the required compounding frames (e.g. acquire 6 frames as shown in Fig. 3) and it did not relate to any process. In real time imaging mode, each dual-mode image frame consists of a full field-of-view B-mode image with a power Doppler micro-vessel image overlaid within a smaller ROI. Therefore, each dual-mode image frame requires one post-compounded B-mode IQ frame and one micro-vessel image reconstructed from an ensemble of N post-compounded IQ frames (N is called “ensemble size” in this paper). Using this imaging sequence, the acquisition rate for dual-mode imaging is
| (8) |
Where PCFT, PCFR and N are the post-compounding frame time, post-compounding frame rate and ensemble size. For example, if the PCFR and ensemble size are set as 1 kHz and 50, then the acquisition rate reaches around 19.6 Hz (acquisition time = 51 ms).
Fig. 3.
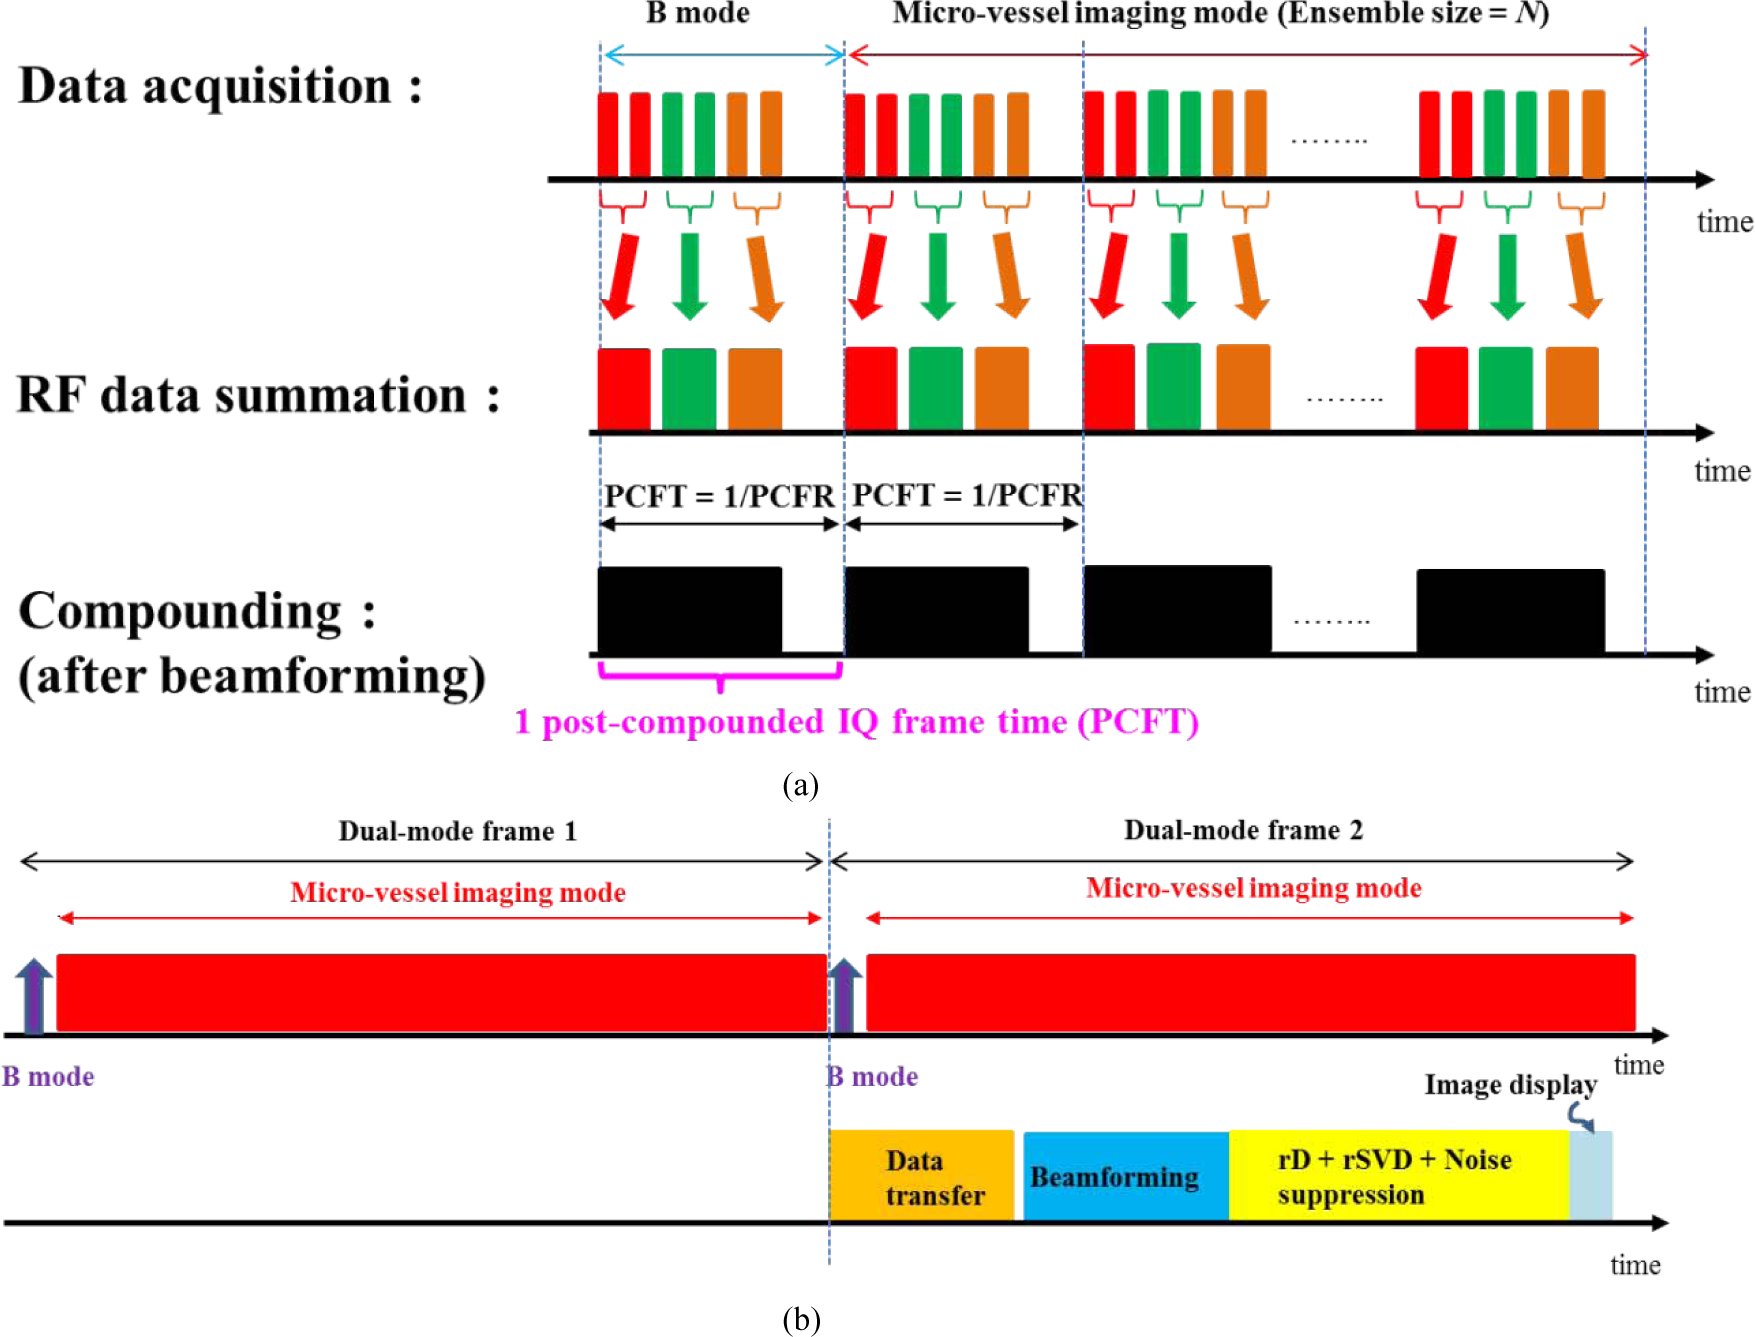
(a) Schematics of capturing and summing RF data, as well as IQ data compounding for both B-mode and micro-vessel imaging mode. PCFR is the frame rate to acquire 1 post-compounded IQ frame. Each post-compounded IQ frame consists of 6 firings as well. Ensemble size = N means that an ensemble consists of N post-compounded IQ frames. (b) Schematics for acquisition, beamforming, rSVD-based clutter filter, and image processing.
As shown in Fig 3 (b), signal processing of the 1st dual-mode frame was performed during data acquisition of the 2nd dual-mode frame. For signal processing, a multicore CPU performed software-based beamforming (blue block) using the acquired RF data, beamforming process generated IQ data for the rSVD+rSD clutter filtering (yellow block). The image processing was then displayed afterwards. It should be noted that the clutter filtering consists of rSVD, rSD, and noise suppression. The processing rate for dual-mode imaging is defined as the frame rate of all signal processes (beamforming + rSVD-based clutter filtering + image processing) which can be expressed as
| (9) |
The final frame rate of dual-mode imaging using the proposed architecture is
| (10) |
where min(x, y) denotes the minimum value between x and y.
D. Multi-thread CPU Architecture on a Verasonics system
An rSVD-based clutter filter with noise suppression was implemented as an external function utilizing pthreads (a set of C programming language types, functions and constants specified by the IEEE POSIX 1003.1c standard) for parallelism; the corresponding architecture is presented in Fig. 4. After beamforming process using Versaonics’ reconstruction, the beamformed in-phase quadrature (IQ) data were stored in the IQ data buffer (specified as IQData in Verasonics). Then data were drawn from the IQ data buffer using a random permutation table to form 12 downsampled sub-matrices. Each downsampled sub-matrix was assigned to a separate thread for parallel rSVD clutter filtering. As expressed in equations (3), (4) and (5), the main efforts of rSVD process are matrix multiplications and QR decomposition. For matrix multiplications, Intel Math Kernel Library (MKL) provides highly optimized matrix multiplication function for multi-thread architectures when using Intel CPU processes [22]. Therefore, MKL (version 2018) was used to perform all matrix multiplications in this study. For the QR decomposition, instead of computing both Q and R matrices, Householder-based block QR decomposition [23] was used to compute the Q matrix only to accelerate the computational speed. The Householder-based block QR matrix was implemented by Level-3 BLAS (Basic Linear Algebra Subprograms) which allows high computational performance in a multi-core CPU architecture [24]. The corresponding libraries and P-thread architecture were linked to the MATLAB through MEX files (version 2014a, MathWorks, Inc., Natick, MA, USA) which can be accessed by Verasonics system.
Fig. 4.
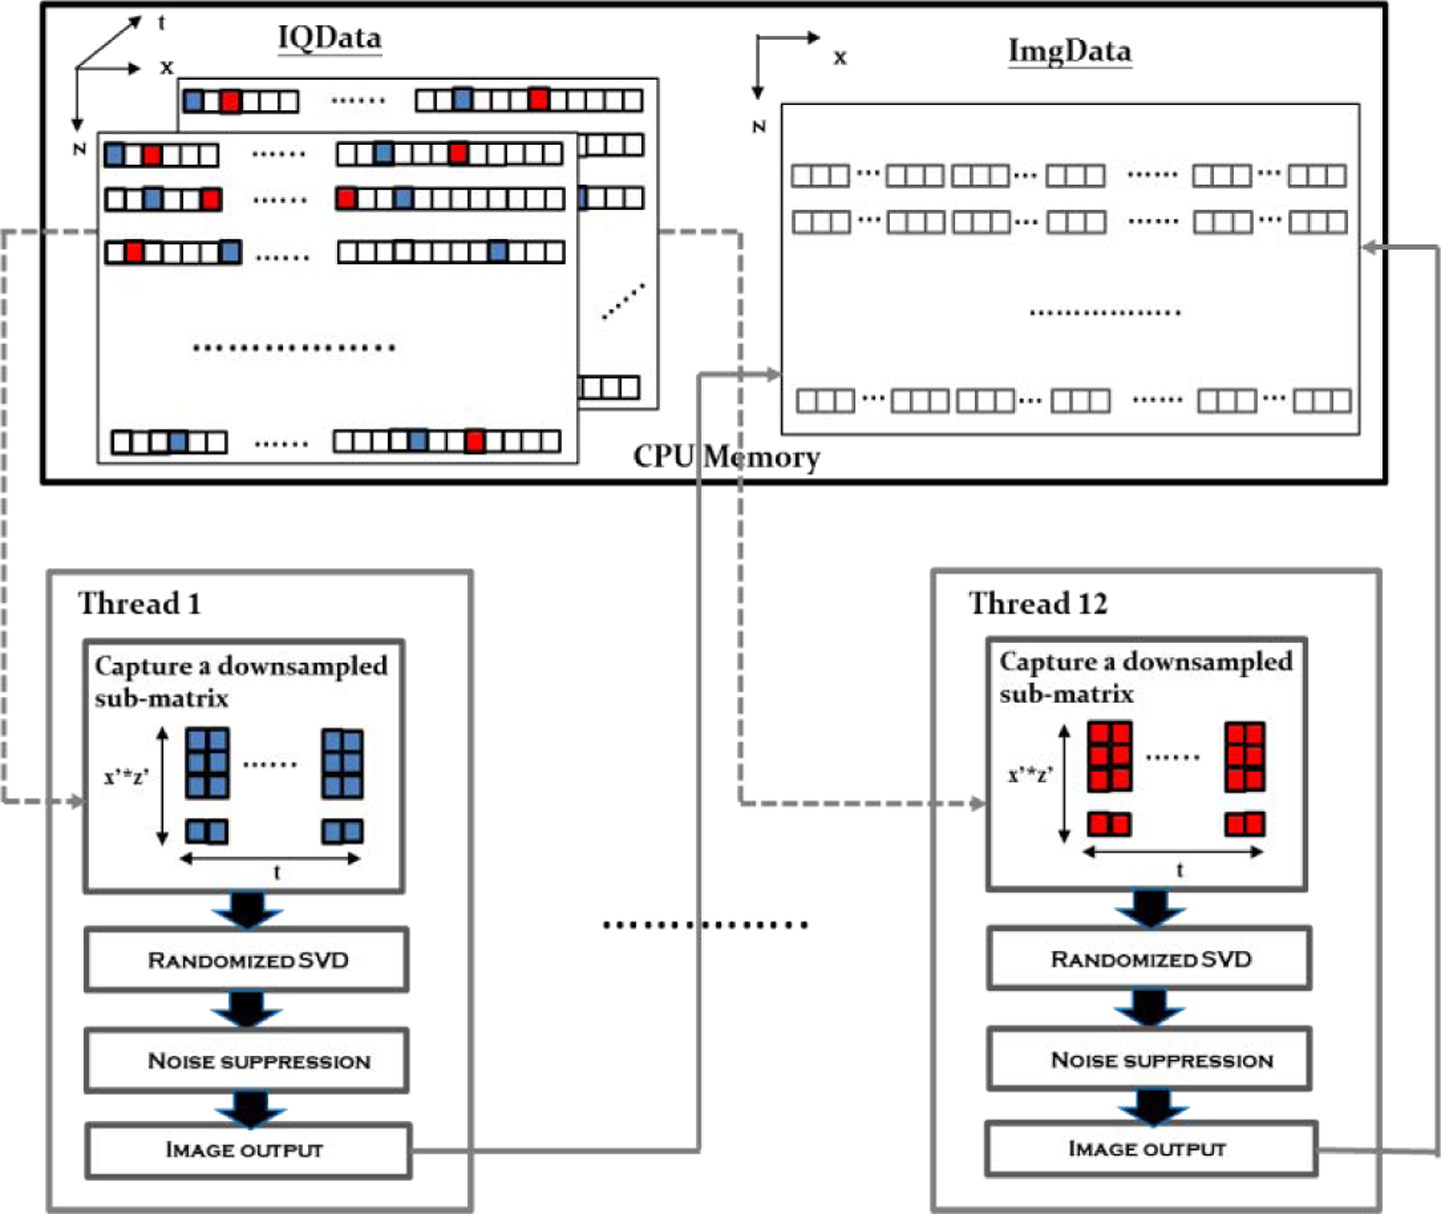
Diagram of rSVD-based clutter filter and image processing for multi-thread architecture. The 1st and the 12th threads are shown to demonstrate that all the processes are identical for different threads. The 1st downsampled sub-matrix (representing by blue pixels) and the 12th downsampled sub-matrix (representing by red pixels) are drawn from the IQData buffer according to the random permutation table. For each thread, processes of rD, rSVD, and noise suppression are computed for the downsampled sub-matrix. Finally, the output image data in each thread are combined according to their original positions identified in the random permutation table and stored in the ImgData buffer.
On the other hand, the choice of the rank of tissue clutter for rSVD process can be tuned and updated (blue dashed box) during the real time imaging by graphical user interface (GUI) as shown in Fig. 5. SVD curve (green dashed box) and SVD (red dashed box) buttons were used to show all singular values and apply MATLAB SVD process to the ultrasound IQ data as well. The ranks of tissue clutter subspace were automatically selected using the lower-order singular value thresholding method described in [10]. The lower-order singular value threshold is determined by computing the gradient of the singular value curve to identify a turning point from which the curve begins to flatten. In this study, the lower-order singular value threshold was computed globally and applied to all blocks.
Fig. 5.
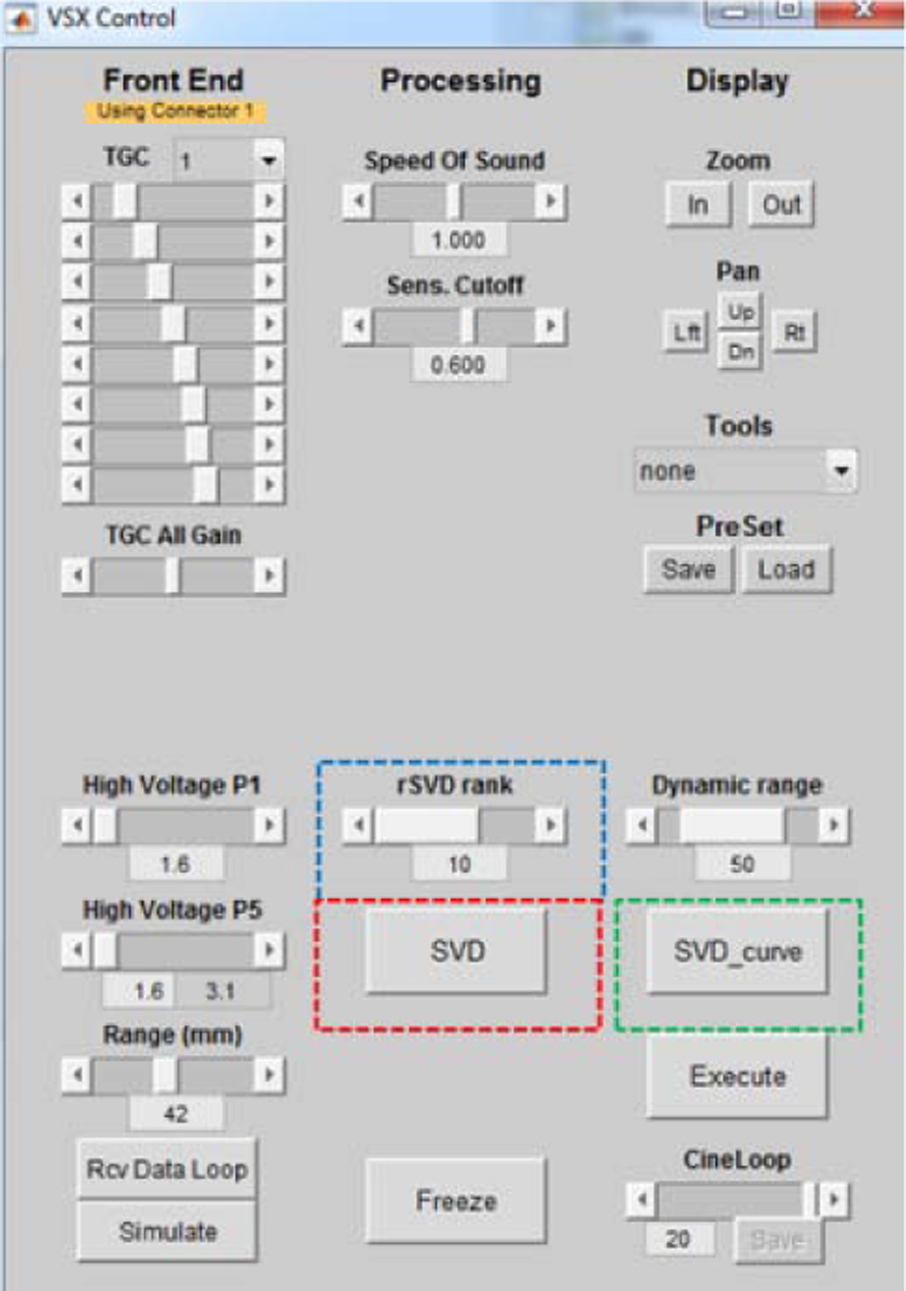
GUI for users to tune the rank of tissue clutter subspace (rSVD rank), TGC, as well as to perform full SVD (SVD) and to show all singular values (SVD_curve).
The noise subtraction method shown in Fig. 2 was applied to suppress noise in the micro-vessel image. Finally the B-mode and micro-vessel images were stored in the image buffer (specified as ImgData in Verasonics) for further image display. As the Verasonics host computer had 12 CPUs, the number of threads was set as 12 in this study to simultaneously process 12 downsampled sub-matrices. It means that the area of the final ROI for micro-vessel imaging is always 12 times the area of a sub-matrix. For example, if the block size of the downsampled sub-matrices is set as 30×30 pixels, then the final ROI for micro-vessel imaging will have an area of 90×120 pixels (60×80 pixels for block size of 20×20), which is similar to the example shown in Fig. 1.
E. Flow Phantom Study
To investigate the selections of parameters such as post-compounded IQ frame rate and ensemble size, blood-to-clutter ratio were evaluated on a customized vessel phantom (Gammex, Middleton, WI, USA, the diameter of the vessel phantom is 2 mm) with a Verasonics Vantage 256 channel system (Verasonics Inc., Kirkland, WA, USA) and a 192 channel curved linear array transducer C1–6-D (General Electric Healthcare, Wauwatosa, WI, USA). The system used 14 bits for sampling. The transmit frequency and sampling rate were set at around 4.16 MHz and 16.67 MHz, respectively. The host computer system used in this study comprised an Intel Xeon E5–2680 CPU with 12 cores (2.5 GHz) and 192 GB random access memories (RAM). Since the ROI and number of pulse cycles for B mode and micro-vessel imaging mode are different, data in B mode cannot be included to calculate the power Doppler map. The corresponding default settings for B and micro-vessel mode are listed in Table I. In addition, the syringe was attached to a motorized syringe pump (New Era Pump, N1000) to pump blood mimicking fluid (Gammex, Middleton, WI, USA, sound speed of 1550 m/s and density of 1.03 g/cm3) through the customized vessel phantom with a constant flow velocity. The spatial resolution of the ultrasound data was 0.45 mm. The size of ROI was set to 60×80, 75×100, or 90×120 pixels, which was downsampled to 12 sub-matrices with block size of 20×20, 25×25, or 30×30 pixels, respectively, for parallel computation on 12 CPUs. For each combination of ROI size, three different flow velocities of 1 cm/s, 2 cm/s, and 4 cm/s were tested. To simulate tissue clutter with relative motion, a mechanical shaker (LDS Model V203, Brüel and Kjær North America, Norcross, GA, USA) was used on the top of the phantom to generate a continuous mechanical vibration with frequencies of 26 Hz, 52 Hz, and 103 Hz (which is approximately 1, 2, and 4 cm/s flow rate with 4 MHz ultrasound center frequency) during dual-mode real time phantom imaging. In addition, FIR high-pass filters (using MATLAB function “fir1”, tenth order high-pass filter with cutoffs of 20 Hz, 40 Hz and 80 Hz for PCFRs of 250 Hz, 500 Hz and 1 kHz, respectively) were used to provide benchmarking for this experiment.
TABLE I.
Parameters of B mode and micro-vessel mode
| Parameter | B mode | Micro-vessel mode |
|---|---|---|
| Start depth (wavelength) | 0 λ | 20 λ |
| End depth (wavelength) : (block size) | 180 λ | 92 λ : (20×20), 110 λ : (25×25), 128 λ : (30×30) |
| Width (wavelength) | 180 λ | 96 λ : (20×20), 120 λ : (25×25), 144 λ : (30×30) |
| Number of pulse cycles | 1 | 2 |
F. In vivo Study
The performance of dual-mode real time imaging was also tested on the kidney of a healthy volunteer using a Verasonics Vantage system and a curved linear array transducer C1–6-D. This study was performed with IRB approval; the age of the male healthy volunteer was 31 year old. The healthy volunteer was recruited by the coordinator who explained the whole scanning process. The clinical data were then captured in an ultrasonic scanning room. The transmit frequency (4.16 MHz), sampling rate (16.67 MHz) and spatial resolution (0.45 mm) are identical to that in the phantom study. The start depth was set as 30 λ (~13.8 mm) and the end depths were set as 102 λ, 120 λ, and 138 λ for block sizes of 20×20, 25×25, or 30×30 pixels, respectively. In addition, these settings were used to evaluate the computational times of rSVD process with respect to the rank of tissue clutter subspace. The computational times of rSVD, beamforming, and image processing were evaluated by an MATLAB function tic/toc to measure the time required for a process. In addition, two methods, spatial correlation and lower order thresholding, were used for the estimation of the required threshold for the rank of tissue clutter subspace
G. Evaluation Metrics
In this study, the blood-to-clutter ratio (BCR), peak-to-side-level (PSL) and signal-to-noise ratio (SNR) were used as the performance using the proposed settings as follows
| (11) |
| (12) |
| (13) |
where the Bmean is the mean blood power, Bpeak is the peak blood power and Tmean is the mean tissue power in the defined region of interests. Nmean is the variance of the background noise in the defined region of interests.
III. Results
A. Flow Phantom Experiment
Figure 6 (a)–(c) show the region of interests (representing as green dashed boxes) of the power Doppler images for block size of 20×20, 25×25, and 30×30, respectively. The white (representing tissue) and black (representing blood) boxes indicate the regions used to evaluate the blood-to-clutter ratio (BCR). The imaging peak to peak voltage was set as 50 V as well. In addition, as described in eq. (8)), the acquisition rate depends on PCFR and ensemble size. When the ensemble size is set as 50, a PCFR of 250 Hz, 500 Hz, and 1000 Hz will limit the acquisition rate to 4.9 Hz, 9.8 Hz, and 19.6 Hz, respectively.
Fig. 6.

Power Doppler images of the vessel phantom with block size of (a) 20×20, (b) 25×25, (c) 30×30, and (d) global SVD with full frame. The green dashed box represents the ROIs of the power Doppler images. The blue, cyan and black solid boxes (representing tissue), and the blue, cyan and black dashed boxes (representing blood) indicate the ROIs used to evaluate the blood-to-clutter ratio. The dynamic range was set as 50 dB for all images. The ensemble size, PCFR and rank of tissue clutter subspace were set as 40, 1 kHz, and 12, respectively. The dynamic ranges of B mode and power Doppler images were set as 50 dB for all images. The minimum and the maximum dynamic range values of dual-mode images were set as −50 dB and 0 dB, respectively.
As shown in Fig. 7, the BCR using rSVD was slightly improved with the block size. In addition, BCR increased with ensemble size N, but the improvement slowed down for N>40. Lastly, low post-compound IQ frame rate gave higher BCR for slow flow. However, low post-compounded frame rate combined with large ensemble size can reduce acquisition rate and thus the final frame rate of dual-mode imaging. We also performed global SVD (economy SVD) with full field of view to provide benchmarking for this experiment. The BCR using an rSVD with block size of 30×30 pixels is only about 1–2 dB worse than that of global SVD. Furthermore, the conventional FIR high-pass filter approach suffers from severe tissue clutter contamination due to the overlapping blood and clutter spectra, the overall BCRs using high-pass filtering are lower than that of rSVD-based clutter filtering.
Fig. 7.
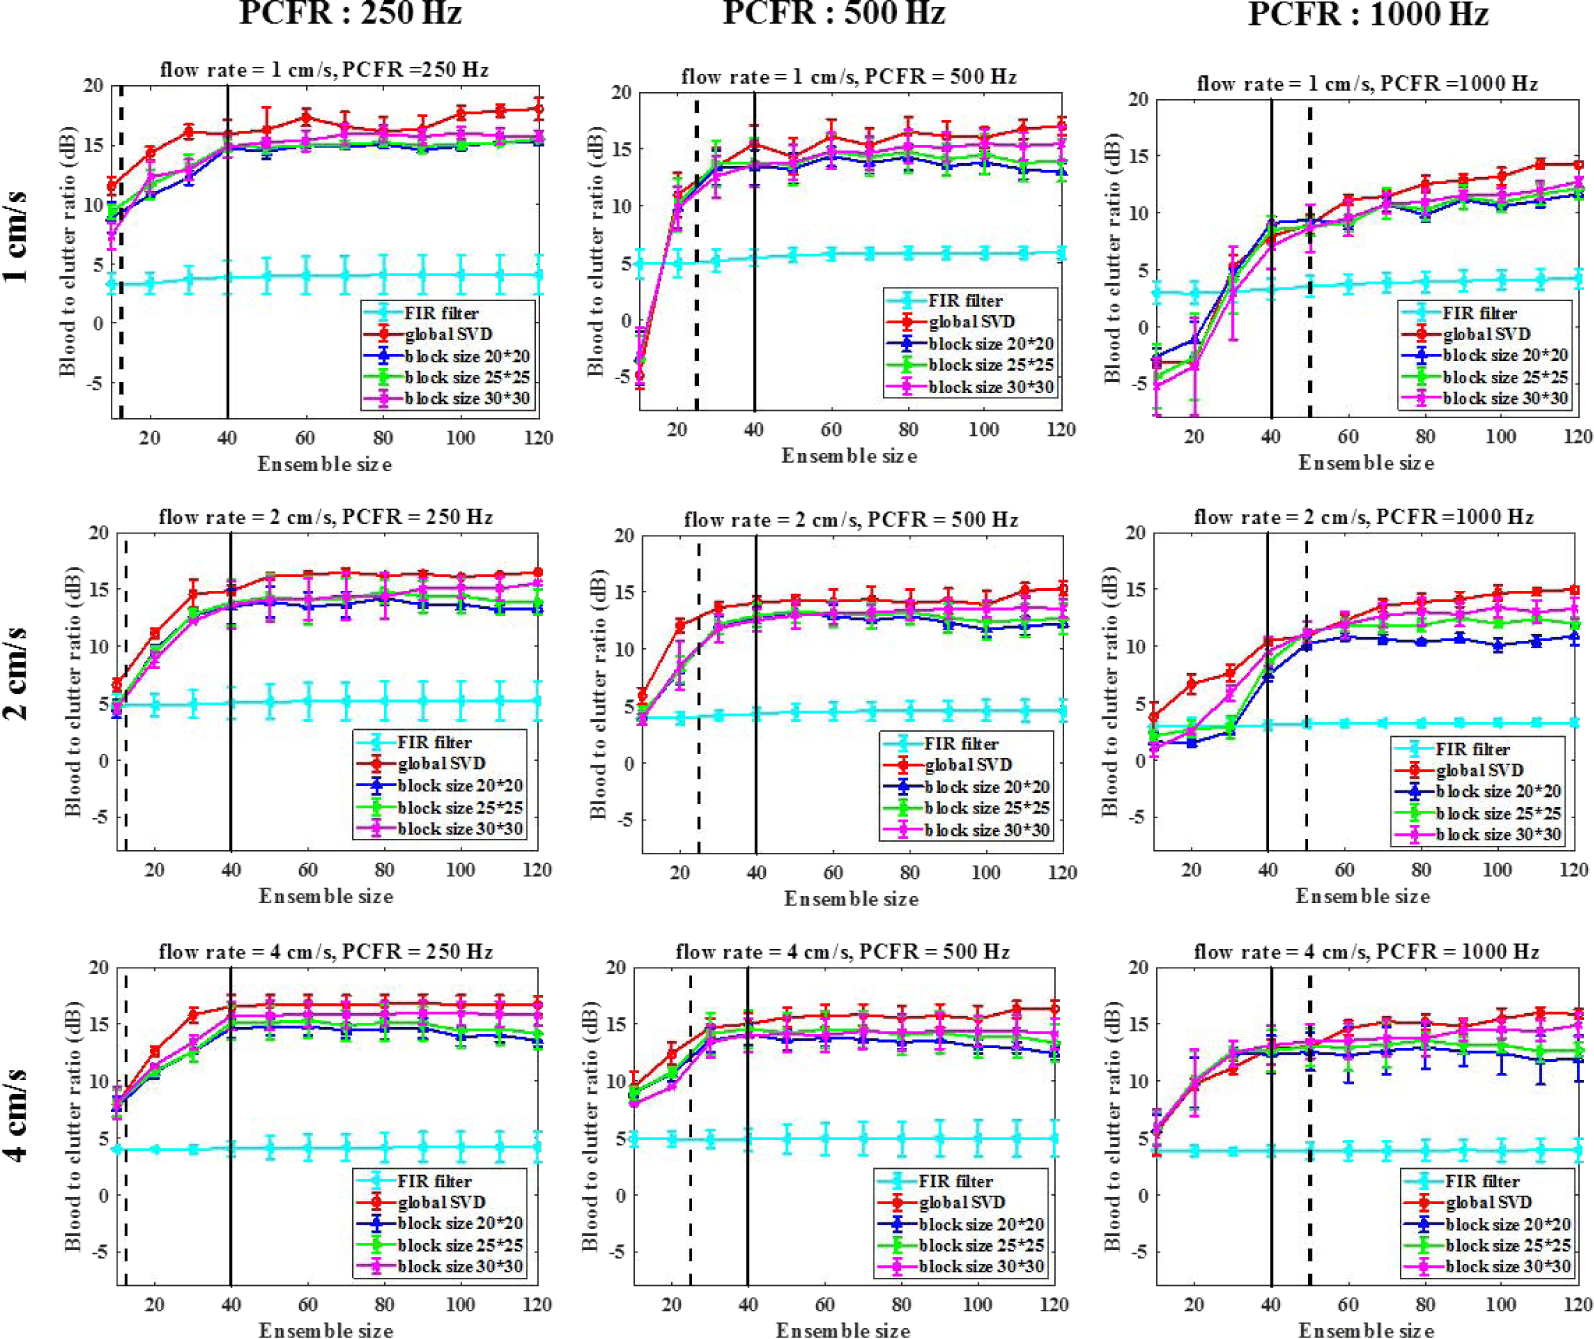
Blood-to-clutter ratio as a function of ensemble size with different post-compound IQ frame rates and flow rates. Different block sizes of 20×20, 25×25 and 30×30 pixels were investigated. The black solid lines indicate the ensemble size N = 40 and the black dashed lines indicate the ensemble size to achieve frame rate of 20 Hz for different PCFR.
To achieve frame rate of 20 Hz (for real time process), the acquisition time should be less than 50 ms. Fig. 7 shows the maximum ensemble size (black dashed line) with different PCFR to reach the required frame rate. Despite lower PCFR gives better BCR, the ensemble size should be large enough to achieve reasonable BCR. Therefore, a good compromise would use a PCFR of 1000 Hz and an ensemble size around 40–50.
B. In vivo Experiment
B-1). BCR and PSL v.s. rank of tissue clutter subspace
Figure 8 (a) – (c) show the power Doppler images of the kidney processed for different block sizes. For a reference map, a SVD with full frame was performed as shown in Fig. 8 (d). The green dashed boxes show the region of interests for micro-vessel imaging corresponding to different block sizes. Figure 8 (e) – (g) show the power Doppler images without noise reduction method [19]. For a reference map, a global SVD with full frame was performed as shown in Fig. 8 (h).
Fig. 8.
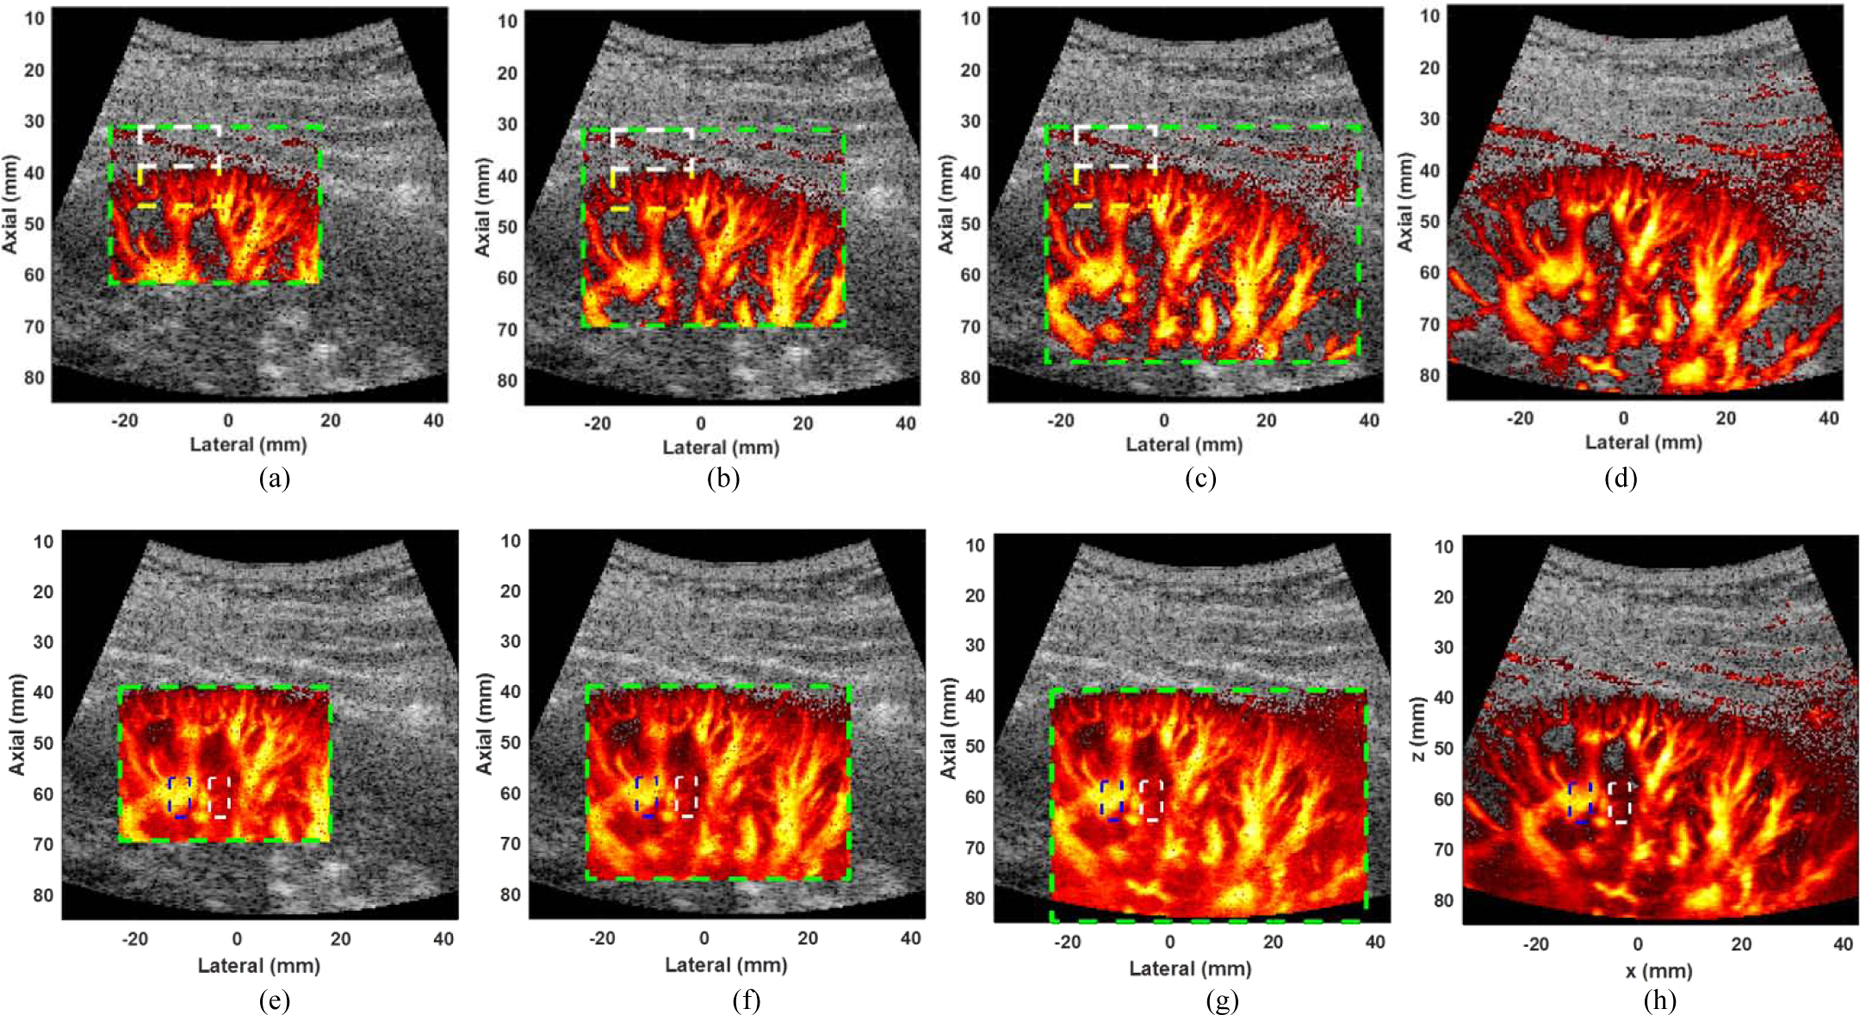
Power Doppler of kidney images with noise reduction using block size of (a) 20×20, (b) 25×25, and (c) 30×30, and (d) SVD with full frame. The green dashed box represents the ROI of the power Doppler image. The white (representing tissue) and yellow (representing blood) dashed boxes indicate the regions used to evaluate the blood-to-clutter ratio. Power Doppler of kidney images without noise reduction using block size of (e) 20×20, (f) 25×25, and (g) 30×30, and (g) SVD with full frame. The white (representing noise) and blue (representing blood) dashed boxes indicate the regions used to evaluate the signal-to-noise ratio. The dynamic range of power Doppler images was set as 0–50 dB for all images. The ensemble size, PCFR and rank of tissue clutter subspace were set as 45, 1 kHz, and 15, respectively. The dynamic ranges of B mode and power Doppler images were set as 50 dB for all images. The minimum and the maximum dynamic range values of dual-mode images were set as −50 dB and 0 dB, respectively.
Figure 9 (a) and (b) show the blood-to-clutter ratio and peak-to-side level as a function of the rank of tissue clutter subspace and the ensemble size was set as 45. The imaging peak to peak voltage was set as 50 V as well. The post-compounded IQ frame rate and the ensemble size were set as 1 kHz and 45, resulting in achieving the acquisition rate of around 22 Hz in this experiment. The BCR and PSL increased rapidly with the rank up to a rank of 8, after which the improvement rate slowed down. Therefore, the rank of tissue clutter should be set to at least 8 to achieve acceptable clutter rejection performance in this experiment. For clinical applications, the user can manually adjust the rank on-the-fly to achieve best clutter rejection during real time dual-mode imaging. When the rank of tissue clutter subspace was set at 8 or above, BCR improved slightly with larger block size. We also performed global SVD without randomized spatial downsampling or rSVD to provide benchmarking for this experiment. The global SVD could not be used for real time imaging, but provided the upper limit of BCR on the same data set for benchmarking. As shown in Fig. 9, the BCR and PSL of the real time dual-mode imaging using a rSVD with block size of 30×30 pixels is only about 2–3 dB worse than that of global SVD.
Fig. 9.
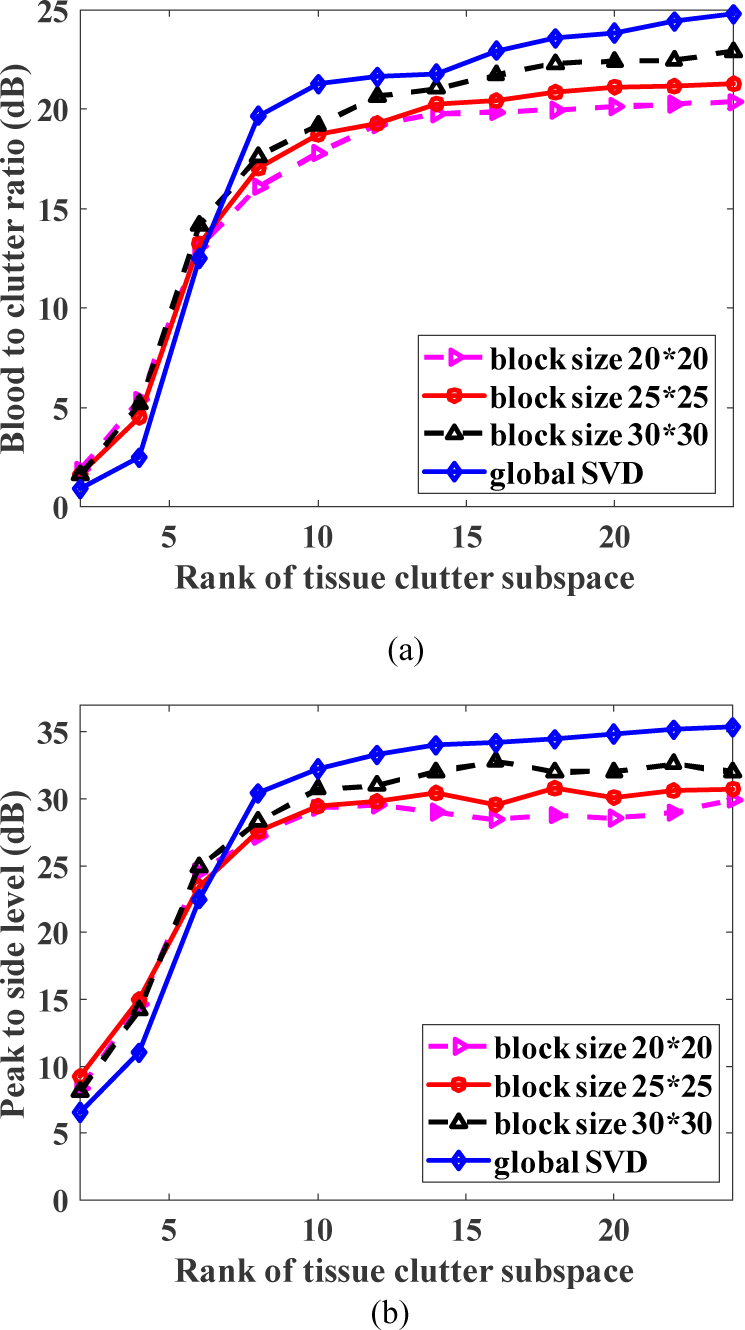
(a) Blood-to-clutter ratio and (b) peak to side level with respective to the rank of tissue clutter subspace. Global SVD refers to the SVD (economy) applied to the full frame.
B-2). Computational times
Figure 10 shows the clutter filter computational time of the proposed method as a function of the rank of tissue clutter subspace. The rank of tissue clutter subspace was set from 10 to 24 with an interval of 2. In addition, block sizes of 20×20, 25×25 and 30×30 were investigated as well. First of all, the computational time increased nearly linearly with the rank of tissue clutter. With the rank of tissue clutter subspace set at 24, the corresponding computational time of rSVD process for one micro-vessel image with block size of 20×20, 25×25 and 30×30 was about 18 ms, 23 ms, and 28 ms, respectively. It implies that at least 35 frames can be computed per second. In addition, the computation time of a global SVD (economy) computed by MATLAB function “svd” was around 491. 2 ms. It should be noted that the size of ROI is 210×190 pixels, which is nearly 3.7 times larger than that of the ROI using block size of 30×30 = 120×90.
Fig. 10.
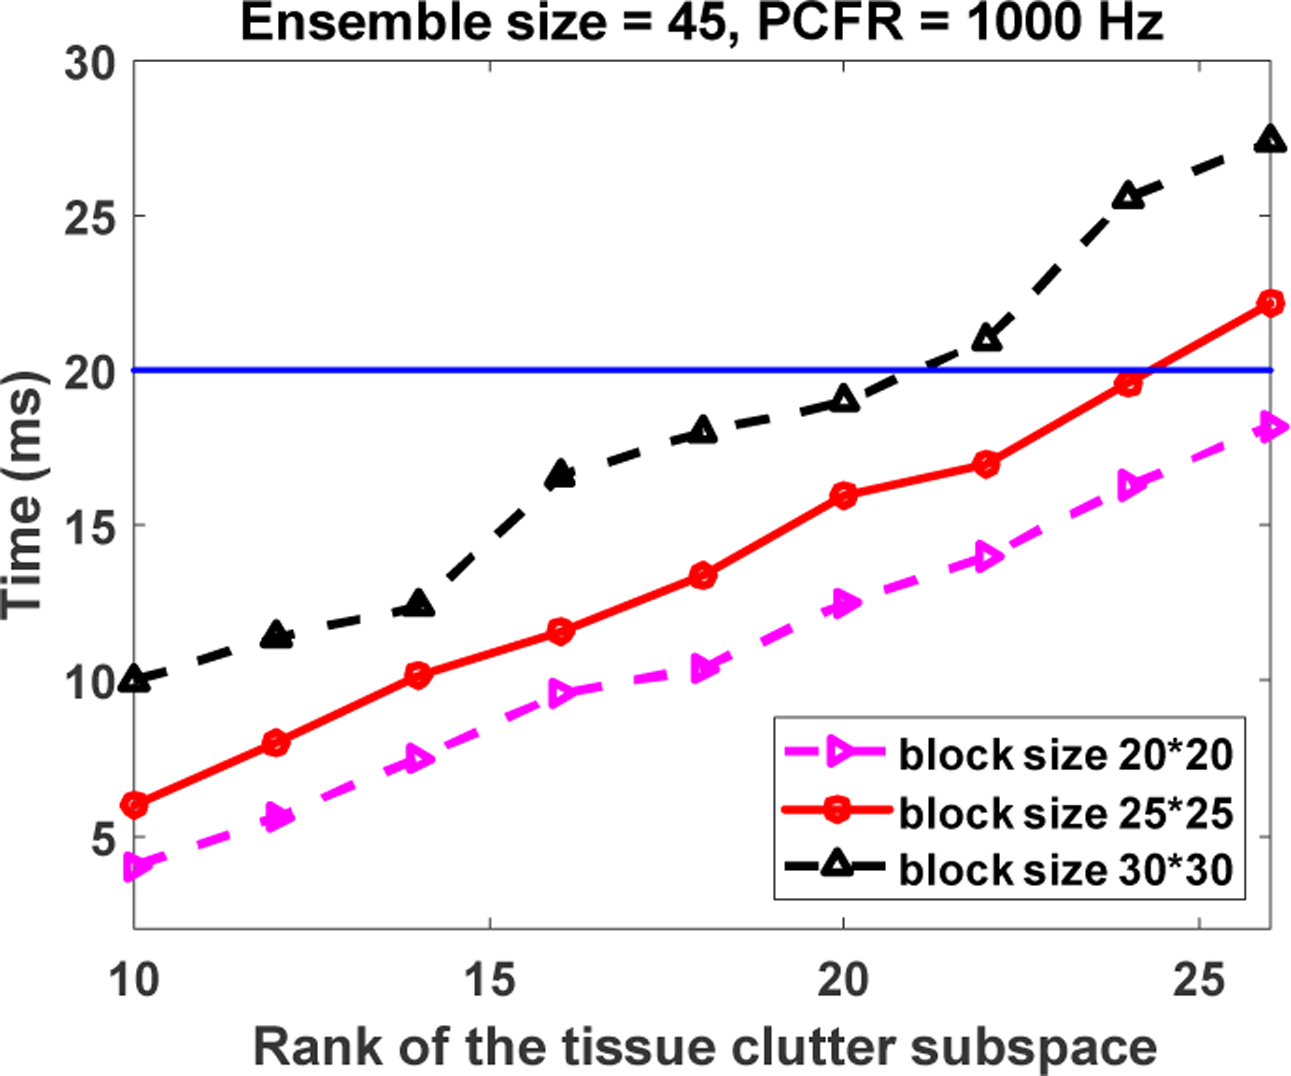
Computational time of rSVD for one micro-vessel image with respect to the rank of the tissue clutter subspace. The blue line indicates the computational time of rSVD less than 20 ms.
Fig. 11 shows the computational times with respect to ensemble sizes where the rank of tissue clutter subspace was set as 20. The computational times increased nearly linearly as the ensemble sizes increased. On the other hand, the computational times for block size of 30×30 were about 1.6 times longer than that of the block size of 20×20. The results imply that the computational times increased approximately linearly with the block size and ensemble size. Signal computational times are listed in Table II where the rank of tissue clutter subspace for SVD process was set as 20. The beamforming computational time increased as the block size increased. The computational time of beamforming is larger than that of data transfer, clutter filtering, and image processing. The last column in Table II show the processing time of different block size for a dual-mode imaging. For block sizes of 20×20 and 25×25, the processing time was less than 50 ms, corresponding to a processing rate of at least 20 Hz. For a block size of 30×30, the computational time for clutter filtering was only 19.8 ms. However, the beamforming process required 32.1 ms, and the total computational time for this setting was 54.5 ms. Therefore, the processing rate was about 18 Hz for a block size of 30×30.
Fig. 11.
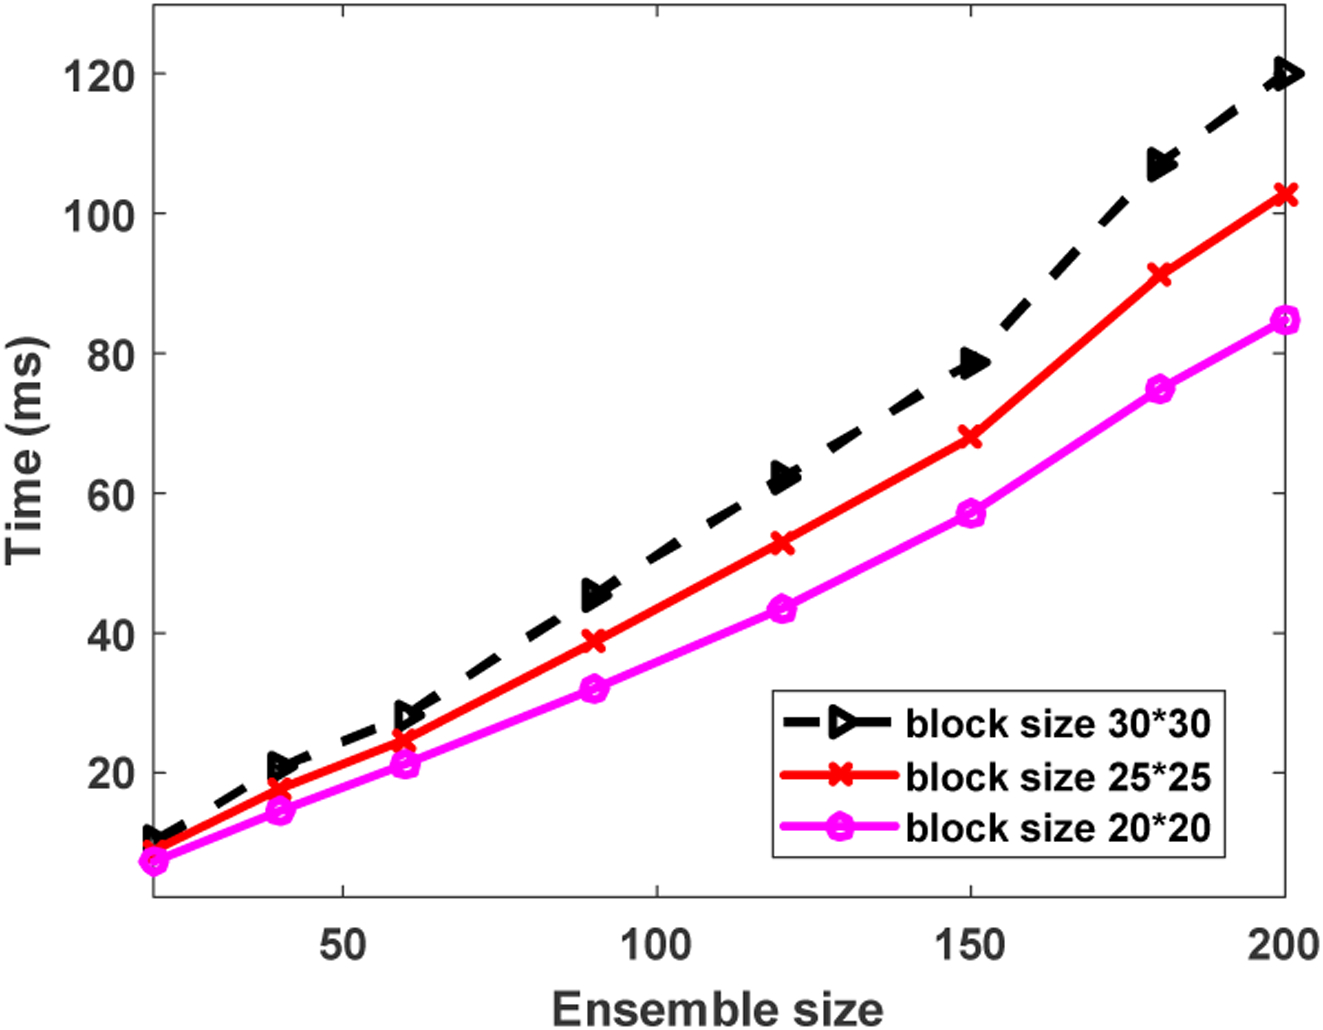
Computational time of rSVD with respect to the ensemble size.
Table II.
Computational times (rank = 20) with respect to different block sizes. The PCFR and Ensemble size were set as 1 kHz and 45,respectively. The global SVD process took around 491.2 ms for the full frame.
| Beamforming (ms) | Clutter filtering (ms) | Image processing (ms) | Total (ms) | |
|---|---|---|---|---|
| a. 20 × 20 | 15.2 | 12.3 | 2.1 | 29.6 |
| b. 25 × 25 | 23.5 | 16.6 | 2.3 | 42.4 |
| c. 30 × 30 | 32.1 | 19.8 | 2.6 | 54.5 |
B-3). Determine the initial rank of tissue clutter subspace
Fig. 12 (a) shows the correlation matrix of spatial vectors, where the black dashed box represents the tissue clutter signal and the red dashed box represents the blood and motion signal. The rank of tissue clutter subspace was 9 using the spatial correlation method. Fig. 12 (b) shows the curve of singular value, the rank of tissue clutter subspace was 10 using the gradient method. The final rank of tissue clutter subspace was set as the smallest value between two methods, which is 9 in this case as the initial rank of tissue clutter subspace.
Fig. 12.
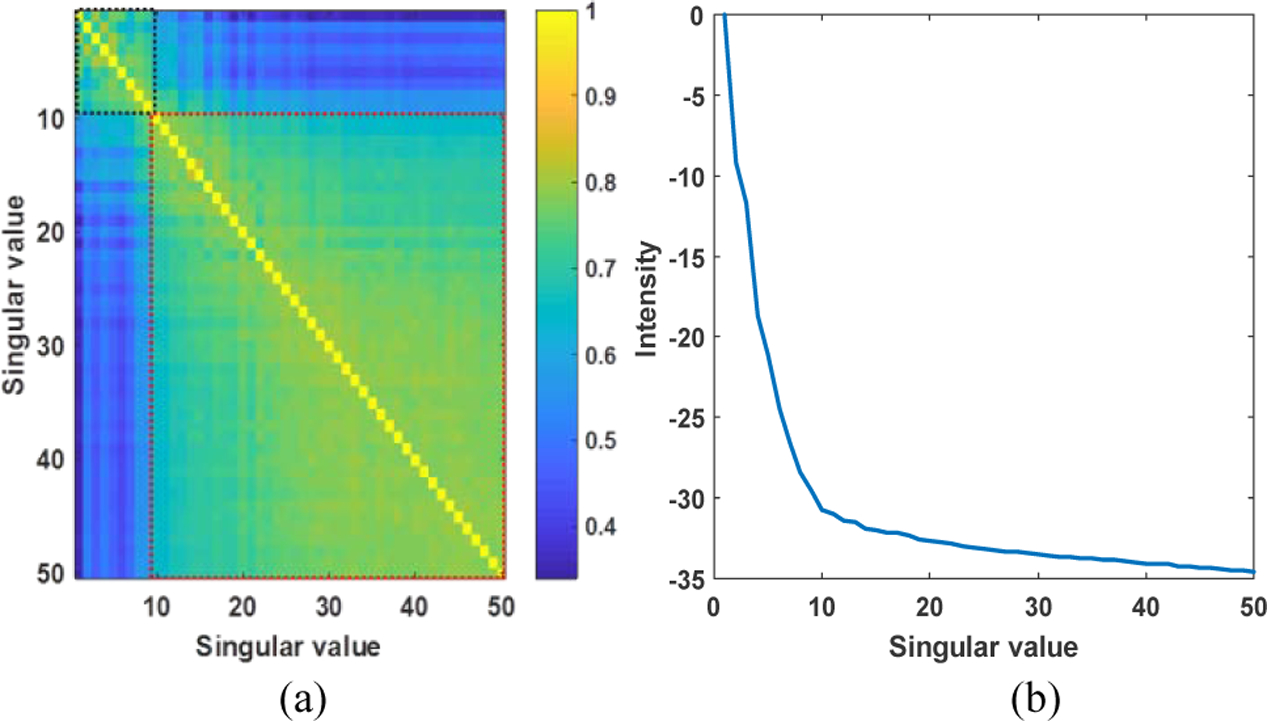
(a) Correlation matrix of singular vectors and (b) curve of the singular values.
B-4). SNR with and without noise reduction
Table III presents the SNRs using rSVD with different block size and SVD with full frame on the power Doppler images as shown in Fig. 8 (e)–(h). The results show that an incremental gain of about 11 dB in terms of SNR using the noise reduction method. Furthermore, higher SNR can be achieved as the block size increased. In addition, SNR using SVD is around 2–3 dB better than that of rSVD with block size of 30×30 pixels.
Table III.
SNR with and without the noise reduction method.
| SNR (without reduction) | noise SNR (with noise reduction) | |
|---|---|---|
| a. 20 × 20 | 10.16 dB | 21.17 dB |
| b. 25 × 25 | 10.45 dB | 21.52 dB |
| c. 30 × 30 | 11.19 dB | 22.64 dB |
| d. SVD (full frame) | 12.63 dB | 25.11 dB |
IV. Discussion
In this study, we implemented a dual-mode (B-mode and micro-vessel imaging mode) real time imaging architecture on the Verasonics system, which reached a frame rate above 20 Hz. Acquisition and processing parameters can be optimized to suit different clinical applications. To better visualize small vessels with slow flows, larger ensemble size and longer post-compounded IQ frame time are desired. However, these acquisition parameters will lead to longer acquisition time and thus lower frame rate for the dual-mode imaging. For an ensemble size of 50 and post-compounded IQ frame rate of 500 Hz, the acquisition time for one dual-mode frame is about 0.1 second, which limits the dual-mode frame rate to nearly 10 Hz. In this case, the acquisition time is much larger than processing time. Thus the strategy is to use larger block size to achieve better clutter filtering performance. On the other hand, if the target dual-mode frame rate and the post-compounded IQ frame time are set at 22 Hz and 1 ms, then ensemble size of 45 (acquisition time = 46 ms : [(N+1) ×PCFT]) can be used to achieve real time micro-vessel imaging. And a block size of 25×25 can be selected such that the overall processing time is smaller than the acquisition time to meet the required frame rate of 22 Hz. Real time dual-mode imaging with a frame rate of 22 Hz is shown in the supplementary videos. In this demonstration, the imaging one sided voltage, the rank of tissue clutter subspace, block size and of PCFR were set as 25V, 14, 20×20 and 1 kHz, respectively.
Micro-vessel imaging uses multiple post-compounded IQ frames to form one power Doppler image. As shown in Fig. 3 (b), the proposed architecture uses non-overlapping ensembles for micro-vessel imaging. Therefore, the ensemble size is one of the factors determines the total acquisition time for one micro-vessel image, which can pose a fundamental limit on the frame rate of micro-vessel imaging. For both phantom and in vivo study, post-compounding frame times (PCFT) were set as 1 ms. To achieve a micro-vessel imaging frame rate higher than 20 Hz, the acquisition rate (eq. 8) and processing rate (eq. 9) should be higher than 20 Hz, which limits an ensemble size to be lower than 50. To address this problem, future architecture can use a “sliding window” approach: for example, ensemble 1 uses IQ frames 1–50, ensemble 2 uses IQ frames 10–60, ensemble 3 uses IQ frame 20–70, etc. The sliding window approach should allow a faster acquisition rate for micro-vessel imaging.
In this study, one of the bottlenecks for the real time imaging is the computation time of software-based beamforming (reconstruction) process. Therefore, to reduce the reconstruction time without comprising the SNR, each transmission angle was fired twice (instead of firing more divergence wave angles) since the accumulation time is much faster than the beamforming time. To improve the computation speed, Graphical processing unit (GPU) with parallel computation architecture [25–27] can be applied to enhance the computational speeds of beamforming to allow compounding with more divergence wave angle. However, the penalty of applying GPU is the requirement of extra data transferring time between CPU and GPU memory.
For the current multi-core CPU architecture, for matrix multiplications in eq. (3)) and (4), the computation time of matrix multiplications depends on row (nz×nx) and column (nt) of a downsampled sub-matrix as well as the rank of tissue clutter subspace (nt). In addition, the computation time for Householder transform used in QR decomposition depends on the row (nz× nx) and column (nk) of a random projected matrix. Thus, the computation time increased as the block size, ensemble size or the rank of tissue clutter subspace increased. From the results in Fig. 10 and 11, the computation time of rSVD increased nearly linearly with all the aforementioned factors.
The selection of rank for tissue clutter is a practical issue for SVD-based clutter filtering. One solution is to allow user to manually adjust the rank on-the-flight during real time micro-vessel imaging to achieve optimal Doppler image quality. Another solution is to use automatic rank selection methods typically require the computation of full SVD process, and thus may not be suitable for real time micro-vessel imaging. It may be possible to insert a SVD every one or two seconds within the real time rSVD/rSD imaging architecture, and use the rank automatically selected by the SVD to guide rank selection for the rSVD/rSD processing.
V. Conclusions
This study presented an acquisition and processing architecture for real time micro-vessel imaging based on randomized SVD, randomized spatial downsampling, and noise suppression. The proposed multicore architecture was implemented on a Verasonics Vantage platform, which achieves a micro-vessel imaging frame rate greater than 20 Hz. Selection of acquisition and processing parameters was also evaluated. In vivo kidney micro-vessel imaging was successfully performed, demonstrating that small vessels in the renal cortex can be visualized with the proposed method in real time.
Supplementary Material
Real time tissue clutter suppression is essential for microvessel imaging
Randomized SVD can robustly reject tissue clutter with low computation complexity
Perform real time rSVD using multi-core CPUs in a research ultrasound system
Computation time of rSVD is less than 20 ms with acceptable clutter suppression
Acknowledgement:
This project was support in part by NIH (National Institutes of Health) grants R01DK120559 and K99CA214523. The content is solely the responsibility of the authors and does not necessarily represent the official views of the NIH.
Footnotes
Publisher's Disclaimer: This is a PDF file of an unedited manuscript that has been accepted for publication. As a service to our customers we are providing this early version of the manuscript. The manuscript will undergo copyediting, typesetting, and review of the resulting proof before it is published in its final form. Please note that during the production process errors may be discovered which could affect the content, and all legal disclaimers that apply to the journal pertain.
There is no conflict of interest for this work
References
- [1].Montaldo G, Tanter M, Bercoff J, Benech N, and Fink a. M., “Coherent plane-wave compounding for very high frame rate ultrasonography and transient elastography,” IEEE Trans. Ultrason. Ferroelectr. Freq. Control, vol. 56, pp. 489–506, 2009. [DOI] [PubMed] [Google Scholar]
- [2].Bercoff J et al. , “Ultrafast compound Doppler imaging: Providing full blood flow characterization,” IEEE Trans. Ultrason., Ferroelectr., Freq. Control, vol. 58, pp. 134–147, 2011. [DOI] [PubMed] [Google Scholar]
- [3].Mace E, Montaldo G, Osmanski BF, Cohen I, Fink M, and Tanter M, “Functional ultrasound imaging of the brain: theory and basic principles,” (in eng), IEEE transactions on ultrasonics, ferroelectrics, and frequency control, vol. 60, no. 3, pp. 492–506, March 2013, doi: 10.1109/tuffc.2013.2592. [DOI] [PubMed] [Google Scholar]
- [4].Yu AC and Cobbold RS, “Single-ensemble-based eigen-processing methods for color flow imaging--Part II. The matrix pencil estimator,” (in eng), IEEE transactions on ultrasonics, ferroelectrics, and frequency control, vol. 55, no. 3, pp. 573–87, March 2008, doi: 10.1109/tuffc.2008.683. [DOI] [PubMed] [Google Scholar]
- [5].Yu A and Lovstakken L, “Eigen-based clutter filter design for ultrasound color flow imaging: a review,” (in eng), IEEE transactions on ultrasonics, ferroelectrics, and frequency control, vol. 57, no. 5, pp. 1096–111, May 2010, doi: 10.1109/tuffc.2010.1521. [DOI] [PubMed] [Google Scholar]
- [6].Mauldin FW Jr., Lin D, and Hossack JA, “The singular value filter: a general filter design strategy for PCA-based signal separation in medical ultrasound imaging,” (in eng), IEEE Trans Med Imaging, vol. 30, no. 11, pp. 1951–64, November 2011, doi: 10.1109/tmi.2011.2160075. [DOI] [PMC free article] [PubMed] [Google Scholar]
- [7].Demene C et al. , “Spatiotemporal clutter filtering of ultrafast ultrasound data highly increases Doppler and fUltrasound sensitivity,” (in eng), IEEE Trans Med Imaging, vol. 34, no. 11, pp. 2271–85, November 2015, doi: 10.1109/tmi.2015.2428634. [DOI] [PubMed] [Google Scholar]
- [8].Chee AJ, Yiu BY, and Yu AC, “A GPU-Parallelized Eigen-Based Clutter Filter Framework for Ultrasound Color Flow Imaging,” (in eng), IEEE transactions on ultrasonics, ferroelectrics, and frequency control, vol. 64, no. 1, pp. 150–163, January 2017, doi: 10.1109/tuffc.2016.2606598. [DOI] [PubMed] [Google Scholar]
- [9].Baranger J, Arnal B, Perren F, Baud O, Tanter M, and Demene C, “Adaptive Spatiotemporal SVD Clutter Filtering for Ultrafast Doppler Imaging Using Similarity of Spatial Singular Vectors,” (in eng), IEEE Trans Med Imaging, vol. 37, no. 7, pp. 1574–1586, July 2018, doi: 10.1109/tmi.2018.2789499. [DOI] [PubMed] [Google Scholar]
- [10].Song P, Manduca A, Trzasko JD, and Chen S, “Ultrasound Small Vessel Imaging With Block-Wise Adaptive Local Clutter Filtering,” (in eng), IEEE Trans Med Imaging, vol. 36, no. 1, pp. 251–262, January 2017, doi: 10.1109/tmi.2016.2605819. [DOI] [PubMed] [Google Scholar]
- [11].Otazo R, Candes E, and Sodickson DK, “Low-rank plus sparse matrix decomposition for accelerated dynamic MRI with separation of background and dynamic components,” (in eng), Magn Reson Med, vol. 73, no. 3, pp. 1125–36, March 2015, doi: 10.1002/mrm.25240. [DOI] [PMC free article] [PubMed] [Google Scholar]
- [12].Solomon O et al. , “Deep Unfolded Robust PCA with Application to Clutter Suppression in Ultrasound,” (in eng), IEEE Trans Med Imaging, September 13 2019, doi: 10.1109/tmi.2019.2941271. [DOI] [PubMed] [Google Scholar]
- [13].Gates M, Tomov S, and Dongarra a. J., “Accelerating the SVD Two Stage Bidiagonal Reduction and Divide and Conquer Using GPUs,” Parallel Computing, vol. 74, pp. 3–18, May 2018. [Google Scholar]
- [14].Lahabar S and Narayanan PJ, “Singular Value Decomposition on GPU using CUDA,” Proc. IEEE Int’l Symp. Parallel & Distributed Processing, pp. 1–10, May, 2009. [Google Scholar]
- [15].Golub GH and Loan CFV, “Matrix Computations,” Baltimore, MD, USA: The Johns Hopkins Univ, Press, 1996. [Google Scholar]
- [16].Halko N, Martinsson PG, and Tropp JA, “Finding structure with randomness: Probabilistic algorithms for constructing approximate matrix decompositions,” SIAM Rev., vol. 53, pp. 217–288, 2011. [Google Scholar]
- [17].Song P et al. , “Accelerated singular value-based ultrasound blood flow clutter filtering with randomized singular value decomposition and randomized spatial downsampling,” (in eng), IEEE Trans Ultrason Ferroelectr Freq Control, vol. 64, no. 4, pp. 706–716, April 2017, doi: 10.1109/tuffc.2017.2665342. [DOI] [PubMed] [Google Scholar]
- [18].Xu Canxing, Choi Joon Hwan, Comess K, and Kim Y, “Color Doppler and Spectral Doppler with High Frame-rate Imaging,” IEEE International Ultrasonics Symposium, October 2010. [Google Scholar]
- [19].Song P, Manduca A, Trzasko JD, and Chen S, “Noise Equalization for Ultrafast Plane Wave Microvessel Imaging,” (in eng), IEEE Trans Ultrason Ferroelectr Freq Control, vol. 64, no. 11, pp. 1776–1781, November 2017, doi: 10.1109/tuffc.2017.2748387. [DOI] [PMC free article] [PubMed] [Google Scholar]
- [20].Huang C, Song P, Gong P, Trzasko JD, Manduca A, and Chen S, “Debiasing-based Noise Suppression for Ultrafast Ultrasound Microvessel Imaging,” IEEE Trans. Ultrason. Ferroelectr. Freq. Control, May 2019. (early access). [DOI] [PMC free article] [PubMed] [Google Scholar]
- [21].Daigle RE, “Ultrasound imaging system with pixel oriented processing,” US20090112095A1, 2009. [Google Scholar]
- [22].Guney ME ME, Goto K, Costa TB, Knepper S, Huot L., and Mitrano A, “ Optimizing matrix multiplication on Intel Xeon Phi x200 architecture,” IEEE 24th Symposium on Computer Arithmetic, pp. 144–145, July 2017 [Google Scholar]
- [23].Buttari A, Langou J, Kurzak J, and Dongarra a. J. J., “Parallel tiled QR factorization for multicore architectures,” Concurrency Computat.: Pract. Exper, vol. 20, pp. 1573–1590, July 2007. [Google Scholar]
- [24].Goto K and Geijn R. v. d., “High-performance implementation of the level-3 BLAS,” ACM Trans. Math. Softw, vol. 4, pp. 4–14, July 2008. [Google Scholar]
- [25].Lok UW and Li PC, “Transform-Based Channel-Data Compression to Improve the Performance of a Real-Time GPU-Based Software Beamformer,” (in eng), IEEE transactions on ultrasonics, ferroelectrics, and frequency control, vol. 63, no. 3, pp. 369–80, March 2016, doi: 10.1109/tuffc.2016.2519441. [DOI] [PubMed] [Google Scholar]
- [26].Yiu BY, Tsang IK, and Yu AC, “GPU-based beamformer: fast realization of plane wave compounding and synthetic aperture imaging,” (in eng), IEEE transactions on ultrasonics, ferroelectrics, and frequency control, vol. 58, no. 8, pp. 1698–705, August 2011, doi: 10.1109/tuffc.2011.1999. [DOI] [PubMed] [Google Scholar]
- [27].Asen JP, Buskenes JI, Colombo Nilsen CI, Austeng A, and Holm S, “Implementing capon beamforming on a GPU for real-time cardiac ultrasound imaging,” (in eng), IEEE transactions on ultrasonics, ferroelectrics, and frequency control, vol. 61, no. 1, pp. 76–85, January 2014, doi: 10.1109/tuffc.2014.6689777. [DOI] [PubMed] [Google Scholar]
Associated Data
This section collects any data citations, data availability statements, or supplementary materials included in this article.


