Abstract
The pandemic of coronavirus disease 2019 (COVID-19) has threatened the social and economic structure all around the world. Generally, COVID-19 has three possible transmission routes, including pre-symptomatic, symptomatic and asymptomatic transmission, among which the last one has brought a severe challenge for the containment of the disease. One core scientific question is to understand the influence of asymptomatic individuals and of the strength of control measures on the evolution of the disease, particularly on a second outbreak of the disease. To explore these issues, we proposed a novel compartmental model that takes the infection of asymptomatic individuals into account. We get the relationship between asymptomatic individuals and critical strength of control measures theoretically. Furthermore, we verify the reliability of our model and the accuracy of the theoretical analysis by using the real confirmed cases of COVID-19 contamination. Our results, showing the importance of the asymptomatic population on the control measures, would provide useful theoretical reference to the policymakers and fuel future studies of COVID-19.
Keywords: COVID-19, Asymptomatic individuals, SIR-typed model, Control measures, Second outbreak
Introduction
By May 23, 2020, there are 5,103,006 confirmed cases of coronavirus disease 2019 (COVID-19) in the world, and 3,33,401 people have died of the disease [1]. To contain the outbreak of COVID-19, policies, including quarantining cities, limiting public activities, extending holidays, are implemented. These control measures have to be implemented strictly in order to reduce the spreading of COVID-19 [2, 3], which already caused significant disruption to the social and economic structure [4–6]. Therefore, in the study of epidemiological models [7, 8], on the one hand, it is needed to predict the evolution of COVID-19; on the other hand, it should be helpful to access how long these control measures should last and to what extent these control measures should keep. Different models may alter the predictions of the epidemic and help plan the control measures.
According to the reported data, recent researches estimate the epidemiological parameters and predict the trends of COVID-19. Maleki et al. [9] used the autoregressive time series model to forecast the confirmed and recovered COVID-19 cases. Guan et al. [10] analyzes the clinical characteristics of laboratory-confirmed COVID-19 patients from China to give an estimation of epidemiological parameters, including the basic reproductive number, which is usually used to determine if an infectious disease can outbreak [11], incubation time, etc. Shao et al. [12] proposed a series of time delay dynamical systems, and they estimated the reproductive number of COVID-19 based on Wallinga and Lipsitch framework [13]. Shi et al. [14] used the SEIR model, considering the small transmission rate of the incubation period to fit the data and predict the peak number. Yang et al. [15] used the modified SEIR model, considering the strict measures and analyzing the risk of the second outbreak of the disease.
Such SIR-typed models are based on the understanding of the potential transmission routes of the epidemic. The transmission of COVID-19 has three possible routes [16]. The first one is the symptomatic transmission, which refers to the transmission from a person while they are experiencing symptoms. The second one is the pre-symptomatic transmission. It refers to the transmission from a pre-symptomatic case that can occur before symptom onsets. The third one is the asymptomatic transmission, which refers to the transmission of the virus from a person who does not develop symptoms. The identification of pre-symptomatic and asymptomatic individuals is mainly through contact tracing efforts and enhanced investigation of clusters of confirmed cases [17]. It leaves asymptomatic individuals infectious for an extended period, which would change the macroscopic spreading picture of the epidemic.
To tackle this issue, in this paper, we consider a novel compartmental model called SALIR epidemiological model which analyzes the influence of asymptomatic individuals and of the strength of control measures. In detail, when a healthy individual is infected, we assume that he or she would be transformed into an asymptomatic state with probability , otherwise into a pre-symptomatic state with probability . Also, we introduce a parameter m in our model to represent the strength of control measures. From the clinical characteristic of the COVID-19, some parameters in our model are given, and we consider the impact of on the evolution of the epidemic. Furthermore, when the epidemic tends to decline, we analyze the critical strength of control measures which takes the asymptomatic individuals into account to prevent a second outbreak of the COVID-19-related epidemic.
SALIR model formulation
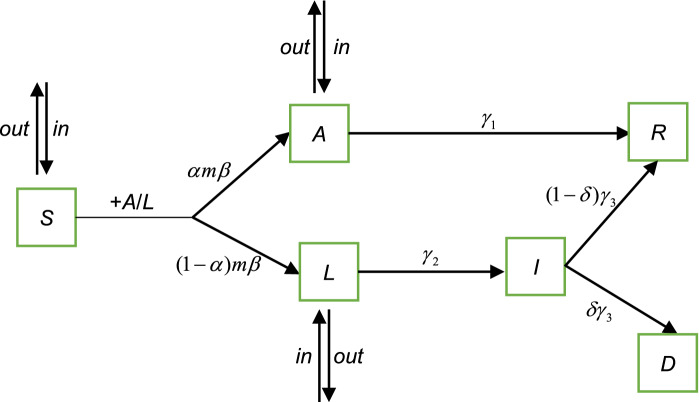
We use a novel compartmental model called SALIR model, including the migration of population to analyze the spreading of COVID-19 on the city and country scale. Conceptually, the SALIR model is shown as in Fig. 1.
Fig. 1.
The sketch of the SALIR model. Individuals are divided into five states in the SALIR model at each time step: S, A, L, I and R. S represents the susceptible state, A represents the asymptomatic state, L represents the latent state before symptoms appear or symptomatic state before quarantine or hospitalization, I indicates the infected state, but the individuals in the state have been quarantined or hospitalized, and R is the recovered state. D represents that individuals die of COVID-19. The transition between different states is explained in the main text: (E1)–(E7)
At any time step, an individual is in one of the five states: S, A, L, I and R. D represents that an individual dies of COVID-19. We explain these states of Fig. 1 as the following:
(E1) Individual in the S state is susceptible and can be converted to either A state with probability or L state with probability when contacts with an individual in the A or L state if no control measure is implemented. is the spreading probability of the disease, and is the probability for the susceptible individual to be in the A state after infection. The number of individuals in the S state at time t is S(t).
(E2) Individual in the A state has no symptom of the disease and corresponds to the asymptomatic individual in the epidemiological research. The individual can infect the susceptible individuals with probability and would recover with probability directly. is the duration time of infection for the individuals in the A state. A case study [17] shows that the duration time of infection of an asymptomatic individual is about 19 (unit: day) or longer, and thus, we assume that the infectious time is 21 (unit: day). The number of individuals in the A state at time t is denoted by A(t).
(E3) Individual in the L state is the infected individual before symptoms appear or symptomatic individual before quarantine or hospitalization. The individual in the L state can infect the susceptible individuals with probability and would transform into I state with probability , where is the incubation time and equals to 7 (unit: day) on average according to the research [15], and is the time from symptoms onset to quarantine or hospitalization and equals to 3 (unit: day) on average [18]. So, we assume that an individual in the L state would transform into I state with probability . The number of individuals in the L state at time t is denoted by L(t).
(E4) Individual in the I state has symptoms but has been quarantined or hospitalized so that he or she cannot infect the other susceptible individuals. The individual in the I state would transform into R state with probability , where is the death rate and we assume that the value is 0.03 [19], represents the average interval time between the hospitalization and the recovery or death of individuals. According to the clinical characteristic of COVID-19 [10], the time interval between the symptoms onset and recovery or death is 18 days, so we assume that (unit: day) and . The number of individuals in the I state is I(t). In addition, the cumulative number of individuals in the I state by time t is denoted by , which corresponds to the number of confirmed cases in real data.
(E5) Individual in the R state represents that the individual has recovered. The number of individuals in the R state at time t is R(t).
Such a compartmental model, to some extent, can be called as a susceptible (S)-asymptomatic (A)-latent (L)-infected (I)-recovered (R) model. However, the latent individual experiences an incubation time and a waiting time of quarantine or hospitalization, and the infected individual has no significant ability to affect healthy individuals because he or she has been quarantined or hospitalized.
Besides the transition rule of the epidemic states, we consider the mobility of individuals as well as the strength of control measures (i.e., public health interventions).
(E6) At any time step, individuals in the S, A and L states can move in or out the community, which are represented by , and , respectively.
(E7) In the situation of disease-free spreading, an individual would leave the S state with probability when contacts with an individual in the A or L state. However, under the implementation of some control measures (e.g., home quarantine, limiting the traffic), the probability would reduce to , where is the strength of control measures. The stronger the strength is, the smaller the value of m(t) is.
According to the above descriptions, the discrete equations are as follows:
| 1 |
where N(t) represents the total number of individuals in contact with each other in the community at time t, and thus, , is the probability that a susceptible individual contacts with an individual in the A or L state at time t.
In our model, parameters represent the spontaneous transition of states and thus can be estimated by the clinical data of individuals. Parameter represents the spreading ability of the disease and is usually estimated by its evolution process. Thus, we only need to estimate the value of and m(t) under different based on the reported cases.
Critical strength of control measures
This section will explore the critical strength of control measures to contain the epidemic spreading. We assume that each population size of the community is stable at any time t, that is, the outflow of population is equal to the inflow in the S, A and L state (i.e., , and ). The condition that the system in Eq. (1) is stable satisfies or , or
| 2 |
When the value of A(t) and L(t) is extremely small at the initial moment, thus . Based on Eq. (2), we can get the critical strength of control measures that prevents the spreading of the epidemic as follows
| 3 |
It is worth noting that the probability for the susceptible individual to be in the A state after infection and the parameters of epidemic spreading (i.e., , and ) all affect the value of in Eq. (3). When , conforms to the result of the classical SIR model.
In the following, we will verify the reliability of the SALIR model and the accuracy of the critical strength analysis by using the real confirmed data of COVID-19.
Numerical results and discussion
From December 2019, a series of pneumonia cases (i.e., COVID-19) in the city of Wuhan, in China, has attracted the attention of Chinese health authorities [8]. With the coming of the Spring Festival, a large amount of migrants left Wuhan to return home city or town. To contain the spreading of COVID-19, China adopts control measures on January 23, 2020 [3, 15].
To explore the spreading ability of COVID-19 and the strength of control measures needed to contain its spreading, we collect the confirmed data of Wuhan and China [20] and derive the epidemic curve by using the SALIR model. By analyzing the early transmission dynamics in the city of Wuhan [21], we add a gap period of incubation time before the time of illness onset to simulate the infection of the first patient.
For simplicity, we represent the parts that describe the mobility of individuals in Eq. (1) as: , and , where l is the proportion of people the S, A or L compartment net flowing out. According to the statistics [22] during Spring Festival in Wuhan, we set before the day of January 23, 2020, on which day the city was locked down, and later. In addition, the strength of control measures at time t is denoted by . The stronger the strength is, the smaller the value of m(t) is. m(t) reads as follows
| 4 |
where represents the day of January 22, 2020, which is the day before the control measures were implemented in Wuhan. Under the strict control, the spreading of the disease gradually declined. T is assumed the day that the strength of the control measures is reduced to rescue the economy of the city. We set T as the day of April 8, 2020, in the parameters estimation of Wuhan and the day of March 11, 2020, in the parameters estimation of China except for Hubei province.
In the initial stage of COVID-19 spreading, there are likely many undetected cases. With the adoption of clinical detection on February 12, 2020, the number of confirmed cases increases substantially, which can basically reflect the real situation. Thus, we use the least square method to compare the cumulative number of individuals in the I state with the real confirmed data from February 12, 2020, to April 7, 2020, to estimate the parameters of the SALIR model.
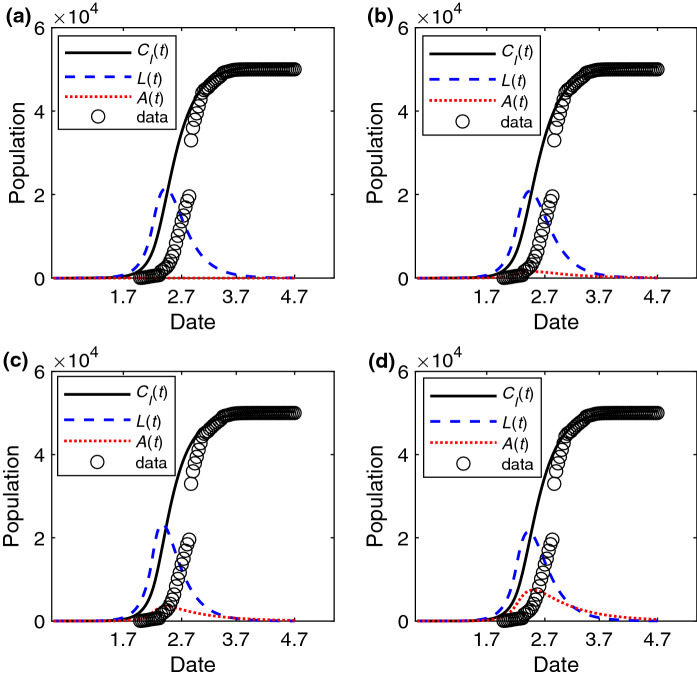
Considering the presence of asymptomatic individuals, we estimate the spreading probability and and explore the robust of the model with different . In Fig. 2a–d, we find that the numerical results of the SALIR model are in good agreement with the real data from February 12, 2020, to April 7, 2020. Moreover, the estimated value of spreading probability is near 0.3 when is small. Based on the estimated spreading probability, the basic reproduction number which is the average number of cases generated by a single infection person [23] is 3.05/3.18/3.41/3.66 when computed from the expression . In addition, we find that there is a difference of A(t) in Fig. 2a–d. Next, we will further study the effect of asymptomatic individuals.
Fig. 2.
The change of epidemic features with time for different . The fitting epidemic curve , the number of individuals in the L state L(t) and in the A state A(t) versus time (unit: day) with the estimated parameters a , when , b , when , c , when , d , when . The data is the cumulative number of confirmed cases of Wuhan. The values of other parameters are set to: , , , , before January 23, 2020, and later
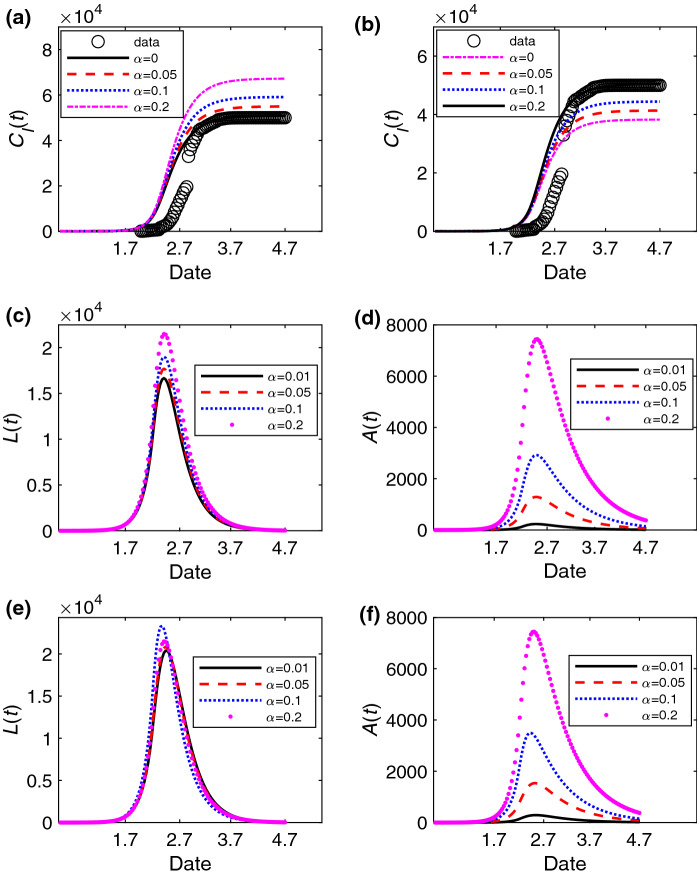
We explore how the asymptomatic individuals affect cumulative number of individuals in the I state, the number L(t) of individuals in the L state and the number A(t) of individuals in the A state in Fig. 3a–d. As the individuals in the A state have a longer infection period, becomes larger with the increasing of in Fig. 3a, b. Moreover, the peaks of L(t) and A(t) are higher when is larger in Fig. 3c, d. In addition, we further explore the changes of L(t) and A(t) with the estimated parameters and of different in Fig. 3e, f. The results show that the final numbers of individuals in the L state with different are all close to 0 in Fig. 3e. However, there is still a relatively larger number of asymptomatic individuals near April 7 when is large in Fig. 3f. Thus, the city still needs to keep a certain strength of control measures after lifting the lockdown of the city to avoid the outbreak of COVID-19 again.
Fig. 3.
The change of the number of infected individuals in different states versus time (unit: day) with different . The change of the cumulative number of individuals in the I state for different with the estimated parameters a , , b , . The change of the number of individuals in the L state and A state with different at , in (c) and (d), and with the estimated parameters , when ; , when ; , when ; , when in (e) and (f). The data is the cumulative number of confirmed cases of Wuhan in (a) and (b). The values of other parameters are set as: , , , , before January 23, 2020, and later
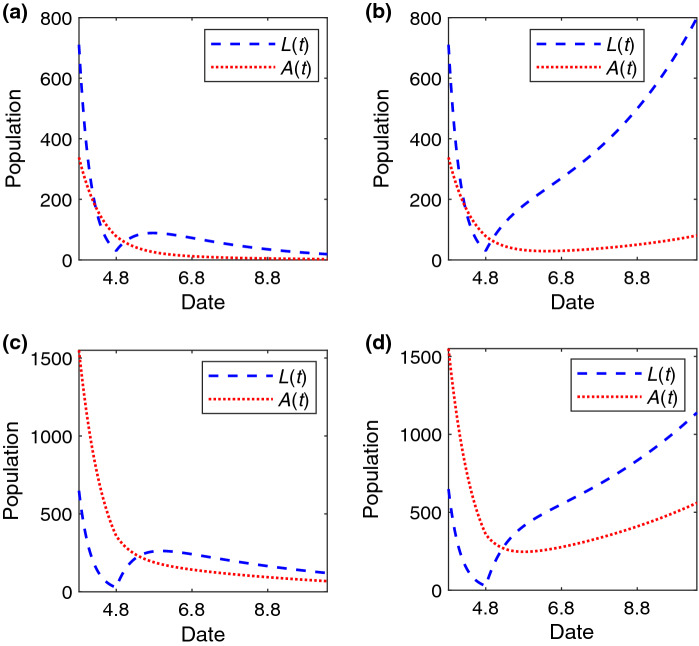
After lifting the lockdown of the city on April 8, 2020, we will further study the critical strength of control measures to contain the spreading of COVID-19. According to Eq. (3), we can compute under different . When (), the estimated spreading probability is (), and thus, (). Next, to measure the accuracy of critical strength analysis, we will choose the adjacent values of to study the trend of the fitting epidemic curve. When , we find that the trend of spreading tends to decline when is smaller than in Fig. 4a, and to expand when is larger than in Fig. 4b. The results are similar when in Fig. 4c, d.
Fig. 4.
The change of A(t) and L(t) versus time (unit: day) under different after lifting the lockdown of the Wuhan. The temporal trend of the number of individuals in the A and L state when a , , b , , c , and d , . The values of other parameters are set to: , , , , before January 23, 2020, and later
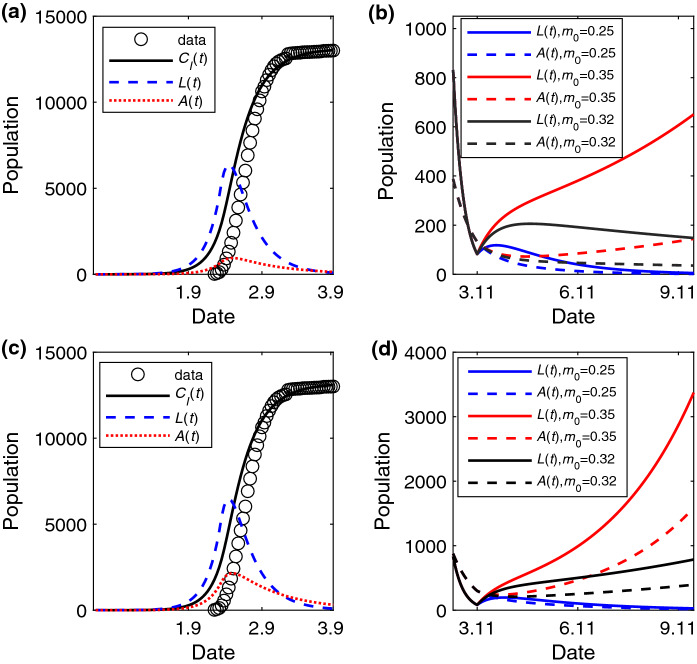
Besides, we derive the epidemic curve of China except for Hubei province in Fig. 5. The data are the confirmed cases from January 20, 2020, to March 10, 2020. We find that the spreading probability is smaller than that in Wuhan and is about 0.27 in Fig. 5a, c. The basic reproduction number is 3.03/3.31 when . With the curve tending to be stable, we compute the critical strength of control measures needed when and . The value is 0.33 and 0.30, respectively. We choose the adjacent values of to study the evolution trend of the fitting epidemic curve. When , we find that the trend of spreading tends to decline when is smaller than (e.g., ), and to expand when is larger than (e.g., ) in Fig. 5b. The results are similar when in Fig. 5d. In addition, we explore how affects the spreading when the value is between the critical strength of and [i.e., ]. The results show that L(t) and A(t) decline slowly when is smaller than 0.33 (e.g., ) with as shown in Fig. 5b, but increase slowly as the value of is larger than the critical strength of as shown in Fig. 5d.
Fig. 5.
The change of epidemic features with time for different and . The fitting epidemic curve , the number of individuals in the L state L(t) and in the A state A(t) versus time (unit: day) with the estimated parameters , when in (a) and (b), and , when in (c) and (d). The change of A(t) and L(t) with different in (b) and (d). The data is the cumulative number of confirmed cases of China except for Hubei province in (a) and (c). The values of other parameters are set as: , , , ,
Finally, we explore the relationship between the asymptomatic individuals and critical strength of control measures when there are a few individuals in the A or L state in the early moment of the system in Fig. 6. In this analysis, we assume that the strength m(t) of the control measures is a fixed value expressed as m. When the spreading probability is higher in Fig. 6b, the critical strength of control measures is smaller than that in Fig. 6a which means that the community needs stricter control measures to contain the spreading of the disease. Once the strength of control measures decreases (i.e., m increases) or the probability for the susceptible individual to be in the A state after infection increases, the total number of infected individuals will increase. Moreover, with increasing, decreases, which signifies that the stricter control measures are needed in the presence of the asymptomatic individuals.
Fig. 6.
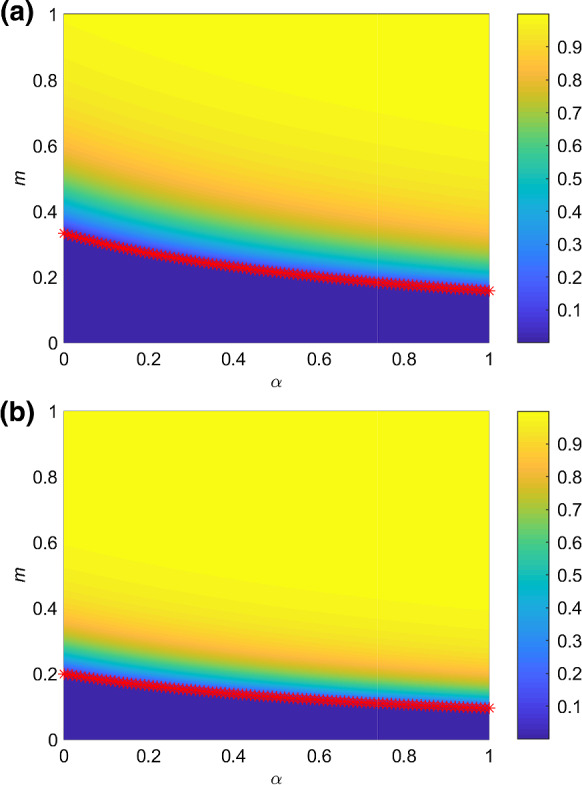
The color-coded values of total proportion of infected individuals who are recovered or dead at the end of the epidemic spreading in the parameter plane . m is the strength of control measures and is unchanged with time. The red asterisks indicate the value of with different according to Eq. (3). The spreading probability is a and b . The values of other parameters are set as: , , , ,
Conclusions
A SALIR model that considers the infection of asymptomatic individuals has been proposed. Based on some clinical characteristics of COVID-19, our model reproduces well the real epidemic curve.
Considering that the infected individuals have different characters and duration of infection in the spreading of COVID-19, we classify the individuals being infectious into two states: A and L state, by modifying the classical SIR model. By analyzing the critical strength of control measures to prevent a second outbreak of COVID-19, we find that the distribution of individuals in the two states and their infection duration all affect the value of , which reveals the importance of recognizing infected individuals who have different infection characters. Specifically, the larger the probability for a susceptible individual to be asymptomatic after the infection or the longer the infection duration is, the stricter the implemented control measures should be.
However, there is still a lack of detailed study about the asymptomatic individuals, especially regarding the questions of what the proportion of asymptomatic individuals in population is and how long an asymptomatic individual can carry the virus of COVID-19. Based on these pieces of information, the risk of COVID-19 can be better estimated by using our SALIR model.
In summary, our SALIR model analyzes the risk of the asymptomatic population for the second outbreak of COVID-19. As the suggestion of our model, the authorities should pay close attention to the presence of asymptomatic individuals, including the formulation of public health intervention policy and virus detection of suspected individuals.
Acknowledgements
This work was supported by the National Natural Science Foundation of China (Grant No. 61932005) and the Fundamental Research Funds for the Central Universities with contract number 2019XD-A10.
Compliance with ethical standards
Conflict of interest
The authors declare that they have no conflict of interests.
Footnotes
Publisher's Note
Springer Nature remains neutral with regard to jurisdictional claims in published maps and institutional affiliations.
References
- 1.Coronavirus disease 2019 (COVID-19) Situation Report - 124 (World Health Organization). https://www.who.int/docs/default-source/coronaviruse/situation-reports/20200523-covid-19-sitrep-124.pdf?sfvrsn=9626d639_2 [PubMed]
- 2.Hellewell J, Abbott S, Gimma A, Bosse NI, Jarvis CI, Russell TW, Munday JD, Kucharski AJ, Edmunds WJ, Sun F, et al. Feasibility of controlling COVID-19 outbreaks by isolation of cases and contacts. Lancet Glob. Health. 2020 doi: 10.1016/S2214-109X(20)30074-7. [DOI] [PMC free article] [PubMed] [Google Scholar]
- 3.Tian H, Liu Y, Li Y, Wu CH, Chen B, Kraemer MU, Li B, Cai J, Xu B, Yang Q, et al. An investigation of transmission control measures during the first 50 days of the COVID-19 epidemic in China. Science. 2020;368(6491):638. doi: 10.1126/science.abb6105. [DOI] [PMC free article] [PubMed] [Google Scholar]
- 4.Van Bavel JJ, Baicker K, Boggio PS, Capraro V, Cichocka A, Cikara M, Crockett MJ, Crum AJ, Douglas KM, Druckman JN, et al. Using social and behavioural science to support COVID-19 pandemic response. Nat. Hum. Behav. 2020 doi: 10.1038/s41562-020-0884-z. [DOI] [PubMed] [Google Scholar]
- 5.Johnson NF, Velásquez N, Restrepo NJ, Leahy R, Gabriel N, El Oud S, Zheng M, Manrique P, Wuchty S, Lupu Y. The online competition between pro-and anti-vaccination views. Nature. 2020 doi: 10.1038/s41586-020-2281-1. [DOI] [PubMed] [Google Scholar]
- 6.Wang C, Pan R, Wan X, Tan Y, Xu L, Ho CSH, Ho RCM. Immediate psychological responses and associated factors during the initial stage of the 2019 coronavirus disease (COVID-19) epidemic among the general population in China. Int. J. Environ. Res. Public Health. 2020;17(5):1729. doi: 10.3390/ijerph17051729. [DOI] [PMC free article] [PubMed] [Google Scholar]
- 7.Vespignani A, Tian H, Dye C, Lloyd-Smith JO, Eggo RM, Shrestha M, Scarpino SV, Gutierrez B, Kraemer MUG, Wu J, et al. Modelling COVID-19. Nat. Rev. Phys. 2020 doi: 10.1038/s42254-020-0178-4. [DOI] [PMC free article] [PubMed] [Google Scholar]
- 8.Chinazzi M, Davis JT, Ajelli M, Gioannini C, Litvinova M, Merler S, Piontti AP y, Mu K, Rossi L, Sun K, et al. The effect of travel restrictions on the spread of the 2019 novel coronavirus (COVID-19) outbreak. Science. 2020;368(6489):395. doi: 10.1126/science.aba9757. [DOI] [PMC free article] [PubMed] [Google Scholar]
- 9.Maleki M, Mahmoudi MR, Wraith D, Pho KH. Time series modelling to forecast the confirmed and recovered cases of COVID-19. Travel Med. Infect. Dis. 2020 doi: 10.1016/j.tmaid.2020.101742. [DOI] [PubMed] [Google Scholar]
- 10.Guan WJ, Ni ZY, Hu Y, Liang WH, Ou CQ, He JX, Liu L, Shan H, Lei CL, Hui DS, et al. Clinical characteristics of coronavirus disease 2019 in China. N. Engl. J. Med. 2020 doi: 10.1056/NEJMoa2002032. [DOI] [PMC free article] [PubMed] [Google Scholar]
- 11.Anderson RM, Anderson B, May RM. Infectious Diseases of Humans: Dynamics and Control. Oxford: Oxford University Press; 1992. [Google Scholar]
- 12.Shao N, Cheng J, Chen W. The reproductive number R0 of COVID-19 based on estimate of a statistical time delay dynamical system. MedRxiv. 2020 doi: 10.1101/2020.02.17.20023747. [DOI] [Google Scholar]
- 13.Wallinga J, Lipsitch M. How generation intervals shape the relationship between growth rates and reproductive numbers. Proc. R. Soc. B Biol. Sci. 2007;274(1609):599. doi: 10.1098/rspb.2006.3754. [DOI] [PMC free article] [PubMed] [Google Scholar]
- 14.Shi PP, Cao SL, Feng PH. SEIR Transmission dynamics model of 2019 nCoV coronavirus with considering the weak infectious ability and changes in latency duration. MedRxiv. 2020 doi: 10.1101/2020.02.16.20023655. [DOI] [Google Scholar]
- 15.Yang ZF, Zeng ZQ, Wang K, Wong SS, Liang WH, Zanin M, Liu P, Cao XD, Gao ZQ, Mai ZT, et al. Modified SEIR and AI prediction of the epidemics trend of COVID-19 in China under public health interventions. J. Thorac. Dis. 2020;12(2):165. doi: 10.21037/jtd.2020.02.64. [DOI] [PMC free article] [PubMed] [Google Scholar]
- 16.Coronavirus disease 2019 (COVID-19) Situation Report - 73 (World Health Organization). https://www.who.int/docs/default-source/coronaviruse/situation-reports/20200402-sitrep-73-covid-19.pdf?sfvrsn=5ae25bc7_6 [PubMed]
- 17.Bai Y, Yao L, Wei T, Tian F, Jin DY, Chen L, Wang M. Presumed asymptomatic carrier transmission of COVID-19. JAMA. 2020;323(14):1406. doi: 10.1001/jama.2020.2565. [DOI] [PMC free article] [PubMed] [Google Scholar]
- 18.Linton NM, Kobayashi T, Yang Y, Hayashi K, Akhmetzhanov AR, Jung SM, Yuan B, Kinoshita R, Nishiura H. Incubation period and other epidemiological characteristics of 2019 novel coronavirus infections with right truncation: a statistical analysis of publicly available case data. J. Clin. Med. 2020;9(2):538. doi: 10.3390/jcm9020538. [DOI] [PMC free article] [PubMed] [Google Scholar]
- 19.Wang W, Tang J, Wei F. Updated understanding of the outbreak of 2019 novel coronavirus (2019-nCoV) in Wuhan, China. J. Med. Virol. 2020;92(4):441. doi: 10.1002/jmv.25689. [DOI] [PMC free article] [PubMed] [Google Scholar]
- 20.Situation Reports from National Health Commission of the People’s Republic of China(in Chinese) (National Health Commission of the People’s Republic of China). https://www.nhc.gov.cn/xcs/yqtb/list_gzbd.shtml
- 21.Li Q, Guan X, Wu P, Wang X, Zhou L, Tong Y, Ren R, Leung KSM, Lau EHY, Wong JY, et al. Early transmission dynamics in Wuhan, China, of novel coronavirus-infected pneumonia. N. Engl. J. Med. 2020;382(13):1199. doi: 10.1056/NEJMoa2001316. [DOI] [PMC free article] [PubMed] [Google Scholar]
- 22.Baidu Qianxi (in Chinese) 2020. https://qianxi.baidu.com/
- 23.Cauchemez S, Boëlle PY, Thomas G, Valleron AJ. Estimating in real time the efficacy of measures to control emerging communicable diseases. Am. J. Epidemiol. 2006;164(6):591. doi: 10.1093/aje/kwj274. [DOI] [PubMed] [Google Scholar]


