

Abstract
Background:
In Caucasians, lower triglycerides (TG), total or LDL cholesterol and high HDL cholesterol are generally associated with lower mortality. However, low cholesterol is associated with higher mortality in some Asian populations. This study examines the relationship between serum lipids and mortality in American Indians.
Methods:
2125 American Indians aged ≥40 years were examined biennially between 1993 and 2007. Vital status was determined through 2011. Mortality rates, adjusted for age, sex and diabetes, were calculated using Poisson regression.
Results:
The median baseline age was 46 years and 61% were women. Over a median follow-up of 10.1 years, 522 deaths occurred. Relationships between baseline lipids, except for HDL cholesterol, and all-cause mortality were negative and linear in persons without diabetes and U-shaped in persons with diabetes. For HDL cholesterol, the relationship was U-shaped in the total cohort. Cardiovascular mortality was positively associated with total, LDL and non-HDL cholesterol whereas lower lipid concentrations were adversely associated with mortality from liver disease or external causes, except for HDL cholesterol, where associations were positive.
Conclusion:
The common belief that low cholesterol and TG are beneficial for health is not universally observed; evidence suggests increased mortality at both ends of the cholesterol and TG distributions.
1. Introduction
It is generally well accepted that low total or LDL cholesterol, low triglycerides and high HDL cholesterol predict lower mortality, particularly in Caucasian populations (1, 2). However, this benefit is not universal, such that in some Asian populations (3–5), low total cholesterol was associated with adverse mortality risk. Cholesterol and triglyceride distributions in American Indians differ from those of Caucasians (6), and it is possible that their relationships with mortality may also differ. In the general US population, the two leading causes of death in 1980 were cardiovascular disease (CVD) and cancer, but in an American Indian population they were accidents and adverse events and chronic liver disease and cirrhosis (7). A previous analysis of data collected between 1965 and 1990 in this population found associations between total cholesterol and mortality from all causes, CVD, infectious disease and diabetes or nephropathy (8). The current study aimed to confirm and extend these findings by examining the effects of the lipid fraction measurements, LDL, non-HDL and HDL cholesterol, triglycerides and triglyceride:HDL cholesterol (TG:HDL) ratio on mortality in the same population between 1993 and 2011.
2. Methods
A longitudinal study of diabetes among American Indians in the Southwestern U.S. began in 1965. Subjects were examined approximately every two years until 2007. The examination included a medical history, physical examination, biochemical measurements and review of outpatient and inpatient medical records of participants (9). As triglyceride and HDL cholesterol measurements were initiated in 1993, the present analysis included participants aged ≥40 years who were examined at least once between 1993 and 2007. The first examination in this period was considered as the baseline examination, and participants were followed from baseline until death or December 31, 2011, whichever came first.
Venous plasma glucose concentration was measured using hexokinase or glucose oxidase methods. Diabetes was defined using the World Health Organization criteria (10) as plasma glucose concentration 2 hours after a 75-g oral glucose tolerance test ≥11.1 mmol/l or if diabetes was documented in the course of routine medical care. Blood was drawn after an overnight fast for measurement of total cholesterol, HDL cholesterol and triglycerides using enzymatic methods (11–13). LDL cholesterol was calculated using the Friedewald equation. Seventy-four participants had triglyceride concentrations >4.52 mmol/l, which decreases the reliability of the equation, therefore LDL was not calculated for these participants (14). Non-HDL cholesterol was calculated as a surrogate for LDL cholesterol for all participants by subtracting HDL cholesterol from total cholesterol. Accuracy of the lipid assays has been monitored and verified by the Centers for Disease Control (CDC) Laboratory Program Office, the College of American Pathologists Surveys Program, or the American Association of Bioanalysts. Interassay coefficients of variation were 4.83% for HDL cholesterol, 5.20% for triglycerides, and 1.97% for total cholesterol by the enzymatic method and 2.47% for total cholesterol by the colorimetric method. Subjects were weighed while dressed in light clothing without shoes, and height was measured. Body mass index (BMI) was calculated as weight divided by the square of height (kg/m2). Blood pressure was measured at the first and fourth Korotkoff sounds with the subject supine. The CAGE questionnaire was used to asses alcohol abuse (15) with a score of 2 or greater indicating clinically significant problem drinking.
Records of deaths for community residents are maintained on a continuing basis. Vital status for all participants were cross-checked with the National Death Index to identify any deaths that may have been missed by the ongoing surveillance. Causes of death were adjudicated as described previously (7) and classified according to the ninth revision of the International Classification of Diseases (ICD-9). Deaths were classified as due to diseases of the circulatory system, which include cardiovascular diseases (ICD codes 390 to 398, 400 to 427.4, 427.6 to 459), liver diseases (ICD 571.0 to 571.5, 572.2 and 572.4), and external causes, which include accidents, suicides and homicides (ICD E800 – E999). This study was approved by the Institutional Review Board of the NIDDK. All participants provided written informed consent.
2.1. Statistical analysis
Age-sex-diabetes specific mortality rates were computed as deaths/1,000 person-years of follow-up. Follow-up was stratified by age as a time-dependent variable, and deaths rates were calculated in the age stratum in which they occurred, according to baseline diabetes status.
Serum lipids were log-transformed. To avoid excessive influence of extreme lipid concentrations, a 98% Winsorization was performed on each lipid, where the bottom and top 1% of values were set equal to the value corresponding to the 1st and 99th percentile, respectively. The relationship between serum lipids and mortality was assessed three ways. First, age-adjusted mortality rates were calculated using Poisson regression with serum lipid as the independent variable, stratified by sex and baseline diabetes. Continuous variables for serum lipids were included in each model, and the quadratic terms were also included when statistically significant (P<0.05) to account for non-linear relationships with mortality. Mortality rates were then plotted against serum lipids for a hypothetical person aged 50 years (median age of the population over the follow-up period = 49 years) at lipid concentrations between the 10th and 90th percentiles. As the Poisson model was used to calculate rates, it was constrained to non-negative values. Consequently, some of the linear models appear non-linear and some quadratic models appear cubic due to the lines becoming more asymptotic as the rates approach zero. Second, the overall relationships between serum lipids and mortality in the total cohort were determined. Log-likelihood ratio was used to compute p-values for these relationships by comparing the simple model to a more complex model. The simple model was a Poisson regression model with mortality as the dependent variable and age, sex and baseline diabetes as independent variables. The complex model included the simple model plus continuous variables for serum lipids. Quadratic terms and interaction terms with sex or diabetes were also included when statistically significant. Third, Poisson regression analyses were repeated using sex-specific quartiles of serum lipids, adjusted for age, sex and baseline diabetes. Interaction with sex and diabetes was again tested. Where there was significant interaction by sex, men and women were analyzed separately, and where there was significant interaction by diabetes, those with and without diabetes at baseline were analyzed separately. The potential influence of BMI, systolic blood pressure, lipid-lowering drugs, and alcohol abuse on the associations between serum lipids and mortality was examined by including these variables as covariates in the Poisson regression model.
To illustrate the overall relationship between total cholesterol and all-cause mortality, data from several studies across different populations (1, 2, 4, 5, 16–18) were compiled. As mortality rates in the studies were reported for categories of total cholesterol rather than at specific concentrations of total cholesterol, we plotted the rates at the mid-point of each category, except for the lowest and highest categories. For the lowest category, the rate was plotted at the value of the upper end of the category minus 0.5 mmol/l. For the highest category, the rate was plotted at the value of the lower end of the category plus 0.5 mmol/l. For example, where quartiles of total cholesterol were <4.0, 4.0–4.6, 4.7–5.2 and >5.2 mmol/l, rates were plotted at 3.50, 4.30, 4.95 and 5.70 mmol/l. Accordingly, for this figure, mortality rates in the current study were calculated by quartile of total cholesterol. As all studies had a category with a midpoint between 5.0 to 6.0 mmol/l, this was used as the reference.
Two sensitivity analyses were performed. First, person-years of follow-up and deaths within 5 years of baseline were excluded to reduce the effect of underlying disease on baseline lipid concentrations. Second, to limit misclassification due to potential inconsistencies in the designation of underlying causes of death, cause-specific deaths were defined when the cause was listed either as the underlying cause or as a factor that preceded the underlying cause of death.
All P values are 2-sided.
3. Results
The baseline characteristics of the study population are presented in Table 1. The median age was 46 years (IQR 42 – 54 years), 61% were women and <5% used lipid-lowering drugs. Over a median follow-up of 10.1 years (IQR 6.8 to 15.2 years), 522 deaths (23.2 per 1,000 person-years; median age at death = 62.7 years [IQR 52.6 to 73.1]) occurred in 2,125 participants. Of these, 127 were due to diseases of the circulatory system, 75 to liver disease, 67 to external causes and 253 to other natural causes, including 42 deaths from unknown causes which were presumed to be natural (Table 2). As deaths due to diseases of the circulatory system were due to CVD (ICD codes 410–440.9 or 402.9), they are referred to as cardiovascular deaths throughout the rest of the manuscript. Mortality rates for all causes, all natural causes, and CVD, but not for liver disease and external causes, were positively associated with age. Age-specific mortality rates were generally higher in men than women and in those with diabetes than those without diabetes. Of the 915 participants without diabetes at baseline, 138 (15%) were known to have developed diabetes before 2008.
Table 1.
Baseline Characteristics of the Study Population
| Median (interquartile range) or N (%) | ||||
|---|---|---|---|---|
| Men without diabetes | Men with diabetes | Women without diabetes | Women with diabetes | |
| N | 410 | 428 | 505 | 782 |
| Age (years) | 43.6 (41.4–49.5) | 48.6 (42.7–55.9) | 43.0 (41.2–48.0) | 49 (42.6–58.4) |
| Body mass index (kg/m2) | 31.7 (28.3–37.1) | 31.6 (28.0–36.9) | 34.4 (30.1–41.1) | 34.4 (29.7–40.5) |
| Systolic blood pressure (mmHg) | 124 (116–138) | 130 (120–144) | 116 (108–128) | 124 (112–140) |
| Diastolic blood pressure (mmHg) | 80 (70–86) | 80 (76–90) | 72 (66–80) | 76 (70–82) |
| Lipid-lowering drugs | 5 (1.23) | 26 (3.11) | 4 (0.8) | 69 (8.9) |
| Alcohol abuse | 285 (70.5) | 274 (64.8) | 223 (44.7) | 347 (45.0) |
| Triglycerides: mmol/L | 1.3 (0.9–1.8) | 1.6 (1.0–2.5) | 1.3 (0.9–1.8) | 1.6 (1.2–2.3) |
| mg/dl | 111.5 (78–157) | 141 (93–222) | 112 (81–155) | 144 (105–203) |
| Total cholesterol: mmol/L | 4.6 (4.1–5.2) | 4.6 (4.0–5.4) | 4.5 (4.1–5.1) | 4.6 (4.1–5.3) |
| mg/dl | 180 (157–201) | 179 (154–210) | 175 (157–198) | 179 (157–204) |
| LDL cholesterol: mmol/L | 2.8 (2.3–3.3) | 2.7 (2.2–3.3) | 2.7 (2.2–3.1) | 2.7 (2.2–3.2) |
| mg/dl | 109 (88–128) | 104 (85–127) | 102 (86–119) | 103 (84–123) |
| Non-HDL cholesterol: mmol/L | 3.5 (2.9–4.1) | 3.6 (2.8–4.3) | 3.2 (2.8–3.8) | 3.5 (2.9–4.1) |
| mg/dl | 134 (111–157) | 138 (110–167) | 125 (109–148) | 136 (113–160) |
| HDL cholesterol: mmol/L | 1.1 (0.9–1.4) | 1.0 (0.9–1.3) | 1.2 (1.0–1.5) | 1.1 (1.0–1.3) |
| mg/dl | 42 (36–55) | 40 (33–49) | 46 (40–56) | 43 (37–52) |
| TG:HDL ratio (mg/mg) | 2.6 (1.6–4.2) | 3.4 (2.1–6.1) | 2.4 (1.7–3.5) | 3.3 (2.2–5.2) |
TG:HDL ratio = Triglycerides : HDL cholesterol ratio
Table 2.
Mortality Rates by Sex, Diabetes, and Age Group During Follow-up
| Person-years | All cause | Natural causes | CVD | Liver disease | External causes | ||||||
|---|---|---|---|---|---|---|---|---|---|---|---|
| D | Rate* | D | Rate* | D | Rate* | D | Rate* | D | Rate* | ||
| Men without diabetes | |||||||||||
| 40–49 | 1718.8 | 33 | 19.2 | 20 | 11.64 | 3 | 1.75 | 9 | 5.24 | 13 | 7.56 |
| 50–59 | 1180.5 | 25 | 21.18 | 21 | 17.79 | 0 | 0 | 10 | 8.47 | 4 | 3.39 |
| 60–69 | 405.5 | 7 | 17.26 | 6 | 14.8 | 2 | 4.93 | 1 | 2.47 | 1 | 2.47 |
| ≥70 | 323.1 | 23 | 71.18 | 23 | 71.18 | 7 | 21.66 | 1 | 3.09 | 0 | 0 |
| Total | 3627.9 | 88 | 24.26 | 70 | 19.29 | 12 | 3.31 | 21 | 5.79 | 18 | 4.96 |
| Age-standardized | 25.48 | 21.17 | 4.04 | 5.57 | 4.32 | ||||||
| Men with diabetes | |||||||||||
| 40–49 | 1384.8 | 24 | 17.33 | 19 | 13.72 | 4 | 2.89 | 5 | 3.61 | 5 | 3.61 |
| 50–59 | 1733.5 | 50 | 28.84 | 41 | 23.65 | 8 | 4.62 | 10 | 5.77 | 9 | 5.19 |
| 60–69 | 1112.1 | 51 | 45.86 | 45 | 40.46 | 16 | 14.39 | 7 | 6.29 | 6 | 5.4 |
| ≥70 | 444.0 | 36 | 81.08 | 34 | 76.57 | 14 | 31.53 | 1 | 2.25 | 2 | 4.5 |
| Total | 4674.4 | 161 | 34.44 | 139 | 29.74 | 42 | 8.99 | 23 | 4.92 | 22 | 4.71 |
| Age-standardized | 33.93 | 29.34 | 8.93 | 4.69 | 4.58 | ||||||
| Women without diabetes | |||||||||||
| 40–49 | 2378.3 | 19 | 7.99 | 14 | 5.89 | 1 | 0.42 | 12 | 5.05 | 5 | 2.1 |
| 50–59 | 1582.7 | 9 | 5.69 | 7 | 4.42 | 2 | 1.26 | 2 | 1.26 | 2 | 1.26 |
| 60–69 | 544.8 | 7 | 12.85 | 7 | 12.85 | 0 | 0 | 0 | 0 | 0 | 0 |
| ≥70 | 371.1 | 15 | 40.42 | 14 | 37.72 | 4 | 10.78 | 1 | 2.69 | 1 | 2.69 |
| Total | 4876.9 | 50 | 10.25 | 42 | 8.61 | 7 | 1.44 | 15 | 3.08 | 8 | 1.64 |
| Age-standardized | 11.85 | 10.36 | 1.82 | 2.54 | 1.49 | ||||||
| Women with diabetes | |||||||||||
| 40–49 | 2577.5 | 22 | 8.54 | 14 | 5.43 | 4 | 1.55 | 1 | 0.39 | 8 | 3.1 |
| 50–59 | 3137.6 | 49 | 15.62 | 44 | 14.02 | 11 | 3.51 | 8 | 2.55 | 5 | 1.59 |
| 60–69 | 2170.1 | 63 | 29.03 | 60 | 27.65 | 16 | 7.37 | 6 | 2.76 | 3 | 1.38 |
| ≥70 | 1451.2 | 89 | 61.33 | 86 | 59.26 | 35 | 24.12 | 1 | 0.69 | 3 | 2.07 |
| Total | 9336.4 | 223 | 23.89 | 204 | 21.85 | 66 | 7.07 | 16 | 1.71 | 19 | 2.04 |
| Age-standardized | 20.86 | 18.71 | 5.90 | 1.60 | 2.15 | ||||||
D = number of deaths, CVD = cardiovascular disease
Natural causes (which include CVD and liver disease) and external causes of death are mutually exclusive and add up to the total number of deaths due to all causes.
per 1000 person-years. Person-years accumulated in each decade of age were counted separately. Diabetes was not updated and participants contributed person-years according to their diabetes status at baseline.
Age standardization was performed using the direct method and the total study cohort as the standard population.
Associations of serum lipids with all-cause mortality in the total cohort were quadratic, except for TG:HDL ratio where the relationship was linear (Figure 1). The interaction term with diabetes was significant for all lipids except HDL cholesterol. No sex interaction was present. When those with and without diabetes were analyzed separately, among those without diabetes, lower concentrations of total cholesterol, LDL cholesterol, non-HDL cholesterol, triglycerides and lower TG:HDL ratio were associated with higher all-cause mortality rates. In contrast, among those with diabetes, U-shaped relationships were observed between total, LDL and non-HDL cholesterols and all-cause mortality, a negative relationship was observed between TG:HDL ratio and all-cause mortality, and no significant association was found between triglycerides and all-cause mortality.
Figure 1.
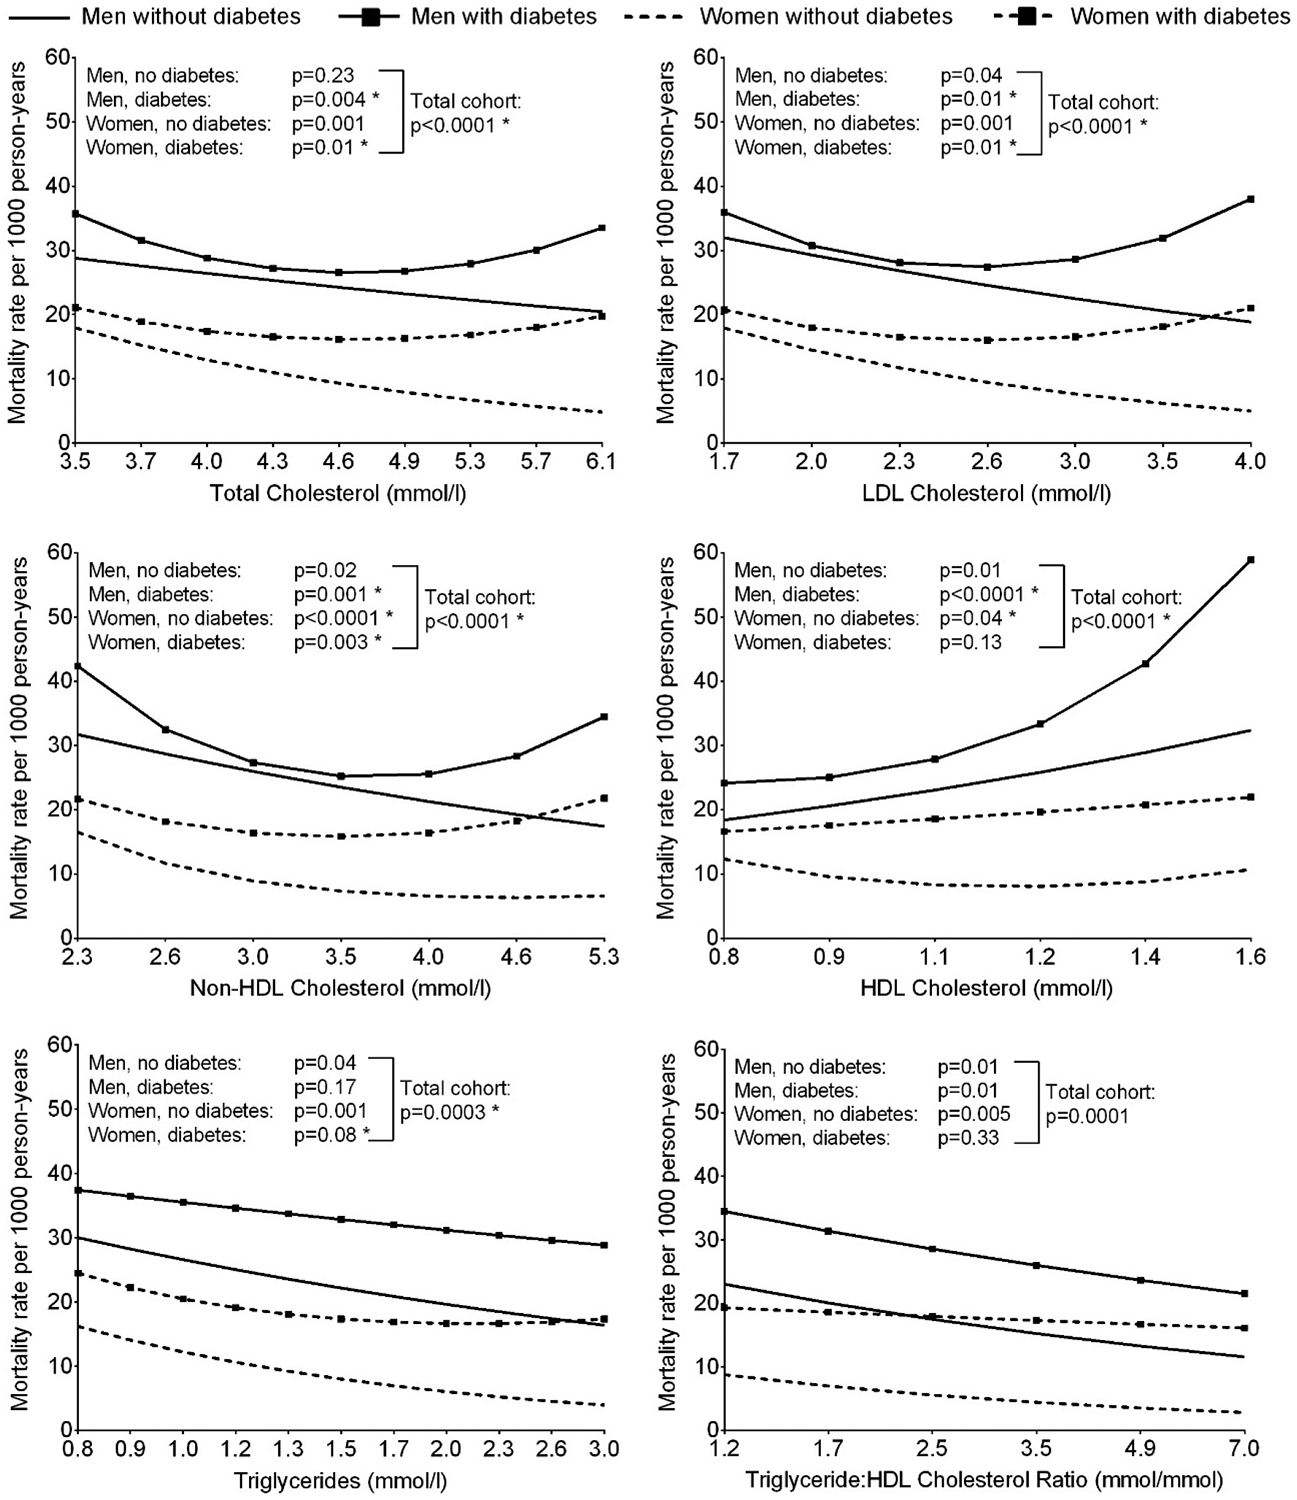
Age-adjusted all-cause mortality rate per 1000 person-years according to serum lipid concentrations at baseline, stratified by sex and diabetes (*P<0.05 for the model where lipid was included as a quadratic term vs. model with linear term alone). The horizontal axis is on a log scale, however, the values have been back transformed to raw units. Significant diabetes interactions were present for associations with all lipids except HDL cholesterol.
For deaths due to natural causes, in the total cohort, quadratic relationships were found for total, LDL and non-HDL cholesterol, while relationships with HDL cholesterol, triglycerides and TG:HDL ratio were linear (Supplemental Figure S1). A significant sex interaction was present for the relationship between LDL cholesterol and mortality due to natural causes, though U-shape relationships were found for both men and women when analyzed separately. For non-HDL cholesterol, a significant diabetes interaction was present where in those without diabetes, higher non-HDL cholesterol concentrations were associated with lower rates of death due to natural causes, and in those with diabetes, a U-shape relationship was found.
Greater rates of cardiovascular mortality were observed for higher concentrations of total, LDL and non-HDL cholesterol in the total cohort (Figure 2). There was a significant interaction with diabetes for non-HDL cholesterol, and a significant relationship with cardiovascular mortality was found only in those with diabetes. No significant relationships with HDL cholesterol, triglycerides or TG:HDL ratio were found overall, though a sex interaction was present for TG:HDL ratio and a significant positive linear association was found in women.
Figure 2.
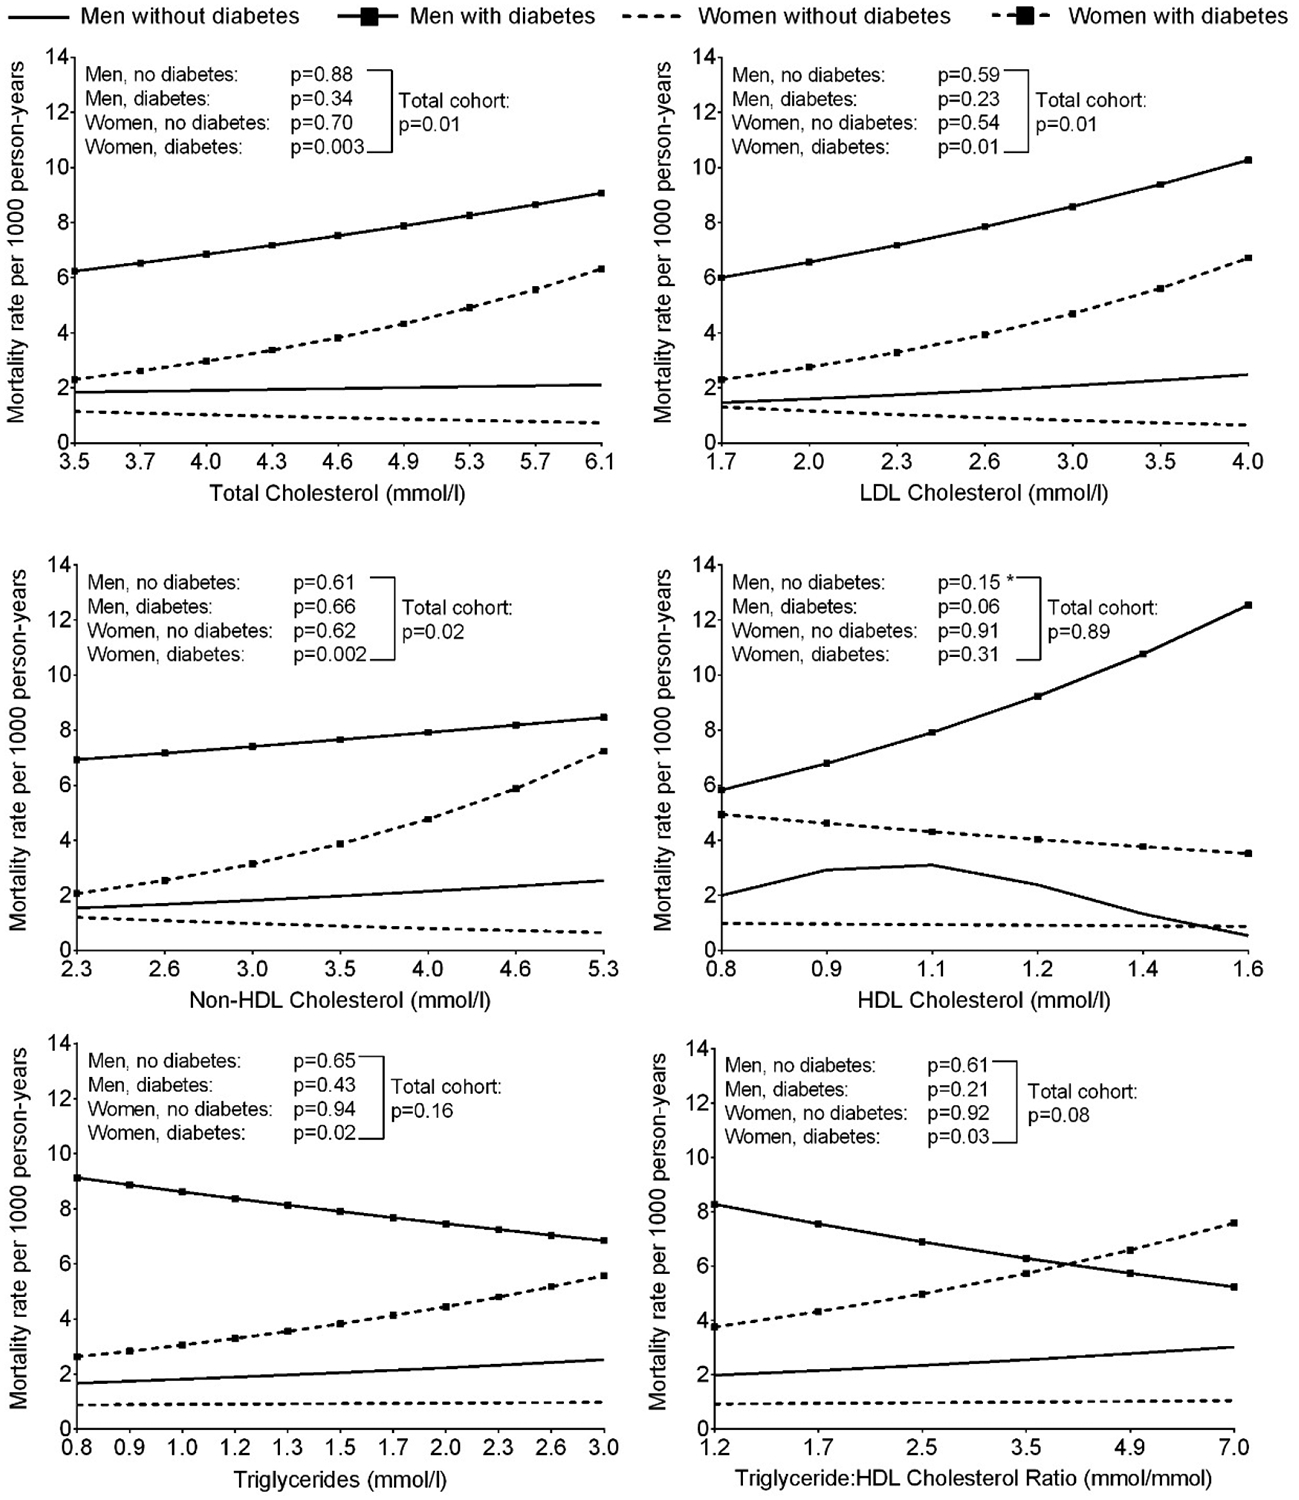
Age-adjusted cardiovascular mortality rate per 1000 person-years according to serum lipid concentrations at baseline, stratified by sex and diabetes (*P<0.05 for the model where lipid was included as a quadratic term vs. model with linear term alone). The horizontal axis is on a log scale, however, the values have been back transformed to raw units. A significant diabetes interaction was present for the association with non-HDL cholesterol and a significant sex interaction was present for the association with TG:HDL cholesterol ratio.
Higher mortality rates for liver disease were found in those with lower concentrations of total cholesterol, LDL cholesterol, non-HDL cholesterol and triglycerides, higher concentrations of HDL cholesterol, and lower TG:HDL ratio (Figure 3). All relationships were significantly linear and no interactions with sex or diabetes were found.
Figure 3.
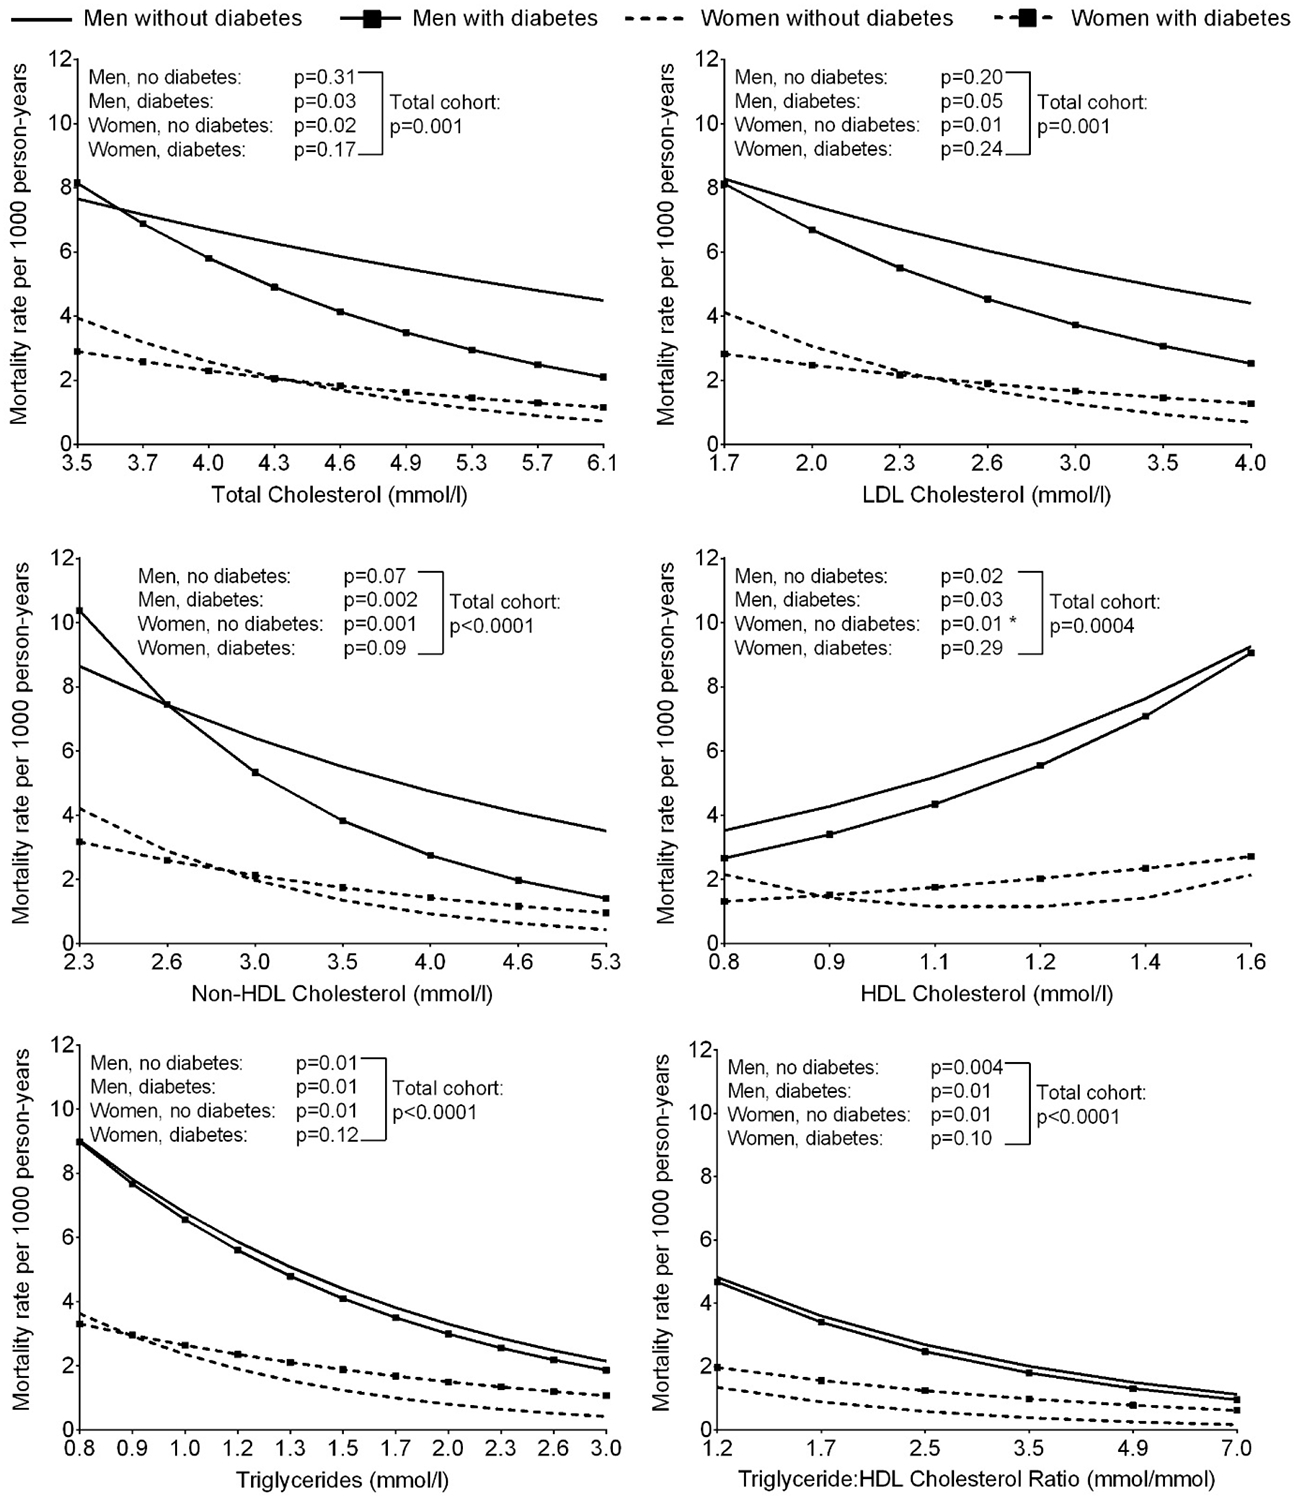
Age-adjusted liver disease mortality rate per 1000 person-years according to serum lipid concentrations at baseline, stratified by sex and diabetes (*P<0.05 for the model where lipid was included as a quadratic term vs. model with linear term alone). The horizontal axis is on a log scale, however, the values have been back transformed to raw units.
For mortality due to external causes, quadratic relationships were observed with total cholesterol, non-HDL cholesterol and triglycerides in the total cohort, and linear relationships with LDL cholesterol, HDL cholesterol and TG:HDL ratio (Supplemental Figure S2). A sex interaction was found for the relationship between LDL cholesterol and mortality due to external causes where a significant quadratic relationship was found in women only. For non-HDL cholesterol, there was a significant interaction with diabetes in the relationship with mortality due to external causes. In those without diabetes, higher non-HDL cholesterol concentrations were associated with lower mortality rates, and in those with diabetes, a U-shape relationship was found.
Inclusion of BMI, systolic blood pressure, lipid-lowering drugs, and alcohol abuse in our analyses did not significantly alter the relationships between serum lipid concentrations and all-cause and cause-specific mortality (data not shown). These variables were therefore omitted from the final analyses.
When serum lipids were examined in sex-specific quartiles, similar associations were found for all-cause mortality, mortality due to natural causes and liver disease mortality (Supplemental Table S1). For cardiovascular mortality and mortality from external causes, some associations that were significant when serum lipids were analyzed as continuous variables were no longer significant when lipids were analyzed as quartiles. Nevertheless, the patterns of association remained consistent.
3.1. Sensitivity analyses
There were 351 deaths after exclusion of deaths within the first five years from baseline. Of these, 321 were due to natural causes – of which 88 were cardiovascular deaths and 46 were due to liver disease – and 30 were due to external causes. Associations between serum lipid concentrations and mortality remained similar to the main analysis, though some were no longer statistically significant, possibly due to the reduced sample size (Supplemental Figures S3–7).
When cause-specific deaths were defined based on either the underlying cause or factors that preceded the underlying cause, 146 deaths were classified as cardiovascular deaths and 84 were due to liver disease. Here, the relationships between LDL and non-HDL cholesterol and cardiovascular mortality were attenuated, while a significant linear association between TG:HDL ratio and cardiovascular mortality was observed (Supplemental Figure S8). Associations between serum lipids and liver mortality remained unchanged (Supplemental Figure S9).
4. Discussion
In this study, lower concentrations of serum lipids, including total cholesterol, LDL cholesterol, non-HDL cholesterol and triglycerides, lower TG:HDL ratio, and elevated HDL cholesterol were generally associated with increased all-cause mortality and mortality from all natural causes, liver disease and external causes, whereas the opposite was observed for cardiovascular mortality. Higher concentrations of total, LDL and non-HDL cholesterol and higher TG:HDL ratio were associated with greater cardiovascular mortality.
The current cohort was sampled from the same population analyzed by Fagot-Campagna et al (8), however, there are some differences including measurement of triglycerides and HDL cholesterol, resulting in a more contemporary cohort with a baseline of 1993 onwards. In the earlier paper, the relationships with baseline total cholesterol were U-shaped for all-cause mortality, positive for mortality from CVD and stroke, and not significant for mortality from alcohol-related diseases or from trauma. In the current study, the relationship between baseline total cholesterol and all-cause mortality was negative and linear in those without diabetes and U-shaped in those with diabetes. Total cholesterol was positively associated with cardiovascular mortality, negatively associated with liver disease mortality and had U-shaped relationships with mortality from natural causes and from external causes.
Evidence relating lipids to all-cause mortality suggests adverse mortality experiences at both ends of the lipid spectrum (1, 4, 8, 16, 17). While some between-study differences are present, this may be, in part, attributable to differences in the cholesterol distributions and in causes of death of the various study populations. For example, studies in Caucasian populations have generally found that those with higher total and LDL cholesterol have greater risk for all-cause mortality (1, 2, 19), though U-shaped relationships in Caucasians have also been shown (20, 21), while studies in East Asian populations tend to report the highest risk for all-cause mortality in those with low total cholesterol (3–5). The East Asian results are similar to those observed in our study. While the reason for this similarity is uncertain, as with American Indians, East Asian populations generally have lower mean cholesterol (4, 6, 19), which may have contributed to these findings.
To illustrate the overall relationship between total cholesterol and all-cause mortality, we compiled data from several studies across different populations (1, 2, 4, 5, 16–18), summarized in Supplemental Figure S10. While the absolute rates are not directly comparable across studies due to differences in age and sex distributions between study populations, the comparison of rate ratios illustrates that although each individual pattern was somewhat different, the overall relationship between total cholesterol and all-cause mortality appears to be U-shaped with higher mortality rates at both ends of the distribution. Mortality rates at total cholesterol concentrations <4.0 mmol/l and >6.0 mmol/l were typically higher than at 5.0–6.0 mmol/l, except in the two populations from Japan where mortality rates were lower at higher cholesterol concentrations.
One hypothesis to explain the negative associations between serum lipids (except HDL cholesterol where associations were positive) and mortality due to all causes, liver disease, or external causes, relates to alcohol consumption. American Indians are reported to have lower rates of alcohol use but higher rates of binge drinking among users than reported in national US surveys (22). Lipid concentrations are influenced by alcohol consumption, such that triglycerides and HDL cholesterol can be increased with moderate alcohol intake (23). Furthermore, serum cholesterol and triglycerides are reduced in patients with liver disease (24). It is possible that liver disease was present at the time of the baseline examination resulting in low LDL or non-HDL cholesterol, low triglycerides or high HDL cholesterol, and which subsequently progressed to cause death. Nevertheless, similar negative associations (positive for HDL cholesterol) were observed with non-liver disease related deaths, and adjustment for alcohol abuse (data not shown) or excluding deaths within five years of baseline (Supplemental) did not alter the associations between serum lipids and all-cause mortality, liver disease mortality or mortality due to external causes in the current study. Notably, while the CAGE questionnaire is a valid screening tool for alcohol dependence in this population (25), it does not provide quantitative information on alcohol consumption. As even moderate alcohol intake can influence lipid levels, our division of participants into presence or absence of clinically significant alcohol abuse is likely too insensitive to capture the influence of different levels of alcohol consumption on serum lipids.
Mental disorders, such as depression, may increase the risk of suicide and contribute to poor diet and lifestyle habits, which could result in lower serum cholesterol and triglycerides. Binge drinking could also increase the risk of homicides and accidents. These may explain some of the negative associations between cholesterol and mortality due to external causes, which had also been reported by others (26, 27).
Cardiovascular disease is one of the leading causes of death in many populations including the US (28). Although deaths due to external causes is the main contributor to overall mortality in this American Indian population (7), this is primarily in the younger ages. In our study population of persons aged 40 years and over, CVD was one of the largest contributor to overall mortality. In contrast to our findings relating serum lipids to total mortality and mortality from liver disease or external causes, we found similar positive relationships between total, LDL and non-HDL cholesterol and CVD mortality as reported in Caucasian populations (3, 19, 29, 30). We also found a positive association between HDL cholesterol and cardiovascular deaths when deaths were defined based on the underlying cause of death or factors that preceded the underlying cause, although HDL cholesterol was not significantly associated with cardiovascular deaths when based only on underlying cause of death.
Differences in relationships between serum lipids and all-cause mortality in persons with and without diabetes may be partly explained by the differences in specific causes of death. Both men and women with diabetes have greater CVD mortality compared to their counterparts without diabetes, thus resulting in greater death rates due to natural causes and overall. Comparatively, persons without diabetes had higher rates due to external causes. Differences in characteristics other than lipids, such as blood pressure and chronic kidney disease, may also have contributed to the difference in relationships observed between persons with and without diabetes.
The mortality rates observed in this population were higher than those in the general US population. According to data from the CDC, the overall mortality rate in the US in 2005 (the mid-point of follow-up in our study was 2005) were 17.8 per 1,000 person-years in men and 17.0 per 1,000 person-years in women [computed using CDC WONDER https://wonder.cdc.gov/ (accessed 03/13/2017)]. In comparison, when standardized to the 2005 US population structure aged ≥40 years using the direct method, mortality rates in our study were 32.9 and 21.7 per 1,000 person-years in men and women. Such a difference in mortality rates between this American Indian population and the general US population had been described previously using mortality data from 1975 to 1984, where American Indian men and women had age-specific mortality rates that were almost twice as high as those in the general US population (7). Here we see a similar difference in mortality rates in men, though the difference in women is lower. Diabetes disproportionately affects American Indians and people with diabetes are at greater risk of mortality than their non-diabetic counterparts. This may, in part, explain the higher mortality rates in this American Indian population compared to the general US population.
Two strengths of our study include its relatively long follow-up period and our community-based sampling which enable the results to be representative of our study population. However, we were limited by our inability to accurately classify the underlying causes of liver diseases (e.g., viral, obesity or alcohol related) or to adequately control for potential confounders such as alcohol consumption, low socioeconomic status, baseline liver function, and chronic low-grade liver disease, which given their influence on lipids, may influence some of the relationships observed in our study.
5. Conclusions
In this American Indian population, low triglycerides, total cholesterol, LDL cholesterol and non-HDL cholesterol were risk factors for all-cause mortality and most cause-specific mortality. In the case of mortality from liver disease or external causes, it is possible that low triglycerides and cholesterol are a consequence of high alcohol consumption, which increases the risk of liver disease, accidents and homicides, and may be linked to depression which may in turn lead to suicide. Low cholesterol and low triglycerides are widely believed to be beneficial for health and associated with lower mortality. However, this is not universally observed, and current evidence suggests increased health risks at both ends of the cholesterol and triglyceride distributions.
Supplementary Material
9. Acknowledgements
We are grateful to the NIDDK clinic staff and the study volunteers.
8. Funding
This work was supported by the Intramural Research Program of the NIDDK.
6. Abbreviations
- CDC
Centers for Diseases Control
- CVD
Cardiovascular disease
- ICD
International Classification of Diseases
- HDL
High density lipoprotein
- LDL
Low density lipoprotein
- TG
Triglycerides
Footnotes
Competing interests
None.
References
- 1.Cowan LD, O’Connell DL, Criqui MH, Barrett-Connor E, Bush TL, Wallace RB. Cancer mortality and lipid and lipoprotein levels. Lipid Research Clinics Program Mortality Follow-up Study. Am J Epidemiol. 1990;131(3):468–82. [DOI] [PubMed] [Google Scholar]
- 2.Johansson S, Wilhelmsen L, Lappas G, Rosengren A. High lipid levels and coronary disease in women in Goteborg--outcome and secular trends: a prospective 19 year follow-up in the BEDA*study. Eur Heart J. 2003;24(8):704–16. [DOI] [PubMed] [Google Scholar]
- 3.Bae JM, Yang YJ, Li ZM, Ahn YO. Low cholesterol is associated with mortality from cardiovascular diseases: a dynamic cohort study in Korean adults. J Korean Med Sci. 2012;27(1):58–63. [DOI] [PMC free article] [PubMed] [Google Scholar]
- 4.Song YM, Sung J, Kim JS. Which cholesterol level is related to the lowest mortality in a population with low mean cholesterol level: a 6.4-year follow-up study of 482,472 Korean men. Am J Epidemiol. 2000;151(8):739–47. [DOI] [PubMed] [Google Scholar]
- 5.Iso H, Naito Y, Kitamura A, Sato S, Kiyama M, Takayama Y, et al. Serum total cholesterol and mortality in a Japanese population. J Clin Epidemiol. 1994;47(9):961–9. [DOI] [PubMed] [Google Scholar]
- 6.Howard BV, Davis MP, Pettitt DJ, Knowler WC, Bennett PH. Plasma and lipoprotein cholesterol and triglyceride concentrations in the Pima Indians: distributions differing from those of Caucasians. Circulation. 1983;68(4):714–24. [DOI] [PubMed] [Google Scholar]
- 7.Sievers ML, Nelson RG, Bennett PH. Adverse mortality experience of a southwestern American Indian community: overall death rates and underlying causes of death in Pima Indians. J Clin Epidemiol. 1990;43(11):1231–42. [DOI] [PubMed] [Google Scholar]
- 8.Fagot-Campagna A, Hanson RL, Narayan KM, Sievers ML, Pettitt DJ, Nelson RG, et al. Serum cholesterol and mortality rates in a Native American population with low cholesterol concentrations: a U-shaped association. Circulation. 1997;96(5):1408–15. [DOI] [PubMed] [Google Scholar]
- 9.Knowler WC, Bennett PH, Hamman RF, Miller M. Diabetes incidence and prevalence in Pima Indians: a 19-fold greater incidence than in Rochester, Minnesota. Am J Epidemiol. 1978;108(6):497–505. [DOI] [PubMed] [Google Scholar]
- 10.World Health Organization Study Group. World Health Organization Techinical Report Series 727. Geneva: World Health Organization, 1985. [Google Scholar]
- 11.Allain CC, Poon LS, Chan CS, Richmond W, Fu PC. Enzymatic determination of total serum cholesterol. Clin Chem. 1974;20(4):470–5. [PubMed] [Google Scholar]
- 12.Nagele U, Hagele EO, Sauer G, Wiedemann E, Lehmann P, Wahlefeld AW, et al. Reagent for the enzymatic determination of serum total triglycerides with improved lipolytic efficiency. J Clin Chem Clin Biochem. 1984;22(2):165–74. [DOI] [PubMed] [Google Scholar]
- 13.Warnick GR, Benderson J, Albers JJ. Dextran sulfate-Mg2+ precipitation procedure for quantitation of high-density-lipoprotein cholesterol. Clin Chem. 1982;28(6):1379–88. [PubMed] [Google Scholar]
- 14.Rifai N, Warnick GR, McNamara JR, Belcher JD, Grinstead GF, Frantz ID Jr. Measurement of low-density-lipoprotein cholesterol in serum: a status report. Clin Chem. 1992;38(1):150–60. [PubMed] [Google Scholar]
- 15.Ewing JA. Detecting alcoholism. The CAGE questionnaire. JAMA. 1984;252(14):1905–7. [DOI] [PubMed] [Google Scholar]
- 16.Nago N, Ishikawa S, Goto T, Kayaba K. Low cholesterol is associated with mortality from stroke, heart disease, and cancer: the Jichi Medical School Cohort Study. J Epidemiol. 2011;21(1):67–74. [DOI] [PMC free article] [PubMed] [Google Scholar]
- 17.Schatz IJ, Masaki K, Yano K, Chen R, Rodriguez BL, Curb JD. Cholesterol and all-cause mortality in elderly people from the Honolulu Heart Program: a cohort study. Lancet. 2001;358(9279):351–5. [DOI] [PubMed] [Google Scholar]
- 18.Yaari S, Goldbourt, Even-Zohar S, Neufeld HN. Associations of serum high density lipoprotein and total cholesterol with total, cardiovascular, and cancer mortality in a 7-year prospective study of 10 000 men. Lancet. 1981;1(8228):1011–5. [DOI] [PubMed] [Google Scholar]
- 19.Cai J, Pajak A, Li Y, Shestov D, Davis CE, Rywik S, et al. Total cholesterol and mortality in China, Poland, Russia, and the US. Ann Epidemiol. 2004;14(6):399–408. [DOI] [PubMed] [Google Scholar]
- 20.D’Agostino RB, Belanger AJ, Kannel WB, Higgins M. Role of smoking in the U-shaped relation of cholesterol to mortality in men. The Framingham Study. Am J Epidemiol. 1995;141(9):822–7. [DOI] [PubMed] [Google Scholar]
- 21.Harris T, Feldman JJ, Kleinman JC, Ettinger WH Jr., Makuc DM, Schatzkin AG. The low cholesterol-mortality association in a national cohort. J Clin Epidemiol. 1992;45(6):595–601. [DOI] [PubMed] [Google Scholar]
- 22.Welty TK, Lee ET, Yeh J, Cowan LD, Go O, Fabsitz RR, et al. Cardiovascular disease risk factors among American Indians. The Strong Heart Study. Am J Epidemiol. 1995;142(3):269–87. [DOI] [PubMed] [Google Scholar]
- 23.Castelli WP, Doyle JT, Gordon T, Hames CG, Hjortland MC, Hulley SB, et al. Alcohol and blood lipids. The cooperative lipoprotein phenotyping study. Lancet. 1977;2(8030):153–5. [DOI] [PubMed] [Google Scholar]
- 24.Cicognani C, Malavolti M, Morselli-Labate AM, Zamboni L, Sama C, Barbara L. Serum lipid and lipoprotein patterns in patients with liver cirrhosis and chronic active hepatitis. Arch Intern Med. 1997;157(7):792–6. [PubMed] [Google Scholar]
- 25.Saremi A, Hanson RL, Williams DE, Roumain J, Robin RW, Long JC, et al. Validity of the CAGE questionnaire in an American Indian population. J Stud Alcohol. 2001;62(3):294–300. [DOI] [PubMed] [Google Scholar]
- 26.Lindberg G, Rastam L, Gullberg B, Eklund GA. Low serum cholesterol concentration and short term mortality from injuries in men and women. BMJ. 1992;305(6848):277–9. [DOI] [PMC free article] [PubMed] [Google Scholar]
- 27.Schuit AJ, Dekker JM, Schouten EG, Kok FJ. Low serum cholesterol and death due to accidents, violence, or suicide. Lancet. 1993;341(8848):827. [DOI] [PubMed] [Google Scholar]
- 28.National Center for Health Statistics. Health, United States, 2014: With Special Feature on Adults Aged 55–64. Hyattsville, MD: 2015. [PubMed] [Google Scholar]
- 29.Smith GD, Shipley MJ, Marmot MG, Rose G. Plasma cholesterol concentration and mortality. The Whitehall Study. JAMA. 1992;267(1):70–6. [PubMed] [Google Scholar]
- 30.Okamura T, Tanaka H, Miyamatsu N, Hayakawa T, Kadowaki T, Kita Y, et al. The relationship between serum total cholesterol and all-cause or cause-specific mortality in a 17.3-year study of a Japanese cohort. Atherosclerosis. 2007;190(1):216–23. [DOI] [PubMed] [Google Scholar]
Associated Data
This section collects any data citations, data availability statements, or supplementary materials included in this article.