

Abstract
This study examined global resting‐state functional connectivity of neural oscillations in individuals with chronic tinnitus and normal and impaired hearing. We tested the hypothesis that distinct neural oscillatory networks are engaged in tinnitus with and without hearing loss. In both tinnitus groups, with and without hearing loss, we identified multiple frequency band‐dependent regions of increased and decreased global functional connectivity. We also found that the auditory domain of tinnitus severity, assayed by the Tinnitus Functional Index, was associated with global functional connectivity in both auditory and nonauditory regions. These findings provide candidate biomarkers to target and monitor treatments for tinnitus with and without hearing loss.
Keywords: biomarkers, electroencephalography, functional brain imaging, hearing loss, magnetoencephalography, tinnitus
1. INTRODUCTION
Subjective tinnitus (hereafter referred to as “tinnitus”) refers to the conscious perception of sound for which no external auditory stimulus can be identified. Prevalence estimates range from 10 to 15% (Langguth, Kreuzer, Kleinjung, & De Ridder, 2013), and although there are treatments to reduce its bothersome effects, there are many for whom treatment brings insufficient, if any, relief from its chronic manifestation. These treatment failures may be due to our limited understanding of the complicated and heterogeneous etiologies of tinnitus, and our consequent inability to tailor treatments to underlying pathology.
Among theories on the etiology of tinnitus, pathological oscillatory activity in the brain has found considerable support. Indeed, differences in oscillatory activity within different frequency bands can signify functional pathology, as focal low‐frequency activity is often associated with abnormal brain function (Papanicolaou, 2009). As such, much work has been dedicated to identifying neural correlates of conscious tinnitus perception through comparison of spontaneous resting‐state oscillations in brain activity in individuals with and without tinnitus using silently acquired recording modalities that are noninvasive such as magnetoencephalography (MEG) or electroencephalography. In response to theories of aberrant oscillatory behavior in tinnitus and their supporting evidence, many proposed treatments are aimed at directly or indirectly altering oscillatory activity in the hopes of delivering symptom relief (Adamchic et al., 2017; Adamchic, Hauptmann, & Tass, 2012; De Ridder, Joos, & Vanneste, 2016; De Ridder, Song, & Vanneste, 2013; De Ridder & Vanneste, 2012; Hartmann, Lorenz, Müller, Langguth, & Weisz, 2014; Larson & Cheung, 2012, 2013; Silchenko, Adamchic, Hauptmann, & Tass, 2013; Weisz, Lüchinger, Thut, & Müller, 2014). Previous MEG studies investigating the functional pathology of tinnitus have resulted in mixed findings, with some studies suggesting functional abnormalities in and around auditory cortex (Hartmann et al., 2014) or in connectivity between auditory cortex and other brain regions (Zobay, Palmer, Hall, Sereda, & Adjamian, 2015). Others point to more diffuse, long‐range networks including prefrontal, orbitofrontal, and parietooccipital cortex (Schlee, Mueller, et al., 2009) or anterior cingulate and right frontal and parietal regions (Schlee, Weisz, Bertrand, Hartmann, & Elbert, 2008). One MEG study identified potential effects of tinnitus duration on the distribution of the gamma network. Specifically, in the shorter‐duration tinnitus group, the majority of gamma band connections involved the left temporal cortex, whereas the long‐duration tinnitus group showed a widely distributed gamma network involving temporal, frontal, and parietal regions (Schlee, Hartmann, Langguth, & Weisz, 2009).
Neural oscillatory patterns attributed to tinnitus have been heterogeneous (Adjamian, 2014; De Ridder et al., 2016; Langguth et al., 2013; Levine & Oron, 2015; Newall et al., 2001). Here, we examine whether the presence or absence of hearing loss is a key contributor to heterogeneity of neural oscillatory findings in tinnitus. Many models of tinnitus assume that tinnitus is caused by neural deafferentation due to hearing loss, resulting in changes in cortical oscillatory activity (De Ridder et al., 2014; De Ridder, Vanneste, Langguth, & Llinas, 2015; Eggermont & Tass, 2015; Georgiewa et al., 2006; Kraus & Canlon, 2012; Llinas, Ribary, Jeanmonod, Kronberg, & Mitra, 1999; Rauschecker, Leaver, & Mu, 2010). But the presence of hearing loss does not ensure ongoing, chronic tinnitus, and not all those with tinnitus have an abnormal audiogram (Langguth et al., 2013). In this context, distinct contributions of the presence or absence of hearing loss on chronic tinnitus and its manifestations on brain oscillations have never been explored adequately, especially using MEG imaging.
In the present study, resting‐state global functional connectivity of neural oscillations were examined to isolate patterns specifically attributable to tinnitus versus patterns of abnormal oscillatory activity that may be attributable to hearing loss alone or to tinnitus with concurrent hearing loss. The long‐term objective is to use information gained about tinnitus‐specific aberrant neural oscillatory activity to inform treatment approaches or monitor treatment response, or potentially to match individuals to more targeted treatments based on their resting oscillatory profiles.
2. METHODS
All study procedures were approved by the University of California, San Francisco (UCSF) Institutional Review Board and were conducted in accordance with the approved protocols. Informed consent was obtained from all participants in accordance with the Declaration of Helsinki.
2.1. Participants
Participants were 99 adults (38 females and 61 males) aged 24–80 years who were recruited from otolaryngology and audiology clinics affiliated with the UCSF. Participants with chronic tinnitus experienced continuous symptoms that were present for at least 1 year. There were four groups: (a) tinnitus group without hearing loss (HL−TIN+; N = 31), (b) control group without hearing loss and without tinnitus (HL−TIN−; N = 21), (c) tinnitus group with hearing loss (HL+TIN+, N = 32), and (d) control group with hearing loss and without tinnitus (HL+TIN−; N = 15). Hearing loss was defined as >35 dB loss at any frequency or >25 dB loss for the average of lower (500, 1,000, and 2000 Hz) or higher frequency tones (4,000, 6,000, and 8,000 Hz) in either ear. Participant characteristics are presented in Table 1.
Table 1.
Group characteristics (M ± SD [range])
| HL−TIN− | HL−TIN+ | HL+TIN− | HL+TIN+ | Statistics | |
|---|---|---|---|---|---|
| Age | 45.7 ± 12.4 a , b | 49.6 ± 11.3 a | 63.9 ± 9.7 c | 56.7 ± 11.1 d | F(3,95) = 9.8* |
| [24–62] | [27‐69.5] | [46–80] | [24–72] | ||
| Sex (N) | |||||
| Male | 12 | 18 | 6 | 25 | |
| Female | 9 | 13 | 9 | 7 | |
| Handedness (N) | |||||
| Right | 20 | 27 | 13 | 29 | |
| Left | 1 | 3 | 2 | 3 | |
| Unknown | 0 | 1 | 0 | 0 | |
| HL degree (dB) | 15.0 ± 9.9 a , d , e | 29.7 ± 20.6 a , d , f | 53.3 ± 14.7 c | 51.0 ± 17.5 c | F(3,95) = 25.8* |
Significantly different from HL+TIN− at p ≤ .001 following Bonferroni correction for multiple comparisons.
Significantly different from HL+TIN+ at p < .01 following Bonferroni correction for multiple comparisons.
Significantly different from HL−TIN− and HL−TIN+ at p ≤ .001 following Bonferroni correction for multiple comparisons.
Significantly different from HL+TIN+ at p < .001 following Bonferroni correction for multiple comparisons.
Significantly different from HL−TIN+ at p < .01 following Bonferroni correction for multiple comparisons.
Significantly different from HL−TIN− at p < .01 following Bonferroni correction for multiple comparisons.
p ≤ .001.
2.2. Measures
2.2.1. Hearing loss
Pure tone audiometry was performed under the supervision of a licensed audiologist (J.H.S.) using a Grason Stadler GSI 61 audiometer. Standard clinical procedures were followed to assess pure tone thresholds in all participants. Specifically, participants were assessed using the modified Hughson–Westlake protocol (ANSI, 2004; Jerger, Carhart, Tillman, & Peterson, 1959) at frequencies from 250 to 8,000 Hz. Audiometric thresholds for low (500, 1,000, and 2000 Hz) and high (4,000, 6,000, and 8,000 Hz) frequencies were averaged separately for each ear and the higher of the four averages defined hearing loss degree.
2.2.2. Tinnitus symptoms
The Tinnitus Functional Index (TFI; Meikle et al., 2012) was administered to assess overall severity and functional impact of tinnitus across the domains of intrusiveness, sense of control, cognitive functioning, sleep, auditory symptoms, ability to relax, quality of life, and emotional impact. Participants rate functional impact on a 10‐point Likert scale for each item, and items are subtotaled into the domain scores listed above as well as a total score. TFI data were available for 54 participants from the tinnitus groups. The TFI was not administered to participants in the first half of the study.
2.2.3. Magnetic resonance image acquisition and processing
Structural magnetic resonance images (MRIs) were acquired for coregistration with MEG functional data on a 3‐T Siemens MRI scanner at the UCSF Surbeck Laboratory for Advanced Imaging. T1‐weighted images were spatially normalized to the standard Montreal Neurological Institute template brain using 5‐mm voxels with the SPM software (http://www.fil.ion.ucl.ac.uk/spm/software/). Normalization results were manually verified in all participants for registration accuracy.
2.2.4. MEG image acquisition and processing
MEG data were collected at the UCSF Biomagnetic Imaging Laboratory using a 275‐channel CTF System whole head biomagnetometer (MEG International Services Ltd, Coquitlam, BC, Canada) at a 1,200 Hz sampling rate. Three fiducial coils were placed at the nasion and bilateral periauricular points to localize the head to the sensor array allowing for coregistration to the T1‐weighted MRI and generation of a head shape. During the scan, participants laid in a supine position with their heads in a 1‐in. foam‐padded MEG helmet to minimize head motion and to standardize the distance between the top of the head and the sensor array. Four minutes of continuous recording was collected from each subject while awake with eyes closed and a 60‐s epoch of contiguous stationary segment of data was selected for analysis to minimize the inclusion of motion artifact and other potential artifacts. Previous studies have determined that a 60‐s window provides reliable, consistent power for reconstruction of brain activity from the resting‐state MEG data (Guggisberg et al., 2008; Hinkley, 2010; Hinkley et al., 2011). Artifact‐free segments were selected by using sensor signal amplitudes less than a threshold of 10 pT, and by visually inspecting the sensor data to identify segments without artifacts generated by eyeblinks, saccades, head movements, or muscle contractions.
Following artifact rejection, neural sources were spatiotemporally estimated and entered into a functional connectivity analysis using the Nutmeg software suite (https://www.nitrc.org/projects/nutmeg/). First, MEG sensor data were filtered using a phase‐preserving band‐pass filter (fourth‐order Butterworth, 1–50 Hz bandpass) and reconstructed in source space using a minimum‐variance adaptive beamforming technique (Dalal et al., 2011) similar to the synthetic aperture magnetometry technique (Robinson & Vrba, 1998). This approach derives a time course estimate at each voxel derived through a linear combination of a spatial weighting matrix with the sensor data matrix. Tomographic reconstructions of the data were created using a multisphere head model based on head shape obtained from the structural MRI of each individual subject. A volume of interest (whole brain VOI) for lead‐field computation (1‐cm grid) was automatically generated through a back‐transformation of all the points within a spatially normalized MRI that corresponded to locations within the brain and excluded noncerebral points. The time course generated for each voxel within this VOI (itself an estimate of activity derived from all sensors) was used for functional connectivity analysis.
Imaginary coherence was computed as a reliable metric for functional connectivity with MEG reconstruction (Engel, Gerloff, Hilgetag, & Nolte, 2013;Guggisberg et al., 2008; Martino et al., 2011; Nolte et al., 2004). Imaginary coherence analysis was performed to obtain the most accurate results because it captures only the coherence that cannot be explained by volume spread through exclusion of zero‐ or π‐phase‐lag connectivity (Nolte et al., 2004). Previous studies have demonstrated that this approach reduces overestimation biases of MEG data and is able to sample interactions between source time series, independent of the class of spatial filter used (Guggisberg et al., 2008; Martino et al., 2011; Nolte et al., 2004). A single‐voxel Fisher's Z‐transformed imaginary coherence values between that voxel and all other voxels in the grid were averaged to compute the global functional connectivity at each voxel.
2.3. Imaging data analyses
Theta (4–7 Hz), alpha (8–12 Hz), beta (13–30 Hz), and low gamma (30–50 Hz) frequency bands were subjected to source space reconstruction and functional connectivity analyses by computing global imaginary coherence at each voxel. The whole brain source‐reconstructed imaginary coherence results were then contrasted between groups for each of the identified frequency bands.
Overall tinnitus severity and auditory symptoms (measured by the TFI total and auditory scales, respectively) from each participant in the tinnitus groups were correlated with global connectivity values at each voxel using Pearson's correlation. For all voxel‐wise functional connectivity correlations with TFI scores that survived an uncorrected p < .05, we performed a multiple comparisons correction using a false discovery rate (FDR) set at 5% (Benjamini and Hochberg, 1995) and a 5‐voxel cluster correction. Finally, one participant in the HL+TIN+ group was excluded from correlation analyses between TFI total score and theta connectivity due to outlying imaginary coherence values that were driving otherwise nonsignificant results. Control participants (HL−TIN− and HL+TIN−) were excluded from correlation analyses because low TFI scores with low variability imposed ceiling effects that precluded such correlations. Table 1 illustrates that there were no significant age differences between the HL−TIN+ and HL−TIN− groups or the HL + TIN+ and HL+TIN− groups, respectively.
3. RESULTS
3.1. Global functional connectivity contrasts in tinnitus with and without hearing loss
3.1.1. Theta band contrasts
Whole brain global functional connectivity in the theta band was contrasted between the HL−TIN+ and HL−TIN− groups. A pattern of increased connectivity was identified in the HL−TIN+ group in several brain regions (Figure 1). In the left hemisphere, these regions include the precentral/postcentral gyri and inferior parietal lobule (IPL). The medial cuneus, lingual gyrus, and several cerebellar regions, including the declive, uvula, inferior semilunar lobule, and cerebellar tonsil were also regions of increased connectivity in the HL−TIN+ group. In contrast, a region of decreased connectivity was also identified for the HL−TIN+ group relative to the HL−TIN− group in the left superior frontal gyri (SFG) and middle frontal gyri (MFG). By comparison, contrasts between the HL+TIN+ and HL+TIN− groups identified significantly increased connectivity in the HL+TIN+ group in the right MFG, inferior frontal gyrus (IFG), insula, cingulate, and superior temporal gyrus (STG).
Figure 1.

Whole brain global functional connectivity in the theta band. Images show regions of significant group differences following 5% FDR and 5‐voxel cluster correction. Boxplots below each image illustrate differences across all groups in the voxel with the maximum group differences within each cluster. Groups with normal hearing (HL−) are shaded in dark gray and hearing loss groups (HL+) are shaded in light gray. Global functional connectivity is quantified by the mean imaginary coherence values of each voxel and represented in the boxplots by the black diamond and the median is represented by the white line. FDR, false discovery rate
3.1.2. Alpha band group contrasts
Next, whole brain alpha band global functional connectivity was contrasted between the HL−TIN+ and HL−TIN− groups (Figure 2). A pattern of increased connectivity was again identified in the HL−TIN+ group in several brain regions, including areas in the right inferior semilunar lobule of the cerebellum, the medial superior frontal and cingulate gyri and corpus callosum, and the left caudate, insula, and thalamus. The HL−TIN+ group also demonstrated decreased connectivity compared to the HL−TIN− group in the left SFG/MFG. Contrasts between the HL+TIN+ and the HL+TIN− groups resulted in no significant group differences in alpha band global functional connectivity.
Figure 2.
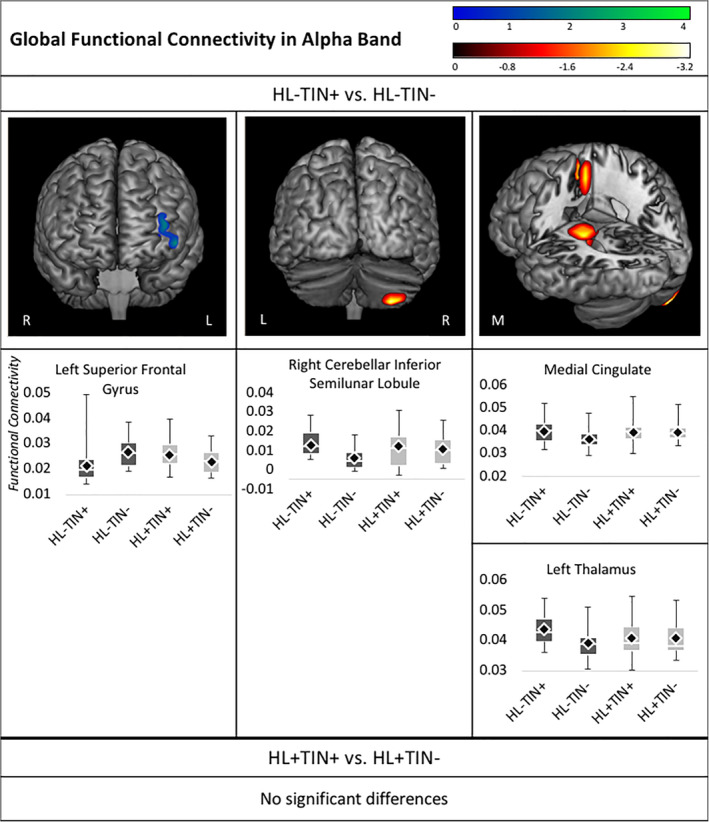
Whole brain contrasts in alpha connectivity. Images depict regions of significant group differences following 5% FDR and 5‐voxel cluster correction. Boxplots below each image illustrate differences across all groups in the voxel with the maximum group differences within each cluster. Groups with normal hearing (HL−) are shaded in dark gray and hearing loss groups (HL+) are shaded in light gray. Mean imaginary coherence values are represented in the boxplots by the black diamond, and the median is represented by the white line. FDR, false discovery rate
3.1.3. Beta band group contrasts
In beta band, global functional connectivity contrasts between the HL−TIN+ and HL−TIN− groups a pattern of decreased connectivity was identified in the HL−TIN+ group in the left SFG, MFG, inferior temporal gyrus (ITG), STG, inferior occipital gyrus (IOG), middle occipital gyrus (MOG), and superior occipital gyrus (Figure 3). In contrast, a pattern of increased connectivity was identified in the HL+TIN+ group when compared to the HL+TIN− only group. Specifically, the HL + TIN+ group demonstrated increased beta connectivity in the left MFG, IFG, precuneus, cuneus, lingual and parahippocampal gyrus, and the right MOG and cuneus.
Figure 3.

Whole brain contrasts in beta connectivity. Images depict regions of significant group differences following 5% FDR and 5‐voxel cluster correction. Boxplots below each image illustrate differences across all groups in the voxel with the maximum group differences within each cluster. Groups with normal hearing (HL−) are shaded in dark gray and hearing loss groups (HL+) are shaded in light gray. Mean imaginary coherence values are represented in the boxplots by the black diamond and the median is represented by the white line. FDR, false discovery rate
3.1.4. Low gamma band group contrasts
Global functional connectivity contrasts in the low gamma (30–50 Hz) frequency band between the HL−TIN+ and HL−TIN− groups showed significant decreased connectivity in the HL−TIN+ group in the left MFG (Figure 4). When the HL+TIN+ group was contrasted with the HL+TIN− group, decreased gamma functional connectivity was identified in the left IPL and Precuneus in the HL+TIN+ group. Table 2 summarizes contrast results across frequency bands.
Figure 4.

Whole brain contrasts in low gamma connectivity. Images depict regions of significant group differences following 5% FDR and 5‐voxel cluster correction. Boxplots below each image illustrate differences across all groups in the voxel with the maximum group differences within each cluster. Groups with normal hearing (HL−) are shaded in dark gray and hearing loss groups (HL+) are shaded in light gray. Mean imaginary coherence values are represented in the boxplots by the black diamond and the median is represented by the white line. FDR, false discovery rate
Table 2.
Contrast results across frequency bands with labels and MNI coordinates for local maxima in regions with statistically significant contrasts following 5% FDR and 5‐voxel cluster corrections
| Contrast result | Frequency band | Region (local maximum voxel) | t |
|---|---|---|---|
| HL−TIN+ > HL−TIN− | Theta | Left precentral/postcentral gyri (−50.0, −25.0, 55.0) | −2.32 |
| Left IPL (−52.2, −28.7, 43.0) | −2.24 | ||
| Medial declive (3.1, −64.0, −18.1) | −2.52 | ||
| Medial uvula (0.0, −65.0, −25.0) | −2.87 | ||
| Medial inferior semilunar lobule (0.3, −68.3, −38.8) | −2.77 | ||
| Medial cerebellar tonsil (−0.3, −63.3, −34.0) | −2.77 | ||
| Medial cuneus (9.3, −80.2, 12.8) | −2.85 | ||
| Medial lingual gyrus (10.0, −75.0, 5.0) | −3.12 | ||
| Alpha | Right inferior semilunar lobule (30.0, −75.0, −65.0) | −3.22 | |
| Medial SFG (7.9, 5.2, 54.1) | −2.28 | ||
| Medial cingulate (10.0, 5.0, 45.0) | −2.72 | ||
| Medial corpus callosum (−9.3, −25.4, 24.7) | −2.66 | ||
| Left caudate (−19.0, −26.8, 21.9) | −2.85 | ||
| Left insula (−30.7, −25.4, 21.9) | −2.58 | ||
| Left thalamus (−20.0, −25.0, 15.0) | −2.88 | ||
| HL−TIN+ < HL−TIN− | Theta | Left SFG (−40.0, 65.0, 25.0) | 4.14 |
| Left MFG (−43.9. 60.8, 5.0) | 3.49 | ||
| Alpha | Left SFG (−40.0, 65.0, 15.0) | 3.95 | |
| Left MFG (−40.0, 65.0, 25.0) | 4.22 | ||
| Beta | Left SFG (−40.0, 65.0, 5.0) | 3.38 | |
| Left MFG (−37.4, 62.5, 0.9) | 3.38 | ||
| Left ITG (−37.4, –6.6, ‐45.3) | 2.34 | ||
| Left STG (−30.3, 9.0, –43.3) | 2.95 | ||
| Left IOG (−20.0, 15.0, –45.0) | 3.14 | ||
| Left MOG (−30.0, –85.0, 25.0) | 2.56 | ||
| Left SOG (−37.4, –84.3, 34.4) | 2.54 | ||
| Gamma | Left MFG (−40.0, 65.0, 25.0) | 3.82 | |
| HL+TIN+ > HL+TIN− | Theta | Right MFG (30.0, 25.0, 5.0) | −3.78 |
| Right IFG (39.0, 15.7, –25.3) | −3.28 | ||
| Right insula (39.0, 12.8, –11.8) | −3.30 | ||
| Right cingulate (21.1, 34.2, 13.6) | −2.75 | ||
| Right STG (40.4, 12.8, –29.2) | −3.28 | ||
| Beta | Left MFG (−39.0, 44.2, –17.3) | −2.72 | |
| Left IFG (−40.0, 35.0, –15.0) | −3.03 | ||
| Left precuneus (−20.0, –65.0, 15.0) | −2.57 | ||
| Left cuneus (−1.3, –102.1, 15.0) | −2.62 | ||
| Left lingual gyrus (−19.7, –67.4, 4.1) | −2.40 | ||
| Left parahippocampal gyrus (−21.1, –53.6, 6.5) | −2.54 | ||
| Right MOG (21.9, –101.4, 15.0) | −2.35 | ||
| Right cuneus (10.0, –105.0, 15.0) | −2.92 | ||
| HL+TIN+ < HL+TIN− | Gamma | Left IPL (−39.7, –64.6, 50.6) | 2.33 |
| Left precuneus (−40.0, –75.0, 55.0) | 2.95 |
Abbreviations: FDR, false discovery rate; IFG, inferior frontal gyrus; IOG, inferior occipital gyrus; IPL, inferior parietal lobule; ITG, inferior temporal gyrus; MFG, middle frontal gyri; MNI, montreal neurological institute; MOG, middle occipital gyrus; SFG, superior frontal gyri; SOG, superior occipital gyrus; STG, superior temporal gyrus.
3.2. Association of global functional connectivity with tinnitus severity
3.2.1. Correlations between tinnitus severity and global functional connectivity in the theta band
In the HL−TIN+ group, TFI total scores were negatively associated with theta connectivity in the right ITG, middle temporal gyrus (MTG), and STG. Functional connectivity in the left precentral/postcentral gyri and the ITG, MTG, STG, and transverse temporal gyrus (TTG) were negatively associated with scores on the auditory scale of the TFI (Figure 5). Tinnitus symptom severity was not significantly associated with theta connectivity in the HL+TIN+ group.
Figure 5.

Whole brain correlations between tinnitus symptoms and theta connectivity. Images depict regions of significant group differences following 5% FDR and 5‐voxel cluster correction. Scatterplots below each image illustrate associations for the voxel with the maximum group correlation within each cluster. FDR, false discovery rate
3.2.2. Alpha correlations
In the HL−TIN+ group, TFI total scores were positively associated with alpha connectivity in the left lentiform nucleus, insula, thalamus, globus pallidus, putamen, claustrum, and the medial SFG. In the HL+TIN+ group, TFI total scores were positively associated with alpha connectivity in the right STG, MTG, uncus, and parahippocampal gyrus. No significant associations were identified between alpha connectivity and TFI auditory scores in either group. Alpha correlations are presented in Figure 6.
Figure 6.

Whole brain correlations between tinnitus symptoms and alpha connectivity. Images depict regions of significant group differences following 5% FDR and 5‐voxel cluster correction. Scatterplots below each image illustrate associations for the voxel with the maximum group correlation within each cluster. FDR, false discovery rate
3.2.3. Beta correlations
In the HL−TIN+ group, a pattern of negative associations was identified between beta coherence and tinnitus symptoms. Specifically, total scores on the TFI were negatively associated with beta connectivity in the right ITG, MTG, STG, precentral and postcentral gyri, inferior and superior parietal lobules, precuneus, cuneus, insula, uncus, ITG, MTG, parahippocampal gyrus, lentiform nucleus, pons, culmen, medulla, cerebellar tonsil, and MOG. The posterior temporal/occipital region of this cluster of findings appears to be specific to auditory symptoms of tinnitus, as a negative correlation was identified between the auditory scale of the TFI and beta coherence in the right MTG, MOG, IOG, and declive. The TFI auditory scale was also negatively correlated with beta coherence in the left IFG, STG, MTG, ITG, precentral and postcentral gyri, and the IPL.
In the HL+TIN+ group TFI total scores were negatively associated with beta connectivity in the right cuneus, lingual gyrus, midbrain, lentiform nucleus, insula, uncus, parahippocampal gyrus, and thalamus. No significant associations were identified between beta connectivity and the TFI auditory scale in the HL+TIN+ group. These correlations are presented in Figure 7.
Figure 7.

Whole brain correlations between tinnitus symptoms and beta connectivity. Images depict regions of significant group differences following 5% FDR and 5‐voxel cluster correction. Scatterplots below each image illustrate associations for the voxel with the maximum group correlation within each cluster
3.2.4. Low gamma correlations
The TFI auditory scale was negatively associated with gamma coherence in the left IFG and precentral gyrus for the HL−TIN+ group. No significant associations were identified between TFI total scores and low gamma connectivity in the HL−TIN+ group.
In the HL+TIN+ group, the TFI total score was negatively associated with gamma connectivity in the right IPL. The TFI auditory scale was negatively associated with gamma coherence in the left MFG and SFG, and the right MOG, fusiform gyrus, tuber, inferior semilunar lobule, pyramis, and the medial precuneus (Table 3). These associations are presented in Figure 8.
Table 3.
Functional connectivity correlations with tinnitus symptoms across frequency bands with labels and MNI coordinates for local maxima in regions with statistically significant correlations following 5% FDR and 5‐voxel cluster corrections
| Group | Frequency band | Symptom measure | +/− association | Region (local maximum voxel) | r |
|---|---|---|---|---|---|
| HL−TIN+ | Theta | TFI total | − | Right ITG (65.1, −55.0, −9.2) | −0.64 |
| Right MTG (70.0, −55.0, 5.0) | −0.70 | ||||
| Right STG (69.4, –52.6, 11.6) | −0.56 | ||||
| TFI auditory | − | Left precentral/postcentral gyri (−70.0, –7.3, 20.0) | −0.56 | ||
| Left ITG (−67.4, –13.5, −23.7) | −0.57 | ||||
| Left MTG (−70.0, 25.0, 15.0) | −0.69 | ||||
| Left STG (−66.0, –5.9, −4.6) | −0.55 | ||||
| Left TTG (−67.4, –5.9, 9.7) | −0.55 | ||||
| Alpha | TFI total | + | Left lentiform nucleus (−28.7, –12.8, 10.8) | 0.58 | |
| Left insula (−30.0, –5.0, 15.0) | 0.63 | ||||
| Left thalamus (−17.5, –14.8, 1.3) | 0.55 | ||||
| Left globus pallidus (−17.5, –4.0, −6.0) | 0.56 | ||||
| Left putamen (−27.9, –12.8, 2.1) | 0.59 | ||||
| Left claustrum (−35.9, –12.4, 6.0) | 0.55 | ||||
| Medial SFG (0.0, 45.0, 25.0) | 0.62 | ||||
| Beta | TFI total | − | Right ITG (53.0, –13.5, −25.2) | −0.59 | |
| Right MTG (50.0, –85.0, 25.0) | −0.61 | ||||
| Right STG (70.0, 15.0, 5.0) | −0.74 | ||||
| Right precentral/postcentral gyri (50.0, 5.0, 65.0) | −0.72 | ||||
| Right IPL (41.7, –33.9, 62.0) | −0.62 | ||||
| Right SPL (32.6, –55.8, 61.2) | −0.65 | ||||
| Right precuneus (22.7, –77.2, 53.2) | −0.64 | ||||
| Right cuneus (26.5, –84.5, 13.6) | −0.58 | ||||
| Right insula (46.2, 2.4, –5.4) | −0.55 | ||||
| Right uncus (37.9, –19.5, −34.8) | −0.63 | ||||
| Right ITG (43.9, –14.3, −36.2) | −0.63 | ||||
| Right MTG (68.2, –16.5, −15.0) | −0.57 | ||||
| Right parahippocampal g. (30.3, –17.3, −31.8) | −0.67 | ||||
| Right lentiform nucleus (29.5, –15.8, −5.4) | −0.55 | ||||
| Right pons (17.4, –44.5, −34.0) | −0.66 | ||||
| Right culmen (12.9, –45.0, −25.2) | −0.65 | ||||
| Right medulla (9.8, –45.0, −44.3) | −0.60 | ||||
| Right cerebellar tonsil (30.0, –25.0, −35.0) | −0.71 | ||||
| Right MOG (34.1, –85.3, 12.9) | −0.58 | ||||
| TFI auditory | − | Right MTG (50.0, –65.0, 15.0) | −0.56 | ||
| Right MOG (40.0, –75.0, 5.0) | −0.62 | ||||
| Right IOG (41.8, –73.6, −3.8) | −0.57 | ||||
| Right Declive (40.0, –75.0, –15.0) | −0.57 | ||||
| Left IFG (−65.3, 24.4, 8.1) | −0.55 | ||||
| Left STG (−66.0, –12.1, 2.5) | −0.55 | ||||
| Left MTG (−70.0, 25.0, 15.0) | −0.71 | ||||
| Left ITG (−65.3, –14.2, −18.9) | −0.56 | ||||
| Left precentral/postcentral gyri (−66.7, –19.2, 35.9) | −0.62 | ||||
| Left IPL (−66.0, –27.3, 40.6) | −0.63 | ||||
| Gamma | TFI auditory | − | Left IFG (−66.3, 12.2, 22.4) | −0.63 | |
| Left precentral gyrus (−70.0, 15.0, 35.0) | −0.69 | ||||
| HL+TIN+ | Theta | TFI total | + | Right/medial IOG (0.0, –85.0, 25.0) | 0.58 |
| Right/medial lingual gyrus (21.0, –86.4, 2.5) | 0.55 | ||||
| Right/medial declive (21.0, –81.6, −9.4) | 0.54 | ||||
| Left SFG (−10.0, 45.0, 25.0) | 0.52 | ||||
| Left MFG (−10.0, –5.0, 55.0) | 0.51 | ||||
| Left cingulate (−17.1, –25.2, 34.3) | 0.46 | ||||
| Alpha | TFI total | + | Right STG (50.0, 5.0, –25.0) | 0.51 | |
| Right MTG (49.6, 3.0, –38.0) | 0.50 | ||||
| Right uncus (29.8, 1.4, –37.2) | 0.49 | ||||
| Right parahippocampal g. (21.8, 4.3, –22.9) | 0.49 | ||||
| Beta | TFI total | − | Right cuneus (10.0, –75.0, 15.0) | −0.52 | |
| Right lingual (gyrus 19.4, –75.2, 4.9) | −0.50 | ||||
| Right midbrain (10.0, –5.0, −15.0) | −0.59 | ||||
| Right lentiform nucleus (30.6, –4.9, 9.7) | −0.52 | ||||
| Right insula (41.7, –6.5, −6.2) | −0.46 | ||||
| Right uncus (17.9, –5.3, −25.3) | −0.49 | ||||
| Right parahippocampal g. (27.4, –4.5, −16.5) | −0.52 | ||||
| Right thalamus (15.5, –5.3, 4.9) | −0.50 | ||||
| Gamma | TFI total | − | Right IPL (30.0, –45.0, 25.0) | −0.55 | |
| TFI auditory | − | Left MFG (−39.1, 44.6, 30.5) | −0.56 | ||
| Left SFG (−40.0, 45.0, 25.0) | −0.57 | ||||
| Medial precuneus (0.0, –65.0, 45.0) | −0.55 | ||||
| Right MOG (52.6, –63.9, −3.3) | −0.50 | ||||
| Right fusiform gyrus (49.4, –75.4, −12.0) | −0.48 | ||||
| Right tuber (50.0, –85.0, −25.0) | −0.56 | ||||
| Right inf. Semilunar lob. (52.6, –76.6, −38.4) | −0.46 | ||||
| Right pyramis (49.4, –76.6, −34.8) | −0.46 |
Abbreviations: FDR, false discovery rate; IFG, inferior frontal gyrus; IOG, inferior occipital gyrus; IPL, inferior parietal lobule; ITG, inferior temporal gyrus; MFG, middle frontal gyri; MNI, montral neurological institute; MOG, middle occipital gyrus; SFG, superior frontal gyri; STG, superior temporal gyrus.
Figure 8.

Whole brain correlations between tinnitus symptoms and low gamma (30‐50 Hz) connectivity. Images depict regions of significant group differences following 5% FDR and 5‐voxel cluster correction. Scatterplots below each image illustrate associations for the voxel with the maximum group correlation within each cluster
4. DISCUSSION
This study examined differences in resting‐state global functional connectivity for tinnitus groups with and without hearing loss. First, one common finding in the tinnitus group without hearing loss (HL−TIN+) across all four frequency bands (theta, alpha, beta, and low gamma) was decreased connectivity in the left anterior frontal cortex. Connectivity in this region was also positively correlated with TFI total scores in the alpha band. Taken together, the generally decreased connectivity in this region, which was associated with decreased tinnitus severity in the alpha band, may suggest that reduction in left anterior MFG connectivity is a compensatory mechanism in response to bothersome chronic tinnitus in those with intact hearing. A prior study on tinnitus without hearing loss using resting‐state functional Magnetic Resonance Imaging demonstrated that functional connectivity between the left MFG and ipsilateral anterior insula was positively correlated with scores on the Tinnitus Handicap Questionnaire (Chen et al., 2015). The authors interpreted this finding as potentially indicative of an adaptive response intended to decrease tinnitus perceptual salience or awareness. Second, a general pattern of increased connectivity in theta and alpha and decreased connectivity in beta for the HL−TIN+ was found compared to the HL−TIN− group. It is unclear whether this pattern is reflective of underlying pathology or of response to a certain symptom domain (e.g., increase in inhibitory theta and alpha activity to suppress phantom auditory awareness or its neuropsychological sequelae).
Results of this study provide support for a striatal gating model of tinnitus (Larson & Cheung, 2012, 2013), which posits that dysfunctional connectivity between the striatum and auditory cortex results in perceptual awareness of auditory phantoms. In the theta band, increased global connectivity in striatal regions and the STG was identified in HL+TIN+ compared to HL+TIN−. Likewise, in the alpha band, increased global connectivity in striatal regions was identified in HL−TIN+ compared to HL−TIN−. More direct support for a striatal gating model using a basal ganglia‐seeded connectivity approach (Hinkley, Mizuiri, Hong, Nagarajan, & Cheung, 2015) was not feasible due to the reduced sensitivity of MEG imaging to activity from subcortical and cerebellar structures. Despite this imaging modality‐specific constraint, the identified positive correlation of alpha band global striatal connectivity with tinnitus severity on TFI for the HL−TIN+ group nonetheless implicate striatal dysfunction in chronic tinnitus.
Several other theories have been proposed to account for the fundamental mechanisms of tinnitus, many of which are centered on the idea that deafferentation associated with hearing loss and/or a noise‐canceling deficit lead to a series of neural changes that result in the experience of tinnitus via thalamocortical dysrhythmia (TCD). The TCD model suggests that disrupted activity between the thalamus and cortical regions results in inhibition of thalamic neurons. This inhibition results in increased low‐frequency oscillatory activity in a localized region which disinhibits gamma activity in surrounding regions (De Ridder et al., 2015; Llinas et al., 1999; Llinás, Urbano, Leznik, Ramírez, & Van Marle, 2005). In a review of electrophysiological findings in tinnitus, Adjamian (2014) highlighted several findings that conflict with this model, however, and the present study is among these, as results of this study mainly reflect increases in alpha and decreases in gamma connectivity. Results from the present study also identified associations between greater tinnitus severity and reduced connectivity in auditory cortex, which fails to support theories of cortical auditory hyperactivity as a mechanism for tinnitus (Eggermont, 2012). In contrast, the present results suggest disengagement of auditory cortex.
The results of the present study highlight differences in network expression of tinnitus with (HL+TIN+ vs. HL+TIN−) and without (HL−TIN+ vs. HL−TIN−) hearing loss. Across all frequency bands, significant differences were identified between tinnitus with and without hearing loss. Together these findings suggest that tinnitus with hearing loss may be driven by different underlying processes than tinnitus without hearing loss.
4.1. Relation of findings to clinical symptoms
Imaginary coherence results were both positively and negatively associated with tinnitus symptoms across all frequency bands in multiple brain regions. Of all the correlation results, the most consistent finding was a negative association for the HL−TIN+ group between the auditory scale of the TFI and theta, beta, and gamma connectivity in the left precentral/postcentral gyri, which, for theta and beta, extended to include a left temporal cluster. Notably, alpha connectivity was not associated with ratings on the auditory scale of the TFI in either group.
With the exception of the alpha band, for which positive associations were identified between functional connectivity and tinnitus severity, associations with nonauditory symptom areas were negative and tended to be more diversely clustered across frequencies in both tinnitus groups. Specifically, in the theta band, a negative association was identified between connectivity in right posterior temporal regions and TFI total score for the HL−TIN+ group. Beta connectivity was also negatively associated with tinnitus symptoms in the HL−TIN+ group in right anterior temporal, parietal, occipital, cerebellar, and subcortical regions. TFI total scores were not significantly associated with gamma connectivity in the HL−TIN+ group.
In the HL+TIN+ group, negative associations between TFI total scores and beta connectivity were identified in left occipital and subcortical areas, whereas the right IPL was implicated in gamma connectivity correlations. Many of the nonauditory symptoms of tinnitus captured on the TFI total scale were associated with beta connectivity in posterior and subcortical regions for those with tinnitus with and without hearing loss. This may suggest that the secondary effects of tinnitus may manifest via similar processes controlled by beta connectivity whereas associations with auditory symptoms of tinnitus appear to result from divergent underlying primary pathology for each group.
4.2. Limitations and future directions
Several limitations of this study must be acknowledged. First, there were sex differences between groups. Future studies are needed to investigate the effects of sex on resting state functional connectivity and tinnitus symptoms. Second, the impact of low‐ versus high‐frequency hearing loss, cognitive function, and emotional symptoms were not systematically assessed. Future research would be enhanced by controlling for pattern of hearing loss and incorporating cognitive and emotional (e.g., depression, anxiety associated with posttraumatic stress disorder, etc.) assessment measures. Doing so for the latter conditions would provide a richer understanding of interactions among tinnitus, cognition, and emotional symptoms on resting state brain activity. It has already been demonstrated that common psychological comorbidities of tinnitus may have their own effects on brain function, making them difficult to isolate from the direct effects of the tinnitus itself (Vanneste, Joos, Langguth, To, & De Ridder, 2014).
We also recognize that MEG has reduced sensitivity to subcortical and cerebellar structures, impacting ability to test specific models of tinnitus using a seeded connectivity approach. We elected to use a data‐driven approach focused on global functional connectivity, where the average connectivity of a particular voxel with all other voxels in the brain is computed. While this analytic approach is fruitful, future studies with much larger sample sizes to overcome the challenge of reduced sensitivity to subcortical structures could enable seeded connectivity analyses that may reveal even more meaningful information regarding functional pathology in tinnitus.
Furthermore, the choice of imaginary coherence may have a particular shortcoming. Methodological studies have demonstrated that the imaginary coherence metric is less reliable than amplitude envelope correlation (AEC) (Colclough et al., 2016); however, AEC is a marker of covarying modulation of power rather than neural synchrony as captured by imaginary coherence, which is still a reasonable metric in terms of reliability. Prior work has demonstrated that while both may be relevant to disease process, spectral power, and connectivity provide complementary rather than redundant information (Ranasinghe et al., 2017), and thus reliability metrics are not directly comparable. Future studies can explore whether AEC and other quantitative metrics of functional connectivity would add to our knowledge of functional pathology in tinnitus.
5. CONCLUSIONS
Taken together these results support the hypothesis that there may be divergent underlying pathology in tinnitus that develops with versus without hearing loss. This support is evident in both the group contrast results and the associations with auditory symptoms. In contrast, secondary, nonauditory symptoms of tinnitus may show some overlapping pathology in beta connectivity for those with and without hearing loss.
Support for the striatal gating model was identified in both tinnitus groups (with and without hearing loss), highlighting the versatility of this model in understanding different forms of tinnitus and potentially its isolation of core tinnitus pathology (as opposed to effects of secondary hearing loss). These findings emphasize the necessity of personalized treatment of tinnitus with and without hearing loss in future research.
CONFLICT OF INTEREST
The authors declare no potential conflict of interest.
ACKNOWLEDGMENTS
C.D. was funded in part by National Institutes of Health grants (K23DC016637‐01A1 and U01DC013029). S.W.C. and S.S.N. were funded by the U.S. Department of Defense grants W81XWH1310494 and W81XWH1810741 and National Institutes of Health grant U01DC013029.
Demopoulos C, Duong X, Hinkley LB, et al. Global resting‐state functional connectivity of neural oscillations in tinnitus with and without hearing loss. Hum Brain Mapp. 2020;41:2846–2861. 10.1002/hbm.24981
Funding information National Institute on Deafness and Other Communication Disorders, Grant/Award Numbers: K23DC016637‐01A1, U01DC013029; U.S. Department of Defense, Grant/Award Numbers: W81XWH1310494, W81XWH1810741
DATA AVAILABILITY STATEMENT
The data that support the findings of this study are available from the corresponding author upon reasonable request.
REFERENCES
- Acoustical Society of America (ANSI) . (2004). American National Standards on acoustics. Melville, NY: Author. [Google Scholar]
- Adamchic, I. , Hauptmann, C. , & Tass, P. A. (2012). Changes of oscillatory activity in pitch processing network and related tinnitus relief induced by acoustic CR neuromodulation. Frontiers in Systems Neuroscience, 6, 1–11. 10.3389/fnsys.2012.00018 [DOI] [PMC free article] [PubMed] [Google Scholar]
- Adamchic, I. , Toth, T. , Hauptmann, C. , Walger, M. , Langguth, B. , Klingmann, I. , & Tass, P. A. (2017). Acute effects and after‐effects of acoustic coordinated reset neuromodulation in patients with chronic subjective tinnitus. NeuroImage: Clinical, 15, 541–558. 10.1016/j.nicl.2017.05.017 [DOI] [PMC free article] [PubMed] [Google Scholar]
- Adjamian, P. (2014). The application of electro‐ and magneto‐encephalography in tinnitus research‐methods and interpretations. Frontiers in Neurology, 5, 1–24. 10.3389/fneur.2014.00228 [DOI] [PMC free article] [PubMed] [Google Scholar]
- Benjamini, Y. & Hochberg, Y. (1995). Controlling the false discovery rate: A practical and powerful approach to multiple testing. Journal of the Royal Statistical Society, 57, 289–300. [Google Scholar]
- Chen, Y. C. , Zhang, J. , Li, X. W. , Xia, W. , Feng, X. , Qian, C. , … Teng, G. J. (2015). Altered Intra‐ and Interregional Synchronization in Resting‐State Cerebral Networks Associated with Chronic Tinnitus. Neural Plasticity, 2015, 2015–2011. 10.1155/2015/475382 [DOI] [PMC free article] [PubMed] [Google Scholar]
- Colclough, G. L. , Woolrich, M. W. , Tewarie, P. K. , Brookes, M. J. , Quinn, A. J. , & Smith, S. M. (2016). NeuroImage how reliable are MEG resting‐state connectivity metrics ? NeuroImage, 138, 284–293. 10.1016/j.neuroimage.2016.05.070 [DOI] [PMC free article] [PubMed] [Google Scholar]
- Dalal, S. S. , Zumer, J. M. , Guggisberg, A. G. , Trumpis, M. , Wong, D. D. E. , Sekihara, K. , & Nagarajan, S. S. (2011). MEG/EEG source reconstruction, statistical evaluation, and visualization with NUTMEG. Computational Intelligence and Neuroscience, 2011, 1–17. 10.1155/2011/758973 [DOI] [PMC free article] [PubMed] [Google Scholar]
- De Ridder, D. , Joos, K. , & Vanneste, S. (2016). Anterior cingulate implants for tinnitus: Report of 2 cases. Journal of Neurosurgery, 124(4), 893–901. 10.3171/2015.3.JNS142880 [DOI] [PubMed] [Google Scholar]
- De Ridder, D. , Song, J. J. , & Vanneste, S. (2013). Frontal cortex TMS for tinnitus. Brain Stimulation, 6(3), 355–362. 10.1016/j.brs.2012.07.002 [DOI] [PubMed] [Google Scholar]
- De Ridder, D. , & Vanneste, S. (2012). EEG driven tDCS versus bifrontal tDCS for tinnitus. Frontiers in Psychiatry, 3, 1–7. 10.3389/fpsyt.2012.00084 [DOI] [PMC free article] [PubMed] [Google Scholar]
- De Ridder, D. , Vanneste, S. , Langguth, B. , & Llinas, R. (2015). Thalamocortical dysrhythmia: A theoretical update in tinnitus. Frontiers in Neurology, 6, 1–13. 10.3389/fneur.2015.00124 [DOI] [PMC free article] [PubMed] [Google Scholar]
- De Ridder, D. , Vanneste, S. , Weisz, N. , Londero, A. , Schlee, W. , Elgoyhen, A. B. , & Langguth, B. (2014). An integrative model of auditory phantom perception: Tinnitus as a unified percept of interacting separable subnetworks. Neuroscience and Biobehavioral Reviews, 44, 16–32. 10.1016/j.neubiorev.2013.03.021 [DOI] [PubMed] [Google Scholar]
- Eggermont, J. J. (2012). The neuroscience of tinnitus: Understanding abnormal and normal auditory perception. Frontiers in Systems Neuroscience, 6, 1–4. 10.3389/fnsys.2012.00053 [DOI] [PMC free article] [PubMed] [Google Scholar]
- Eggermont, J. J. , & Tass, P. A. (2015). Maladaptive neural synchrony in tinnitus: Origin and restoration. Frontiers in Neurology, 6, 1–17. 10.3389/fneur.2015.00029 [DOI] [PMC free article] [PubMed] [Google Scholar]
- Engel, A. K. , Gerloff, C. , Hilgetag, C. C. , & Nolte, G. (2013). Intrinsic coupling modes: Multiscale interactions in ongoing brain activity. Neuron, 80(4), 867–886. 10.1016/j.neuron.2013.09.038 [DOI] [PubMed] [Google Scholar]
- Georgiewa, P. , Klapp, B. F. , Fischer, F. , Reisshauer, A. , Juckel, G. , Frommer, J. , & Mazurek, B. (2006). An integrative model of developing tinnitus based on recent neurobiological findings. Medical Hypotheses, 66(3), 592–600. 10.1016/j.mehy.2005.08.050 [DOI] [PubMed] [Google Scholar]
- Guggisberg, A. G. , Honma, S. M. , Findlay, A. M. , Dalal, S. S. , Kirsch, H. E. , Berger, M. S. , & Nagarajan, S. S. (2008). Mapping functional connectivity in patients with brain lesions. Annals of Neurology, 63(2), 193–203. 10.1002/ana.21224 [DOI] [PMC free article] [PubMed] [Google Scholar]
- Hartmann, T. , Lorenz, I. , Müller, N. , Langguth, B. , & Weisz, N. (2014). The effects of neurofeedback on oscillatory processes related to tinnitus. Brain Topography, 27(1), 149–157. 10.1007/s10548-013-0295-9 [DOI] [PubMed] [Google Scholar]
- Hinkley, L. (2010). Cognitive impairments in schizophrenia as assessed through activation and connectivity measures of magnetoencephalography (MEG) data. Frontiers in Human Neuroscience, 3 10.3389/neuro.09.073.2009 [DOI] [PMC free article] [PubMed] [Google Scholar]
- Hinkley, L. , Vinogradov, S. , Guggisberg, A. G. , Fisher, M. , Findlay, A. M. , & Nagarajan, S. S. (2011). Clinical symptoms and alpha band resting‐state functional connectivity imaging in patients with schizophrenia: Implications for novel approaches to treatment. Biological Psychiatry, 70(12), 1134–1142. 10.1016/j.biopsych.2011.06.029 [DOI] [PMC free article] [PubMed] [Google Scholar]
- Hinkley, L. B. , Mizuiri, D. , Hong, O. , Nagarajan, S. S. , & Cheung, S. W. (2015). Increased striatal functional connectivity with auditory cortex in tinnitus. Frontiers in Human Neuroscience, 9, 1–10. 10.3389/fnhum.2015.00568 [DOI] [PMC free article] [PubMed] [Google Scholar]
- Jerger, J. , Carhart, R. , Tillman, T. , & Peterson, J. (1959). Some relations between normal hearing for pure tones and for speech. Journal of Speech and Hearing Research, 2(2), 126–140. [DOI] [PubMed] [Google Scholar]
- Kraus, K. S. , & Canlon, B. (2012). Neuronal connectivity and interactions between the auditory and limbic systems. Effects of noise and tinnitus. Hearing Research, 288(1–2), 34–46. 10.1016/j.heares.2012.02.009 [DOI] [PubMed] [Google Scholar]
- Langguth, B. , Kreuzer, P. M. , Kleinjung, T. , & De Ridder, D. (2013). Tinnitus: Causes and clinical management. The Lancet Neurology, 12(9), 920–930. 10.1016/S1474-4422(13)70160-1 [DOI] [PubMed] [Google Scholar]
- Larson, P. S. , & Cheung, S. W. (2012). Deep brain stimulation in area LC controllably triggers auditory phantom percepts. Neurosurgery, 70(2), 398–405. 10.1227/NEU.0b013e3182320ab5 [DOI] [PubMed] [Google Scholar]
- Larson, P. S. , & Cheung, S. W. (2013). A stroke of silence: Tinnitus suppression following placement of a deep brain stimulation electrode with infarction in area LC. Journal of Neurosurgery, 118, 192–194. [DOI] [PubMed] [Google Scholar]
- Levine, R. A. , & Oron, Y. (2015). Tinnitus. Handbook of Clinical Neurology, 129, 409–431. 10.1016/B978-0-444-62630-1.00023-8 [DOI] [PubMed] [Google Scholar]
- Llinás, R. , Urbano, F. J. , Leznik, E. , Ramírez, R. R. , & Van Marle, H. J. F. (2005). Rhythmic and dysrhythmic thalamocortical dynamics: GABA systems and the edge effect. Trends in Neurosciences, 28, 325–333. 10.1016/j.tins.2005.04.006 [DOI] [PubMed] [Google Scholar]
- Llinas, R. R. , Ribary, U. , Jeanmonod, D. , Kronberg, E. , & Mitra, P. P. (1999). Thalamocortical dysrhythmia: A neurological and neuropsychiatric syndrome characterized by magnetoencephalography. Proceedings of the National Academy of Sciences, 96(26), 15222–15227. 10.1073/pnas.96.26.15222 [DOI] [PMC free article] [PubMed] [Google Scholar]
- Martino, J. , Honma, S. M. , Findlay, A. M. , Guggisberg, A. G. , Owen, J. P. , Kirsch, H. E. , … Nagarajan, S. S. (2011). Resting functional connectivity in patients with brain tumors in eloquent areas. Annals of Neurology, 69(3), 521–532. 10.1002/ana.22167 [DOI] [PMC free article] [PubMed] [Google Scholar]
- Meikle, M. B. , Henry, J. A. , Griest, S. E. , Stewart, B. J. , Abrams, H. B. , McArdle, R. , … Vernon, J. A. (2012). The Tinnitus Functional Index: Development of a new clinical measure for chronic, intrusive tinnitus. Ear & Hearing, 33(2), 153–176. 10.1097/AUD.0b013e31822f67c0 [DOI] [PubMed] [Google Scholar]
- Newall, P. , Mitchell, P. , Sindhusake, D. , Golding, M. , Wigney, D. , Hartley, D. , … Birtles, G. (2001). Tinnitus in older people: It is a widespread problem. Hearing Journal, 54(11), 14. [Google Scholar]
- Nolte, G. , Bai, O. , Wheaton, L. , Mari, Z. , Vorbach, S. , & Hallett, M. (2004). Identifying true brain interaction from EEG data using the imaginary part of coherency. Clinical Neurophysiology, 115(10), 2292–2307. 10.1016/j.clinph.2004.04.029 [DOI] [PubMed] [Google Scholar]
- Papanicolaou, A. C. (2009). Clinical magnetoencephalography and magnetic source imaging. New York, NY: Cambridge University Press. [Google Scholar]
- Ranasinghe, K. G. , Hinkley, L. B. , Beagle, A. J. , Mizuiri, D. , Honma, S. M. , Welch, A. E. , … Nagarajan, S. S. (2017). Distinct spatiotemporal patterns of neuronal functional connectivity in primary progressive aphasia variants. Brain, 140, 2737–2751. 10.1093/brain/awx217 [DOI] [PMC free article] [PubMed] [Google Scholar]
- Rauschecker, J. P. , Leaver, A. M. , & Mu, M. (2010). Tuning out the noise: Limbic‐auditory interactions in tinnitus. Neuron, 66, 819–826. 10.1016/j.neuron.2010.04.032 [DOI] [PMC free article] [PubMed] [Google Scholar]
- Robinson, S. , & Vrba, J. , (1998). Functional neuroimaging by synthetic aperture magnetometry (SAM). In Yoshimoto T., Kotani M., Kuriki S., Karibe H. and Nakasato N. (Eds.), Recent Advances in Biomagnetism (pp. 302–305). Sendai, Japan: Tokyo University Press. [Google Scholar]
- Schlee, W. , Hartmann, T. , Langguth, B. , & Weisz, N. (2009). Abnormal resting‐state cortical coupling in chronic tinnitus. BMC Neuroscience, 10, 11 10.1186/1471-2202-10-11 [DOI] [PMC free article] [PubMed] [Google Scholar]
- Schlee, W. , Mueller, N. , Hartmann, T. , Keil, J. , Lorenz, I. , & Weisz, N. (2009). Mapping cortical hubs in tinnitus. BMC Biology, 7, 80 10.1186/1741-7007-7-80 [DOI] [PMC free article] [PubMed] [Google Scholar]
- Schlee, W. , Weisz, N. , Bertrand, O. , Hartmann, T. , & Elbert, T. (2008). Using auditory steady state responses to outline the functional connectivity in the tinnitus brain. PLoS One, 3(11), e3720. 10.1371/journal.pone.0003720 [DOI] [PMC free article] [PubMed] [Google Scholar]
- Silchenko, A. N. , Adamchic, I. , Hauptmann, C. , & Tass, P. A. (2013). Impact of acoustic coordinated reset neuromodulation on effective connectivity in a neural network of phantom sound. NeuroImage, 77, 133–147. 10.1016/j.neuroimage.2013.03.013 [DOI] [PubMed] [Google Scholar]
- Vanneste, S. , Joos, K. , Langguth, B. , To, W. T. , & De Ridder, D. (2014). Neuronal correlates of maladaptive coping: An EEG‐study in tinnitus patients. PLoS One, 9(2), 1–15. 10.1371/journal.pone.0088253 [DOI] [PMC free article] [PubMed] [Google Scholar]
- Weisz, N. , Lüchinger, C. , Thut, G. , & Müller, N. (2014). Effects of individual alpha rTMS applied to the auditory cortex and its implications for the treatment of chronic tinnitus. Human Brain Mapping, 35(1), 14–29. 10.1002/hbm.22152 [DOI] [PMC free article] [PubMed] [Google Scholar]
- Zobay, O. , Palmer, A. R. , Hall, D. A. , Sereda, M. , & Adjamian, P. (2015). Source space estimation of oscillatory power and brain connectivity in tinnitus. PLoS One, 10(3), 1–24. 10.1371/journal.pone.0120123 [DOI] [PMC free article] [PubMed] [Google Scholar]
Associated Data
This section collects any data citations, data availability statements, or supplementary materials included in this article.
Data Availability Statement
The data that support the findings of this study are available from the corresponding author upon reasonable request.