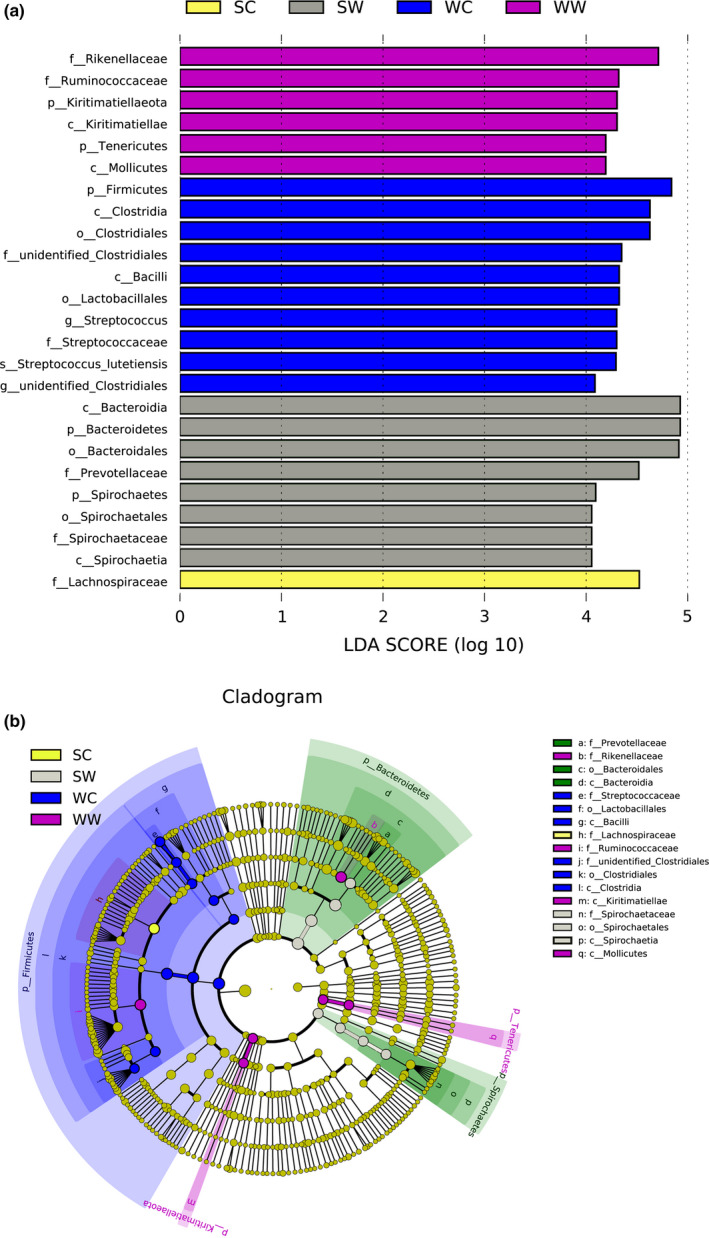
Figure 4.

Results of LEfSe analysis. The histogram shows species whose LAD Score exceeded the default value of 4. The length of the histogram represents the impact of the different species. The species without significant difference are marked in yellow, and different species have the same color as the group in the evolutionary branch diagram. SC, summer captive group; SW, summer wild group; WC, winter captive group; WW, winter wild group
