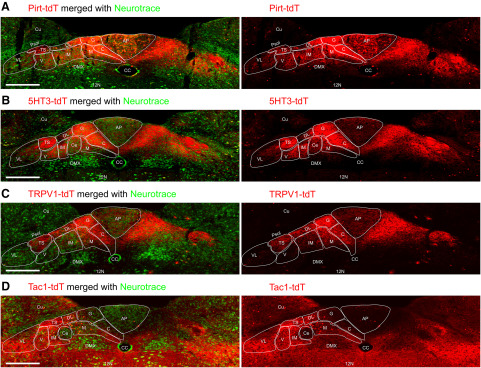
Figure 13.
tdTomato expression in nTS subnuclei. A, Pirt-tdT at −330 μm (relative to obex). B, 5-HT3-tdT at −300 μm. C, TRPV1-tdT at −360 μm. D, Tac1-tdT at −330 μm. Left, Native tdTomato expression (red) merged with neurotrace labeling of intrinsic neurons (green). Right, tdTomato expression alone. The following structures are identified: area postrema (AP), central canal (CC), cuneate nucleus (Cu), DMX, 12N, parasolitary nucleus (Psol), SolC (C), SolCe (Ce), SolDL (DL), SolG (G), SolIM (IM), SolM (M), SolV (V), SolVL (VL), and TS. Scale bar, 300 μm.

