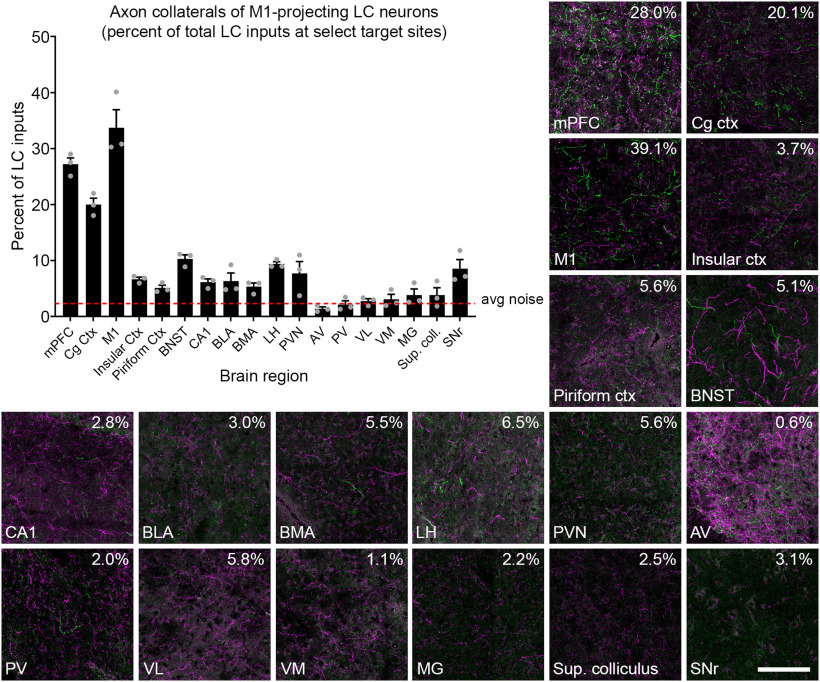
Figure 5.
Distribution of axon collaterals from LC neurons projecting to motor cortex. Representative fluorescent images show Cre+ (EGFP-labeled, green) and Cre-negative (tdTomato-labeled, magenta) axons in select forebrain and midbrain regions of a TrAC-LC mouse injected with CAV2-Cre in M1. Numbers in the upper right corner of each image indicate the percent of LC-NE axons in the image that are EGFP+. The bar graph (n = 3 mice) indicates the percentage of LC-NE axons at each target region that originate from EGFP+ M1-projecting LC-NE neurons (are mean ± SEM). The dotted line represents the noise in the green channel (average green pixel count in areas qualitatively lacking EGFP-labeled axons, divided by average total pixel count). Percentages below the dotted line are indistinguishable from noise. The scale bar for fluorescent images indicates 100 μm, and each image represents 13% of the volume quantified in the bar graph.

