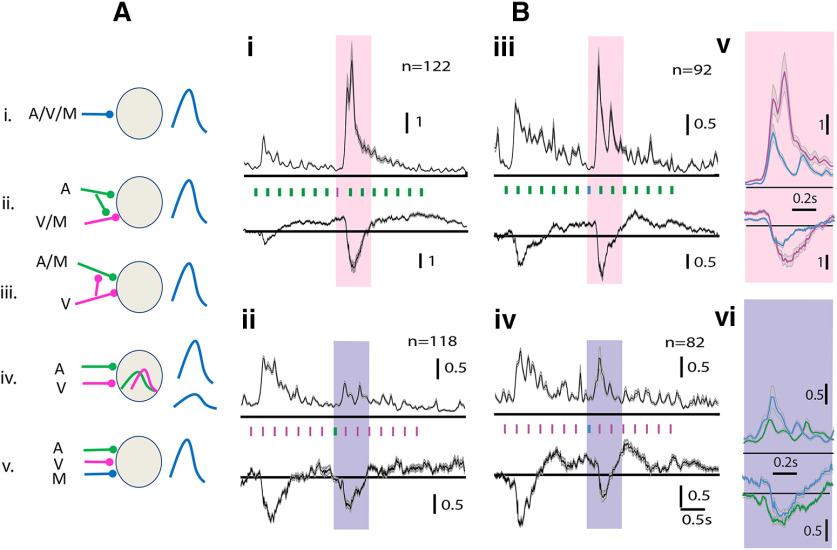
Figure 6.
Multisensory oddball stimulation shows the presence of separate A, V, and M inputs to the OFC. Ai–v, Possible models of synaptic inputs on a single OFC neuron. Bi–vi, Multisensory oddball responses in mean normalized population PSTHs (and LFPs, below) are shown with (i) standard = A and deviant = V, (ii) standard = V and deviant = A, (iii) standard = A and deviant = M, and (iv) standard = V and deviant = M. Vertical bars between a PSTH and LFP (Bi–v) shows time of stimulus tokens. Colored rectangles (pink and purple) mark the response to the deviant, being compared (enlarged) in Bv and Bvi, respectively.

