Abstract
Residential proximity to vegetation and plants is associated with many health benefits, including reduced risk of cardiovascular disease, diabetes and mental stress. Although the mechanisms by which proximity to greenness affects health remain unclear, plants have been shown to remove particulate air pollution. However, the association between residential-area vegetation and exposure to volatile organic chemicals (VOCs) has not been investigated. We recruited a cohort of 213 non-smoking individuals and estimated peak, cumulative, and contemporaneous greenery using satellite-derived normalized difference vegetation index (NDVI) near their residence. We found that the urinary metabolites of exposure to VOCs - acrolein, acrylamide, acrylonitrile, benzene, 1-bromopropane, propylene oxide were inversely associated (7 – 31% lower) with 0.1 higher peak NDVI values within 100 m radius of the participants’ home. These associations were significant at radii ranging from 25 to 300 m. Strongest associations were observed within a 200 m radius, where VOC metabolites were 22% lower per 0.1 unit higher NDVI. Of the 18 measured urinary metabolites, 7 were positively associated with variation of greenness within a 200 m radius of homes. The percent of tree canopy and street trees around participants’ residence were less strongly associated with metabolite levels. The associations between urinary VOC metabolites and residential NDVI values were stronger in winter than in summer, and in participants who were more educated, White, and those who lived close to areas of high traffic. These findings suggest high levels of residential greenness are associated with lower VOC exposure, particularly in winter.
Keywords: Greenness, VOC, NDVI, pollution, metabolites, exposure
1. Introduction
Recent evidence suggests that residential proximity to greenness is associated with diminished risk of all-cause mortality, cardiovascular and respiratory disease, cancer, as well as other adverse health conditions.1, 2 Nevertheless, the mechanisms by which neighborhood greenness exerts salutary effects remain unclear. Exposure to greenness has been linked with reduction in mental stress as well as an increase in cognition.3 Our recent work suggests that those who live in areas of high greenness have lower levels of the urinary levels of epinephrine, an observation indicative of reduced sympathetic activity.4 Living in a neighborhood with high levels of greenness has also been associated with greater social cohesion and higher levels of physical activity.5, 6
Greenness could also affect human health, by decreasing exposure to air pollutants. Trees absorb air particles and can buffer and mitigate exposure to particulates, particularly at new road site locations.7, 8 Moreover, vegetation has the ability to filter, disperse, and block air pollutants from reaching residential areas.9–12 Although the ability of plants to remove specific air pollutants varies substantially, areas with more greenspaces are generally associated with lower levels of pollutants such as ozone, particulates, nitrogen dioxide, sulfur dioxide, and carbon monoxide.13–16
In addition to absorbing airborne particles and greenhouse gases, plants can also remove Volatile Organic Compounds (VOCs).17 These chemicals are ubiquitous in urban environments, resulting in frequent human exposure, primarily through inhalation. Previous work has shown that exposure to VOCs has adverse health effects.18 In animal models, inhalation of VOCs such as acrolein and benzene induces cardiovascular injury.19 Exposure to acrolein and benzene has also been associated with an increase in cardiovascular disease risk in humans.19, 20 In a large study of 720,000 individuals living within a half-mile of 258 Superfund sites, the levels of VOCs have been found to be associated with excessive rates of type 2 diabetes and stroke.21 Other studies have linked exposure to VOCs, such as benzene, propylene, and xylene, to CVD mortality.22 In a single cohort study of intra-urban variation of exposure, benzene and hexane were found to be linked to CVD mortality.23 Similarly, exposure to VOCs, such as butadiene, has been suggested to increase the risk of cancer and heart disease.24 Although most individual exposures to high levels occur in an occupational setting, VOCs are ubiquitous both indoors and in ambient air, particularly near major roadways,25 and could pose significant health risks to large populations. While exposure of individuals to most VOCs takes place indoors, outdoor concentrations have a substantial influence on indoor concentrations.26
The outdoor concentrations of VOCs are determined by a wide variety of place-specific sources and environmental features that include environmental vegetation, or greenness.27 Given that plants can absorb and metabolize VOCs,28, 29 we examined whether residential greenness is associated with VOC exposure. To estimate exposure, we measured the urinary metabolites of a wide range of VOCs in the urine of a non-smoking cohort of participants living in an urban setting with differing levels of greenness.
2. Materials and Methods
2.1. Study Population
Between October 2009 and December 2014, we recruited participants living in primarily urban areas of Louisville, Kentucky, on a near-continuous basis from an outpatient preventive cardiology clinic at the University of Louisville. For the study, we recruited individuals with mild to high cardiovascular disease risk because our previous work has shown that residential proximity to greenness in a similar cohort decreases cardiovascular disease risk.4 To minimize circadian variability, we collected urine specimens between 1:00 and 4:00 PM Eastern Time. We excluded pregnant or lactating women, and prisoners, as well as those with lung, liver, or kidney disease, coagulopathies, substance abuse, chronic cachexia and severe comorbidities. We also excluded participants who were unwilling or unable to provide written informed consent. Prior to enrollment, the University of Louisville Institutional Review Board reviewed and approved all study activities (IRB 09.0174 and 10.0350). All participants provided written informed consent to participate in the study.
We screened 508 participants in the study. Most participants were enrolled during the first half of the recruitment period due to an increasing proportion of already recruited patients at the preventive cardiology clinic. Enrollment was largely consistent throughout seasons, with the exception of the months of November and December, due to seasonal changes in clinic operations. Enrollment of each study participant, including recruitment, consenting, questionnaire administration, blood and urine specimen collection, and compensation took approximately 1.5 h to complete. We collected covariates of age, sex, ethnicity, BMI, and tobacco exposure through questionnaires administered to participants at the time of enrollment. We verified participant-reported tobacco exposure with urinary cotinine measurements. All participants with over 40 mg of cotinine per g of creatinine were excluded from the study due to tobacco exposure, because it has been shown that VOC exposure from tobacco smoke overwhelms the ability to reliably detect exposure from the environment via metabolites.30
We geocoded residential locations of all participants using residential addresses collected during enrollment with the ArcMap9.3+ (ESRI, Redlands, CA) geographic information systems (GIS) software and street information provided by the Louisville/Jefferson County Information Consortium. We corrected the addresses reported by the participants for spelling errors, invalid characters, and invalid or erroneous formats. We used an automatic geolocator tool in ArcMap to identify residential locations by matching address data with known street and address location. Unmatched addresses were manually located through zip code areas, streets, and nearby addresses. Municipal property records show that less than 10% of single-family residential homes at participant addresses (56% of participants with available data) changed ownership within 6 months before enrollment, indicating low residential mobility among participants. Of those screened for the study, we could not obtain the residential location of 51 participants due to invalid addresses provided. These participants were excluded from the study. One participant chose to withdraw from the study and was excluded from all data analysis. After screening and exclusions, data from 213 participants were included in the study. From each participant, we collected information on risk factors for CVD, cardiovascular history, and medication use from questionnaire and clinical records of the participants. To estimate CVD risk, we calculated the Framingham Risk Score (FRS) for each participant based on medical records and questionnaire data. Framingham Risk score was categorized as high for FRS scores greater than 20, or having a previous cardiovascular event. We collected median household income and percent high school education from the U.S. Census Bureau for 2010 at the block group level to represent neighborhood socioeconomic status.31
To account for ambient air pollutant exposure, we quantified roadway exposure by using GIS to measure the distance from participant residences to the nearest major roadway, defined by roads traversed by at least 5000 vehicles per day. Previous work has shown that this is an objective measure of nearby vehicle traffic, which is an important predictor of intra-urban air pollution concentrations.32 We defined and quantified traffic density as the total distance of vehicles that traversed major roadways within 300 m of a participant’s home.
2.2. Residential Proximity to Vegetation
We quantified levels of residential proximity to greenness by calculating the average Normalized Difference Vegetation Index (NDVI) within buffer areas around the homes of participants. We used satellite-derived NDVI, which is the ratio of visible and infrared sunlight to assess ground-level photosynthetic activity - an objective measure of localized greenness.33, 34 NDVI values in inhabited areas typically range from −0.1 (concrete, buildings) to 0.9 (dense forest). We compiled NDVI metrics based on satellite imagery at both 30 m and 250 m spatial resolution. The 30 m resolution imagery was collected by NASA and USGS Landsat satellites.35 Imagery at 250 m resolution was collected by the NASA Moderate Resolution Imaging Spectroradiometer (MODIS) over the course of the study period.36 Both NDVI datasets were accessed through the publicly available United States Geological Survey EarthExplorer remote sensing data repository.24 We quantified greenness metrics within buffer zones of participant residential locations using GIS software. Before quantification, areas of water identified by the National Landcover Database, were excluded from NDVI datasets.37 Peak NDVI values from Landsat satellites, based on 30 m resolution imagery, were calculated within buffer areas at distances of 25, 50, 100, 200, 300, and 500 m, and 1 km from residential addresses. For both 30 m and 250 m imagery, cells falling on the border of a buffer area were clipped to consider only pixel areas within the buffer. NDVI data were then compiled within these buffer areas in order to obtain mean NDVI within the given buffer distance. These data were then linked to participant records for analysis in statistical models. The standard deviations of 30 m resolution peak NDVI cell values within a 200 m radius of residences were similarly quantified to obtain localized spatial variation of greenness.
For our analysis, we quantified peak, cumulative, and contemporaneous NDVI values. Peak greenness was quantified with 30 m resolution, cloudless imagery from summer 2011, the approximate midpoint of participant enrollment. We utilized cloudless 14-day composite NDVI data at 250m spatial resolution, unavailable from more temporally intermittent 30 m resolution Landsat images, to assess greenness contemporaneous with individual participant enrollment (contemporaneous NDVI) and the annual average greenness (cumulative NDVI). We assessed peak greenness from these 14-day MODIS composite images to compare with cumulative and contemporaneous greenness, as well as Landsat-based peak greenness. Due to lower spatial resolution of imagery, peak, cumulative, and contemporaneous NDVI values from MODIS imagery were calculated within a buffer area of 250 m. We calculated contemporaneous NDVI by taking the average of individual months for each year within the study period. Cumulative NDVI was evaluated by taking the average of all months of contemporaneous NDVI.
In addition, we also quantified tree canopy cover, streetscape canopy cover, and spatial variation of NDVI. We used the Louisville Urban Tree Canopy Report, 2014 to estimate tree canopy coverage for Jefferson County.38 We aggregated tree canopy polygon data, with an approximate 3 m resolution equivalent, into 200 m buffer zones surrounding participant residences to determine the total percentage of tree canopy cover near residences. To examine the effects of season, we stratified our data into “Leaf-on” season from April 10 through September 30 and “Leaf-off” season from November 11 through April 9. The deciduous leaf transition period from October 1 through November 10 was not considered. Canopy data were also used to calculate the percent streetscape coverage by tree canopy. This metric was quantified in GIS by first defining and identifying streetscape areas as all areas within 5 m of a city right of way parcel as well as within 15 m of a street centerline. We then calculated the total streetscape area and the area of tree canopy falling within a streetscape to calculate the percentage of streetscape tree canopy coverage within 200 m of participant residences.
2.3. VOC Exposure Assessment
To quantify the overall individual-level VOC exposures in study participants, independent of sources and locations of exposure, we measured 18 urinary metabolite levels of 15 parent VOCs as described before.39, 40 This approach has been shown to effectively quantify urinary VOC metabolites, which are reflective of overall exposure to the respective parent VOC compounds.39–41 Briefly, urine samples on ice were thawed, vortexed and diluted at a 1:50 ratio with 15mM ammonium acetate (pH 6.8) containing isotopic labeled internal standards. Samples were then applied on a UPLC-MS/MS device (ACQUITY UPLC coupled with a Quattro Premier XE triple quadrupole MS, Waters Inc, MA). Analytes in the sample were separated on an Acquity UPLC HSS T3 (150 mm × 2.1 mm, 1.8 μm) column. For muconic acid measurements, samples were diluted 10x with 0.1% formic acid and resolved on an Acquity HSS PFP (150 mm × 2.1 mm, 1.8 μm) column. For each metabolite, three multiple reaction monitoring transitions were set up: one for quantification, one for confirmation, and one for internal standards. Analytes in the sample were quantified using peak area ratio based on 10 point-standard curves that were run before and after the urine sample analyses. Peak integration, calibration, and quantification were performed using TargetLynx software. The concentration of the analytes was normalized to creatinine levels measured on a COBAS MIRA-plus analyzer (Roche, NJ) with Infinity Creatinine Reagent (Thermo Fisher Scientific, Bedford, MA). Each analytical batch consisted of a set of calibrators, a set of quality control samples, a blank, and a set of samples with unknown levels of the analytes. The analysis results were accepted only if the reported values of quality controls (QCs) were within preset limits. These limits were established by performing 20 distinct analyses of both QC high and QC low pools according to quality control procedures, as outlined in the CDC manual.42
2.4. Statistical Analysis
We expressed participant characteristics as n (%) for categorical variables, while mean and standard deviation (SD) were utilized for continuous variables (Table 1). Normality was tested for continuous variables using the Shapiro-Wilk test and by visually inspecting histograms and qq-plots. Continuous variables were log-transformed when normality failed. Participant area demographics, CVD risk factors, and environmental characteristics were compared between participant tertiles of low (0.02–0.36), medium (0.36–0.43), and high (0.43–0.57) peak NDVI values using ANOVA or Chi-squared tests as appropriate.
Table 1:
Characteristics of the study population in low, medium, and high tertiles of residential greenness
| Categorical – n (%) | Total n=213 | Low n=71 | Medium n=71 | High NDVI n=71 | P-value |
|---|---|---|---|---|---|
| Sex | 0.173 | ||||
| Male | 99 (46.5) | 35 (49.3) | 27 (38.0) | 37 (52.1) | |
| Race | 0.011 | ||||
| White | 108 (50.7) | 31 (43.7) | 30 (42.3) | 47 (66.2) | |
| Black | 90 (42.3) | 33 (46.5) | 38 (53.5) | 19 (26.8) | |
| Other | 15 (7.0) | 7 (9.9) | 3 (4.2) | 5 (7.0) | |
| CVD Risk Factors | |||||
| High FRS | 145 (68.1) | 51 (71.8) | 45 (63.4) | 49 (69.0) | 0.204 |
| Exercise | 65 (30.5) | 26 (36.6) | 18 (25.4) | 21 (29.6) | 0.414 |
| Hypertension | 150 (70.4) | 50 (70.4) | 51 (71.8) | 49 (69.0) | 0.982 |
| Hyperlipidemia | 125 (58.7) | 37 (52.1) | 47 (66.2) | 41 (57.7) | 0.270 |
| Diabetes | 70 (32.9) | 26 (36.6) | 21 (29.6) | 23 (32.4) | 0.634 |
| Former smoker | 79 (37.1) | 30 (42.3) | 26 (36.6) | 23 (32.4) | 0.499 |
| Cardiovascular History | |||||
| Myocardial Infarction | 62 (29.1) | 26 (36.6) | 14 (19.7) | 22 (31.0) | 0.058 |
| Stroke | 17 (8.0) | 3 (4.2) | 8 (11.3) | 6 (8.5) | 0.307 |
| CABG/PCI/stents | 41 (19.2) | 16 (22.5) | 11 (15.5) | 14 (19.7) | 0.529 |
| Heart Failure | 37 (17.4) | 17 (23.9) | 9 (12.7) | 11 (15.5) | 0.160 |
| Angina | 51 (23.9) | 19 (26.8) | 17 (23.9) | 15 (21.1) | 0.906 |
| Arrhythmia | 63 (29.6) | 20 (28.2) | 23 (32.4) | 20 (28.2) | 0.672 |
| Continuous - mean (SD) | |||||
| Age (years) | 51.85 (12.0) | 53 (11.8) | 50.01 (11.6) | 52.57 (12.5) | 0.278 |
| BMI | 34.16 (8.6) | 34.32 (9.8) | 33.87 (7.0) | 34.31 (8.8) | 0.938 |
| Systolic BP | 131.74 (19.8) | 134.11 (21.5) | 132.44 (16.7) | 128.77 (21.2) | 0.349 |
| Diastolic BP | 81.35 (10.9) | 81.23 (11.0) | 82.36 (9.7) | 80.39 (12.2) | 0.617 |
| Income | 39.2 (23.7) | 26.9 (17.2) | 38.2 (19.7) | 52.5 (26.0) | <0.001 |
| Education | 82.3 (11.9) | 78.5 (10.8) | 80.2 (12.1) | 88.1 (10.7) | <0.001 |
| Distance to Road | 236.2 (226.1) | 119.6 (106.2) | 288.5 (258.7) | 300.4 (236.4) | <0.001 |
| Traffic Density | 8.3 (11.1) | 14.7 (15.1) | 5.5 (6.5) | 4.6 (6.2) | <0.001 |
| Population Density | 2043.5 (1156.3) | 2518.6 (1308.5) | 2054.6 (1035.2) | 1557.1 (892.2) | <0.001 |
| Elevation | 505.8 (80.1) | 472.4 (44.8) | 491.9 (66.5) | 553.3 (96.8) | <0.001 |
Both categorical and continuous variables are presented for participants living in areas of low (0.02–0.36), medium (0.36–0.43), and high (0.43–0.57) peak NDVI within 100 m of their residence. Peak NDVI was calculated at 30 m resolution for summer 2011.
Abbreviations: CVD, cardiovascular disease; FRS, Framingham Risk Score; CABG, coronary artery bypass graft; PCI, percutaneous coronary intervention; SD, standard deviation; BMI, body mass index (weight(kg)/height(m)2); BP, Blood Pressure; Income, Household Income x103; Education, Percent with High School Education; Distance to Road, Distance in kilometers to the nearest roadway carrying over 5000 vehicles per day; Traffic Density, number of vehicles x10−6 travelling roadways within 300 m per day; Population Density, number of residents per square kilometer; Elevation, elevation in meters above sea level.
To examine whether metabolite levels differed between high and low greenness areas, Student’s t-test was used to test for differences in VOC metabolites between dichotomized high and low greenness groups, based on the median cutoff of peak NDVI (Table 2). Because the urinary metabolites values were positive and positively skewed, we used the gamma distribution with the log-link function to account for non-normal distribution. For each adjusted model, covariates were selected based on significant differences between NDVI tertile groupings. In each model, the percent change and 95% confidence interval were calculated per 0.1 NDVI for each metabolite.
Table 2.
Association between urinary metabolites of VOCs and residential greenness
| Parent compound | VOC metabolite | Abbr. | Low NDVI (0.02–0.39) Mean (SD) | High NDVI (0.39–0.57) Mean (SD) | |
|---|---|---|---|---|---|
| Acrolein | N-Acetyl-S-(2-carboxyethyl)-Lcysteine | CEMA | 127.9 (88.5) | 98.9 (71.4) | * |
| N-Acetyl-S-(3-hydroxypropyl)-Lcysteine | 3HPMA | 340.2 (446.1) | 241.0 (164.7) | * | |
| Acrylamide | N-Acetyl-S-(2-carbamoylethyl)-Lcysteine | AAMA | 68.8 (76.4) | 51.6 (51.3) | * |
| Acrylonitrile | N-Acetyl-S-(2-cyanoethyl)-Lcysteine | CYMA | 11.4 (37.1) | 2.7 (5.0) | * |
| Acrylonitrile, vinyl chloride, ethylene oxide | N-Acetyl-S-(2-hydroxyethyl)-Lcysteine | HEMA | 2.3 (3.7) | 2.2 (4.8) | |
| Benzene | trans, trans-Muconic acid | MU | 165.6 (339.3) | 132.2 (241.4) | |
| 1-Bromopropane | N-Acetyl-S-(n-propyl)-L-cysteine | BPMA | 20.4 (53.9) | 13.9 (20.7) | |
| 1,3-Butadiene | N-Acetyl-S-(3,4-dihydroxybutyl)-Lcysteine | DHBMA | 390.8 (203.1) | 324.3 (123.1) | * |
| N-Acetyl-S-(4-hydroxy-2-buten-1yl)-L-cysteine | MHBMA3 | 11.8 (15.0) | 9.6 (21.3) | * | |
| Crotonaldehyde | N-Acetyl-S-(3-hydroxypropyl-1methyl)-L-cysteine | HPMMA | 270.6 (465.0) | 192.5 (148.3) | |
| N,N-Dimethylformamide | N-Acetyl-S-(N-methylcarbamoyl)-L-cysteine | AMCC | 116.3 (81.2) | 105.0 (57.8) | |
| Ethylbenzene, styrene | Phenylglyoxylic acid | PGA | 211.5 (108.7) | 195.2 (79.5) | |
| Propylene oxide | N-Acetyl-S-(2-hydroxypropyl)-Lcysteine | 2HPMA | 54.7 (108.6) | 32.3 (40.1) | * |
| Styrene | N-Acetyl-S-(1-phenyl-2hydroxyethyl)-L-cysteine + N-Acetyl-S-(2-phenyl-2hydroxyethyl)-L-cysteine | PHEMA | 1.3 (0.9) | 1.5 (2.9) | |
| Mandelic Acid | MA | 165.3 (108.2) | 143.4 (70.9) | ||
| Toluene | N-Acetyl-S-(benzyl)-L-cysteine | BMA | 10.9 (17.1) | 10.2 (18.5) | |
| Xylene | 2-Methylhippuric acid | 2MHA | 27.4 (66.2) | 20.4 (24.8) | |
| 3-Methylhippuric acid + 4Methylhippuric acid | 3MHA+ 4MHA | 195.1 (409.3) | 134.7 (115.9) |
The levels of urinary VOC metabolites were measured by mass spectrometry and stratified by low/high peak NDVI values within 100 m of the participants’ residence.
P<0.05 based on t-test using log-transformed values.
We used Principal Component Analysis (PCA) to test how overall VOC exposure was associated with different radii of peak NDVI. Only VOC metabolites that were independently associated with 100 m peak were used to construct the principal components. Multiple linear regression was performed using PCA scores from the first component as the outcome and peak NDVI values at different radii as the predictor. The first component was used in the regression analysis to represent the greatest overall variation in the data. All statistical analyses were performed using SAS version 9.4 software (SAS Institute, Inc., Cary, North Carolina) and Graphpad Prism, version 7 (Graphpad Software, La Jolla, California).
3. Results
3.1. Geographic Distribution
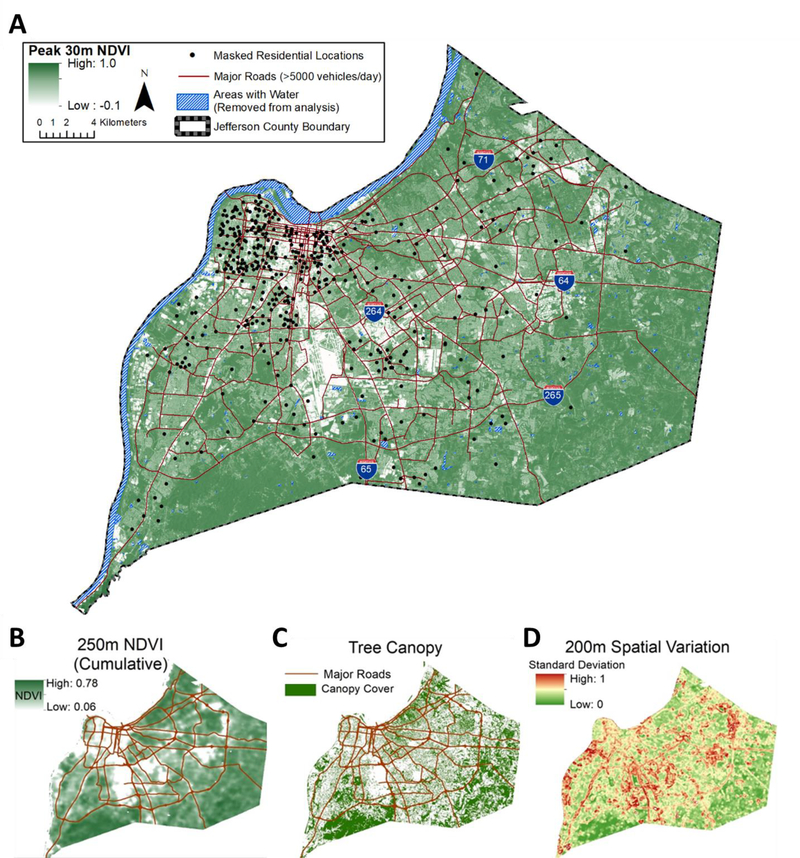
Figure 1 shows the approximate geographic distribution of residential locations of study participants and categories of greenness metrics. Most participants resided in neighborhoods with roadways, sidewalks, driveways, grassy lawns, and canopy-forming trees. Greenness within Jefferson County at 30 m resolution varies between −0.1 and 0.9 NDVI units at the imagery pixel level. Within all areas of the county, the lowest greenness levels (<0.3 NDVI) were found in the central business district, industrial areas, and transportation-related areas within the city of Louisville. Moderate (0.3–0.6 NDVI) greenness values were observed in residential areas. High greenness values (>0.6 NDVI) were observed in urban parks, forests, and undeveloped space.
Figure 1. Location of participants and distribution of greenness in Jefferson County, Kentucky.
A, Approximate locations of study participants and summer peak 30 m resolution NDVI. Shades of green depict NDVI values, with lighter shades representing less vegetation and darker shades representing more vegetation. Major roads are depicted in red. B, Mean cumulative NDVI within a 250 m radii across the county. C, Tree canopy cover. D, spatial variation of 30 m resolution NDVI within buffer areas of 200 m radii. Note - the exact residential locations have been randomly altered to protect participant privacy.
3.2. Participant Characteristics
The study cohort of 213 participants consisted of 47% males, 51% White, 42% Black, and 7% of other race(s) (Table 1). Most participants were hypertensive (70%) with a high FRS value (68%). The mean age of the cohort was 52±12 years with a mean BMI of 34±9. Black participants were significantly more likely to reside in areas with less vegetation than White participants. No significant differences were observed based on vegetation with CVD risk factors, cardiovascular history, medication use, age, sex, or BMI. Participants with low nearby greenness were significantly more likely to live in a lower income and education neighborhood. Participants residing in areas of lower greenness were also in high population density areas, at lower elevation, and had higher levels of nearby traffic than participants residing in high greenness areas.
3.3. Peak Residential Greenness and VOC Metabolites
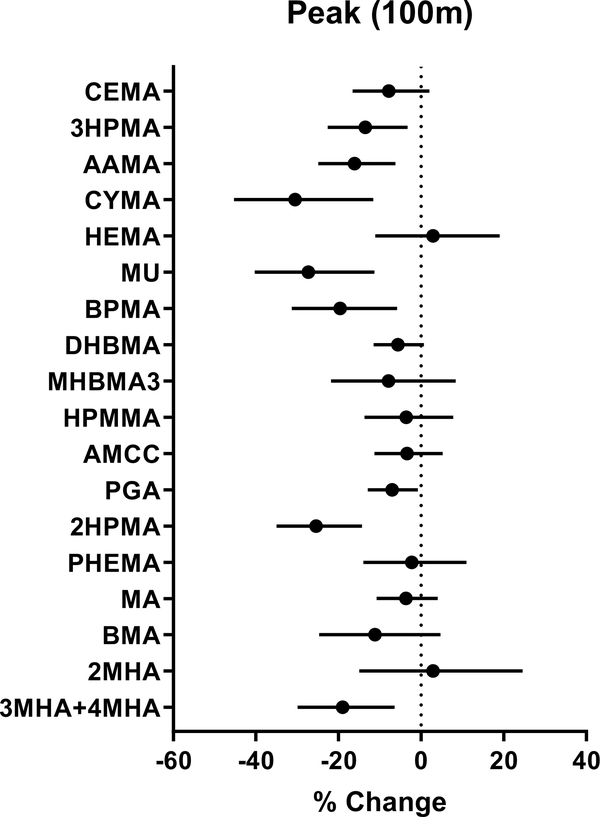
We compared urinary metabolites of VOCs between low and high peak NDVI groups based on the median cutoff. We observed significantly lower levels of metabolites of acrolein (CEMA, 3HPMA), acrylamide (AAMA), acrylonitrile (CYMA), 1,3-butadiene (DHBMA, MHBMA3), and propylene oxide (2HPMA) in the high NDVI group when compared with the low NDVI group (Table 2), indicating that the urinary levels of several VOC metabolites are inversely associated with peak NDVI within 100 m of their residence. The associations between urinary levels of several VOC metabolites and peak NDVI remained significant after adjusting for demographic characteristics that were different between high and low NDVI participants, i.e., race, % high school education, elevation, population density and traffic density (Fig. 2). Of the 18 metabolites measured, 8 were inversely associated with NDVI (3HPMA, AAMA, CYMA, MU, BPMA, 2HPMA, PGA, 3MHA+4MHA). The effect size ranged from 7 to 27% decrease per 0.1 unit NDVI. These observations suggest that living within 100 m of greenness is associated with lower levels of exposure to acrolein, acrylonitrile, benzene, 1-bromopropane, ethyl benzene, styrene, propylene oxide, and xylene.
Figure 2. Association between VOC urinary metabolites and residential greenness.
Residential greenness was quantified using Landsat-based NDVI within 100 m of participants’ home. Association were analyzed using generalized linear models and adjusted for race, percent high school education, elevation, as well as population and traffic density. Values represent percent change in metabolite levels (and 95% confidence intervals) per 0.1 NDVI. For full chemical names of abbreviated VOC metabolites, see Table 2.
3.4. Relationship of VOC metabolites with contemporaneous and cumulative NDVI
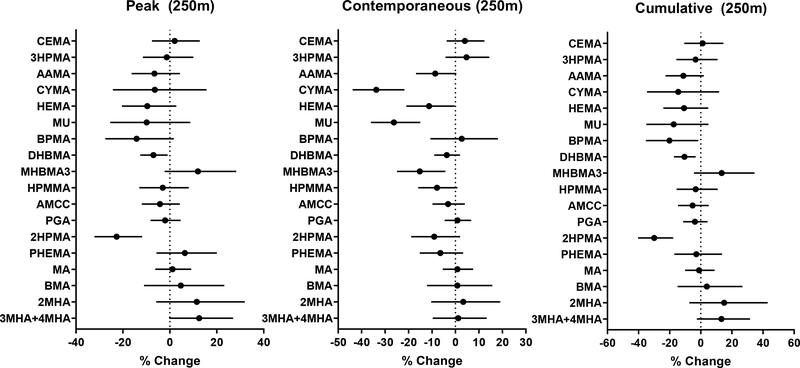
Because NDVI values at the time of enrollment of the participants (contemporaneous values) were different from the total annual NDVI values (cumulative values) around their homes, we examined the association of VOC metabolites with peak, contemporaneous, and cumulative NDVI values. We observed similar associations between metabolites and all three measures of NDVI (Fig. 3). However, in contrast with several significant associations observed with 30 m resolution peak NDVI within 100 m of homes, only associations between greenness and DHBMA and 2HPMA were significant with 250 m peak NDVI values. We then examined contemporaneous NDVI and found significant associations between higher levels of MODIS-based contemporaneous NDVI and lower levels of CYMA, HEMA, MU, and MHBMA3 with effect sizes from −11% to −33%. These observations suggest that greenness levels at the time of enrollments are associated with lower levels of acrylonitrile, vinyl chloride, ethylene oxide, benzene, 1,3-butadiene, and crotonaldehyde. Cumulative values of NDVI were associated with lower levels of exposure to 1-bromopropane, 1,3-butadiene, and propylene oxide, with effect sizes ranging from 11 to 30% lower metabolite levels per 0.1 unit NDVI.
Figure 3. Association between urinary VOC metabolites and peak, contemporaneous and cumulative levels of residential greenness.
Levels of greenness within buffers of indicated radii, surrounding participant residences were measured using MODIS-based NDVI. Generalized linear models were used to examine the association between greenness and VOC metabolites. For peak NDVI, the models were adjusted for race, percent high school education, elevation, population density, traffic density; for contemporaneous NDVI, sex, percent high school education, distance to a major road, elevation, population density, temperature, season; and for cumulative NDVI, race, dichotomized FRS, percent high school education, traffic density, elevation, and population density. Adjustment covariates were selected based on significant differences between NDVI tertile groupings. Values represent percent change in metabolite levels (and 95% confidence intervals) per 0.1 NDVI.
3.5. Associations between canopy coverage and VOC Metabolites
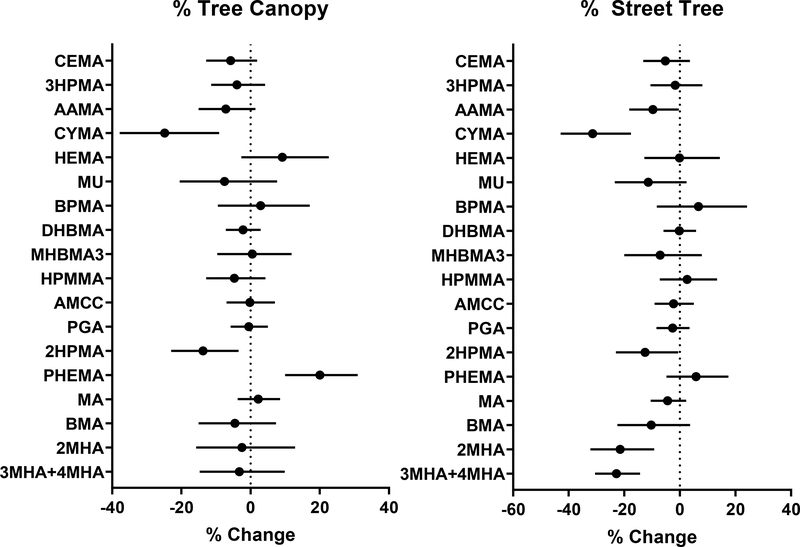
In addition to NDVI-based metrics of greenness, we also examined canopy cover to assess the potential influence of tree canopy on VOC exposure (Fig. 4). The associations between metabolites and tree canopy were much less consistent than NDVI-based metrics, and only CYMA and 2HPMA showed an inverse (25 and 13% lower) association. The metabolite of styrene - PHEMA was positively associated (20% higher) with the percentage of canopy cover within 200 m. These data suggest that propylene oxide and xylene exposure are sensitive to tree canopy, whereas higher tree canopy may be associated with greater exposure to styrene.
Figure 4. Relationship of tree canopy and street trees with urinary VOC metabolites.
Tree canopy and % street trees were estimated within 200 m buffer zone surrounding participants’ residences. Generalized linear models were used to examine the relationship between greenness and VOC metabolites. For tree canopy the models were adjusted for race, traffic density, and population density, whereas for street trees race, percent high school education, population density, and traffic density. Values represent percent change in metabolite levels (and 95% confidence intervals) per 10% difference in canopy cover.
We also explored the role of canopy positioning by examining associations between VOCs and canopy cover as well as streetscape tree canopy. In this analysis, we observed an inverse association between streetscape tree canopy and AAMA, CYMA, 2HPMA, 2MHA, and 3MHA+4MHA. The effect size of these associations ranged between −10 and −31%, suggesting that streetscape tree canopy may be associated with lower levels of exposure to acrylamide, acrylonitrile, propylene oxide, and xylene.
3.6. Association between Greenness Variability and VOC Exposure
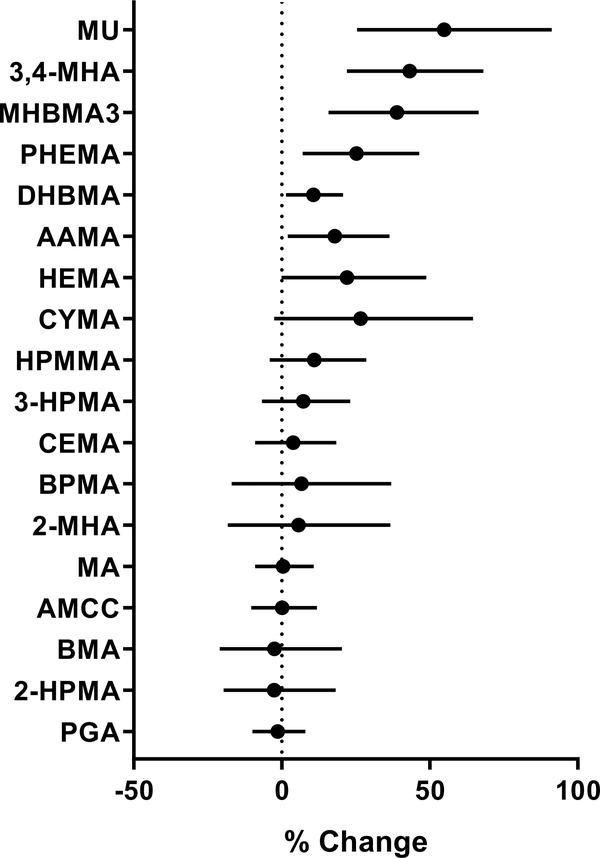
To examine greenness variability, which has been previously found to be associated with coronary heart disease and stroke,43 we examined the spatial variability of greenness within a 200 m radius of homes. This 200 m radius was selected based on our previous finding that VOC metabolites are most strongly associated with greenness within a 200 m radius (see PCA radii comparison). After adjusting for covariates of race, neighborhood education, traffic, and population density, we observed that the interquartile range of peak NDVI standard deviation within a 200 m radius was positively associated with urinary levels of 3,4-MHA (43%), MHBMA3 (38%), MU (55%), PHEMA, (25%), DHBMA (10%), AAMA (18%), and HEMA (22%) (Fig. 5), suggesting that greater variability in greenness around participants’ residence was associated with higher exposure to xylene, 1,3-butadiene, benzene, styrene, acrylamide, acrylonitrile, vinyl chloride, and ethylene oxide.
Figure 5. Relationship between spatial variation in residential greenness and urinary VOC metabolites.
Variation in residential greenness was estimated by the standard deviation in NDVI values with a 200 m radius of participants’ residence. The relationship was examined using generalized linear models, with gamma distribution and log link function. The models were adjusted for race, percent high school education, vehicle distance travelled within a 300 m radius, and population density. Results are presented as percent change (with 95% confidence intervals) per interquartile range of NDVI variation. VOC metabolites are ordered based on the p values of their association with greenness.
3.7. Effect of seasonality
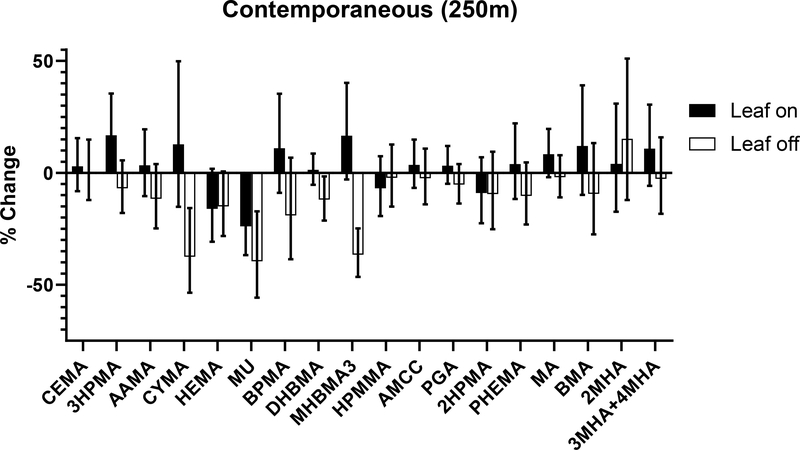
Most trees in the Louisville Metro area are deciduous and therefore the extent of greenness varies significantly with season. To examine the effect of seasonality, we stratified the cohort into two groups – participants that enrolled in the study during times of the year when leaves are present on deciduous trees (leaf-on) and participants enrolled when leaves were not present (leaf-off). Participants enrolled during the autumn transition period were excluded. For participants enrolled during the leaf-on season (from April 10 through November 10), only the benzene metabolite, MU, was significantly lower with contemporaneous NDVI (Fig. 6), whereas the acrolein metabolite, 3HPMA, was significantly higher. However, during the leaf-off season, we observed significantly lower metabolite concentrations of acrylonitrile, benzene, and 1,3-butadiene, with a 0.1 higher level of contemporaneous NDVI.
Figure 6. Relationship between urinary VOC metabolites and residential greenness during leaf-on and leaf-off periods.
Greenness was quantified using contemporaneous NDVI values within a 250 m radius buffer surrounding the residence of participants who enrolled in the study during leaf-on (April 10 – September 30) and leaf-off (November 11 – April 9) periods. The models were adjusted for sex, percent high school education, distance to a major road, elevation, population density, and temperature. Values represent percent change (with 95% confidence interval) per 0.1 NDVI.
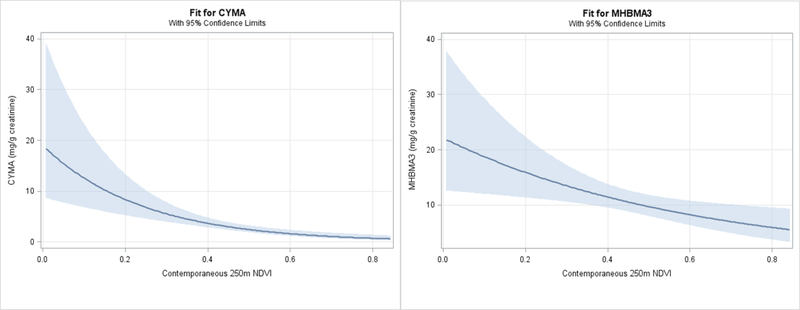
To evaluate the influence of seasonality further, we examined the dose relationship between exposure to greenness and urinary metabolite levels. For this, we used contemporaneous NDVI and two metabolites with a large effect size, CYMA and MHBMA3 derived from acrylonitrile and 1,3-butadiene respectively (Fig.7). Both of these metabolites showed inverse relationship with increasing contemporaneous NDVI, suggesting that higher levels of greenness during periods of low greenness or in low greenness areas have a substantially larger influence on VOC metabolites levels than times and areas with a high peak greenness.
Figure 7. Dose-response relationship between residential greenness and urinary metabolites of acrylonitrile and 1,3-butadiene.
Predicted means with 95% confidence interval are plotted as a function of NDVI values within buffers of 250 m radii surrounding participants’ residence. The generalized linear models with gamma distribution were adjusted for sex, percent high school education, distance to major roadway, elevation, population density, temperature, and season.
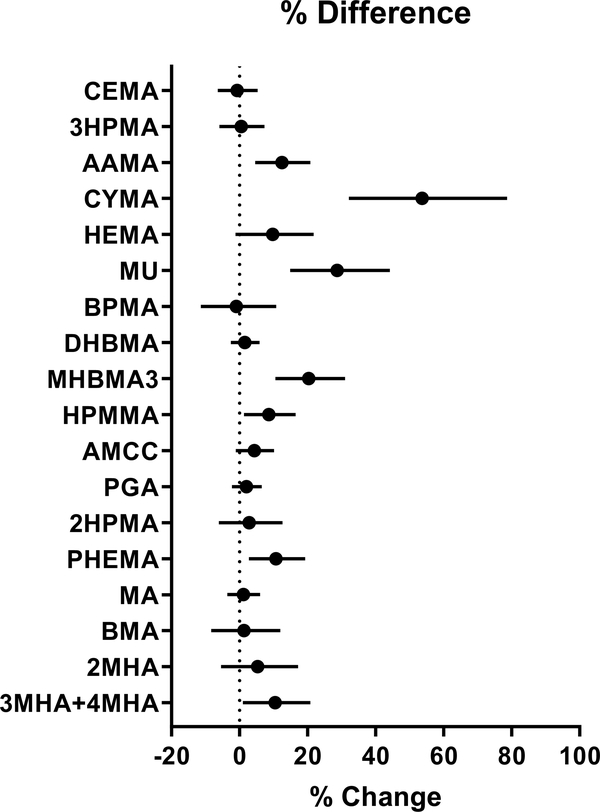
To identify which metabolites are likely to be different between peak and contemporaneous NDVI (i.e., between the residential maximum NDVI during the year and the residential NDVI level at the time of enrollment), we examined the relationship between percent difference in the two NDVI values and VOC metabolites. We found that this % difference was positively associated with urinary levels of AAMA, CYMA, MU, MHBMA3, HPMMA, PHEMA, and 3MHA+4MHA (Fig. 8), suggesting that there was lower exposure to acrylamide, acrylonitrile, benzene, 1,3-butadiene, crotonaldehyde, styrene, and xylene when there was greater vegetation in the neighborhood, independent of the level of greenness when the participants were enrolled.
Figure 8. Association between urinary VOC metabolites with percent difference between peak and contemporaneous NDVI near residence.
The difference between NDVI values was calculated for 250 m radius buffer surrounding participants’ residence as peak, using the peak value of NDVI during summer and the value of the NDVI at the time of enrollment. Values represent percent change in the levels of VOC metabolites (95% confidence interval) per 10% difference in NDVI.
3.8. Effect of distance
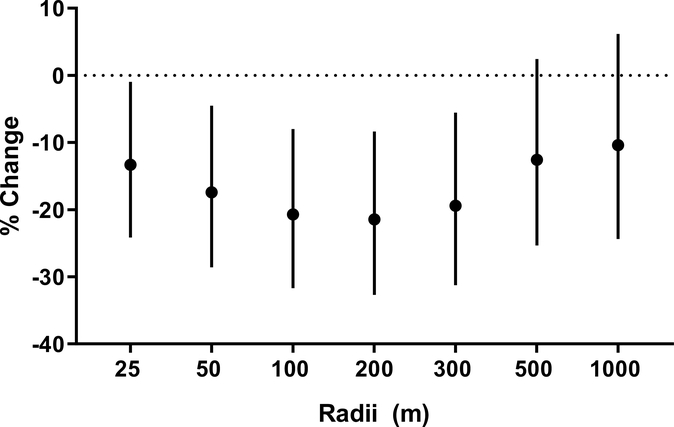
To determine the distance(s) at which greenness is associated with VOC exposure, we examined the relationship between the urinary VOC metabolites and greenness within buffers of different radii surrounding participants’ residence. To assess exposure, we used PCA to quantify VOC exposure collectively. We found a significant inverse association between the VOC principal component and greenness based on peak NDVI at radii of 25, 50, 100, 200, and 300 m, respectively (Fig. 9). Within these values of the radius, NDVI was significantly associated with 13, 17, 20, 21, and 20% lower VOC metabolite levels per 0.1 NDVI. The strongest association between greenness and VOCs was observed at 200 m (21% lower); however, this association was only slightly attenuated by decreasing the radius to 100 m or increasing it to 300 m. These observations suggest that the VOC exposures are most strongly associated with the level of greenness within 200 m radius of the participants’ residence.
Figure 9. Association between residential distance to greenness and the levels of urinary VOC metabolites.
Levels of greenness, quantified as peak NDVI within a buffer zone of indicated radii, were regressed against the PCA scores from the first component of VOC metabolites that were independently associated with 100 m peak NDVI. Values represent percent change and 95% confidence intervals per 0.1 NDVI. Models were adjusted for race, percent high school education, vehicle distance travelled within a 300 m radius, elevation, and population density.
Subgroup Analysis
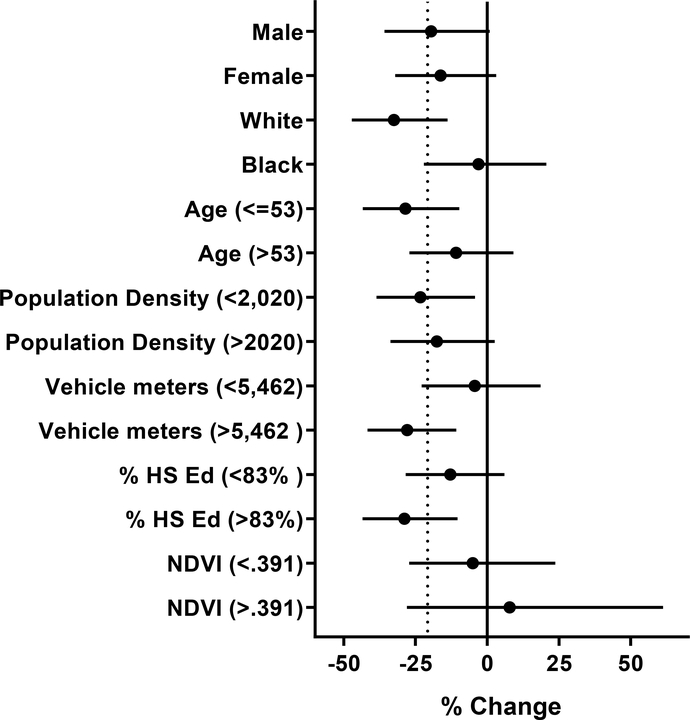
To identify specific groups of participants that might be more sensitive to the effects of residential greenness on VOC exposure, we stratified the first principal component by demographic characteristics (Fig. 10). We found no difference between male and female participants, however, the White participants had 35% lower levels of metabolites, although no such association was observed with Black participants. Moreover, the levels of VOC metabolites were 32% lower among younger (<53 years) participants, but not among older participants. Significant associations between greenness and VOCs were found in both high and low population density areas, but there was little difference between the two. However, in areas with a high amount of motor vehicle traffic, greenness was significantly associated with VOC exposure, while no such association was found in areas with low traffic areas. Additionally, a significant association between greenness and VOCs was observed in areas with high levels of education among residents and not lower education areas. We further identified interactions among several individual metabolites and variations between demographic and environmental stratifications of 100 m peak NDVI, as shown in Tables S1 and S2. Taken together, these findings suggest that residential greenness is associated with VOC exposures mostly in White, young participants, living in areas of high traffic density.
Figure 10. Subgroup analysis of the association between urinary VOC metabolites and residential greenness.
The relationship between residential greenness, calculated using peak NDVI values, within 100 m radius buffer surrounding the participants residence, and the PCA component 1 was examined using multiple regression. PCA analysis was performed using all VOC metabolites that were independently associated with 100 m peak NDVI. The models were adjusted for race, % high school education, vehicle meters, elevation, and population density. Vehicle meters units are x10 −3. Dotted line represents % change for full model.
4. Discussion
The major finding of this study is that higher levels of vegetation surrounding residential locations were associated with lower concentrations of urinary VOC metabolites in an at-risk study population. Our analyses indicate that nearby vegetation is inversely associated with biomarkers of VOC exposure across multiple common metrics of greenness and radii around participant residential locations, even when controlling for roadway exposure and other relevant covariates. Furthermore, the association of nearby vegetation with VOC metabolite levels was particularly robust among White and younger subgroups, as well as those residing within areas of higher education and those with higher nearby motor vehicle traffic. Taken together, these results suggest that exposure to VOC emissions may be mitigated by residential vegetation.
We observed that several VOC metabolites were associated with different metrics of greenness. These consistent associations, after adjustment for covariates and across metabolites and greenness metrics, attest to the veracity of these associations. In our analysis we used 30 m resolution satellite-derived peak NDVI and 250 m resolution peak, cumulative, and contemporaneous NDVI, consistent with many previous studies examining associations between greenness and health outcomes.44 We also examined tree canopy cover and streetscape tree canopy cover to better understand the role of trees compared with other vegetation in these observed relationships. We observed that more metabolites were significantly associated with peak greenness within 100 m of homes, based on 30 m resolution NDVI, than other greenness metrics. This may be due to a higher spatial resolution or specificity of 100 m peak greenness data leading to a more precise assessment of nearby greenness, when compared with 250 m resolution NDVI data, which is aggregated into buffers of the same radii. With this 250 m resolution data, imagery pixel areas outside of the buffer area were not considered in the buffer area calculation, but areas outside of the 250 m buffer still influence the imagery pixel value of areas that fall within the buffer.
Interestingly, while other metabolites were inversely associated with greenness, we observed positive associations between percent canopy cover and styrene. These observations may be due to trapping of some VOCs at the nose-level by canopy trees or because participants with higher proximal greenness largely reside in higher income areas, which are likely to be better insulated, resulting in greater exposure from indoor sources in areas of high greenness. Indeed, in many communities, styrene concentrations are substantially higher indoors.45
When examining associations between tree canopy and VOC metabolites, we observed fewer significant associations than with NDVI-based metrics of greenness, suggesting that aspects of greenness other than tree canopy area may influence exposure to VOCs. However, the percentage of streetscape canopy coverage was inversely associated with 5 metabolites, with effect sizes similar to NDVI-based measures. While overall canopy was not consistently associated with VOC exposure, the spatial positioning of streetscape canopy may be especially important in mitigating VOC exposure from traffic emissions. Additional investigation is required to discern the influence of types, size, and spatial positioning of vegetation on mitigation of traffic-based air pollution.
We found that several VOC metabolites were significantly associated with contemporaneous NDVI and other metrics of greenness. To examine the temporality of these associations, we stratified our analysis by leaf-on and leaf-off seasons to assess the effect of the presence or the absence of leaves in deciduous plants, which predominate in our study area. This stratification showed that contemporaneous NDVI during times when deciduous plants carry leaves was positively associated with acrolein exposure. This could possibly be due to the ability of leafy tree canopy to limit upward dispersion of vehicle-emitted air pollutants, thus increasing ground-level concentrations of acrolein. Nevertheless, acrylonitrile, benzene, 1,3-butadiene exposure were inversely associated with contemporaneous NDVI during times without deciduous leaves, suggesting that the association between greenness and VOC metabolites in winter may be modified by non-deciduous vegetation.
In evaluation of canopy cover, winter NDVI values, and true-color imagery, we found that evergreen trees make up <5% of the total canopy cover of the study area. These results indicate that vegetation other than canopy forming trees included in NDVI assessments, e.g. evergreen trees, shrubs, vines, grasses, etc., and not only tree canopy, has an important role in mitigating VOC exposures. Nevertheless, a multitude of other factors can also influence the difference between leaf-on and leaf-off periods. These include systematic differences in wind speed and patterns between seasons, behaviors such as HVAC use and window opening that affect pollutant infiltration, and variations in atmospheric chemical reactions due to factors such as temperature and sunlight.
Our analysis of peak NDVI at multiple spatial radii yields important insight into the scale of urban greenness that is associated with exposure to VOCs. Importantly, these results demonstrate that greenness within areas up to 300 m and as close as 25 m from homes may affect exposure to VOCs. These findings are consistent with previous results showing that traffic pollutants generally fade to ambient levels at distances of over 300 m from roadways.46, 47 While the health outcomes associated with urban greenness may extend up to 2000 m from residences48, our results suggest that previously reported health influences of urban greenspaces mediated by VOC mitigation may be limited to more proximate areas within 300 m. The association of VOC exposure with greenness with 300 m suggests that installation of residential-level greenness may also be a viable strategy for reduction of personal VOC exposures, whereas vegetation that is not in close proximity to houses may not be as effective.
Our subgroup analysis revealed that the association between greenness and the aggregated measure of VOC exposure (principal component) was significant among only Whites, those residing in a high education area, and those residing in a high roadway vehicle density area. The finding of lower metabolite levels among households with high levels of nearby motor vehicle traffic, when compared with no significant change among participants in areas of low traffic, suggest that vegetation in high traffic areas may be effective at reducing overall VOC exposure. We speculate that this may be due to blocking, dispersing, and filtering of roadway-emitted pollutants between roadways and homes, in comparison to relatively homogenous VOC levels found in environments absent of nearby emission sources.49
Previous studies have demonstrated associations between greenness variation and CVD outcomes of coronary heart disease and stroke, thus we examined the association between variation of greenness within 200 m of homes and VOC metabolites. We observed associations between greenness variation and metabolites of xylene, 1,3-butadiene, benzene, styrene, acrylamide, and acrylonitrile, vinyl chloride, and ethylene oxide. These results are possibly accounted for by the fact that in our cohort, areas with high variation in greenness are often associated with adjacency of residences to major roadways (Fig 1). Indeed, parent compounds of metabolites positively associated with variation of greenness, xylene, butadiene, benzene, styrene, acrylonitrile and ethylene oxide are known to be emitted from vehicle exhaust.25, 50, 51
The major strength of this study is the use of VOC urinary metabolites to measure individual-specific exposure to VOCs in relation to greenness, as opposed to other investigations that depend upon monitoring of location-specific concentrations or population-level estimates of exposure. Furthermore, to interrogate associations between greenness and VOC exposure, we assessed greenness levels using multiple objective metrics of greenness. As NDVI is a common metric of greenness, results of this study may be directly compared with other findings, providing important mechanistic context for understanding the relationships between greenness and health. Address-linked greenness metrics used for this study are substantially more specific to nearby greenness than metrics compiled within large geographic areas. This is especially important given our finding that VOC metabolites are significantly associated with greenness only within 300 m of participant homes. We built on these results by comparing peak NDVI with cumulative, contemporaneous, and variation of NDVI. We examined the nature of these associations by comparing NDVI results with high spatial resolution tree canopy data, delineation of streetscape tree canopy, and comparison of times with and without deciduous foliation. Additionally, the use of urinary cotinine measurements, as opposed to self-reported tobacco use, to exclude study participants exposed to tobacco smoke is an important strength, given the high concentrations of VOCs present in tobacco smoke.52
There are several limitations to this study. Importantly, airborne pollutant concentrations were not measured or estimated at, or within, participant residential locations, which would have provided additional support to our hypothesis. Moreover, even though urinary metabolite concentrations do reflect personal exposure to inhaled airborne VOCs, some metabolites, particularly those derived from acrolein may also be reflective of VOC exposure through ingestion or endogenous production; however, exposure to a majority of other VOCs such as benzene, xylene, styrene are likely to be due to inhalation of polluted air. To measure surrounding vegetation, we used satellite imagery. However, this imagery does not fully account for leaf area, biomass density, height, overlapping vegetation layers, speciation, and other important characteristics of greenness relevant to mitigation of pollutant exposure. Additionally, we assessed only residential vegetation, which accounts for a large, but incomplete, portion of participants’ overall exposure at home or elsewhere. Finally, due to the cross-sectional design of this study, the link between vegetation and exposure to airborne VOCs is limited to association. To provide additional insights into these associations, longitudinal prospective studies are needed to assess how vegetation affects pollutant concentrations emanating from specific sources, how this may affect total VOC exposure, and the resulting effects on health outcomes.
In summary, the results of our study indicate that individuals who reside in areas of higher greenness experience significantly lower exposure to harmful VOCs than residents of low greenness areas do, even after adjustment for sex, race, age, roadway proximity, and population density. Importantly, we found stronger associations between greenness and VOC exposures in winter than in summer and with greenness more proximal to individual residences. These findings contribute to existing knowledge on the relationship between greenness and air pollutant exposures, and might inform future studies that ultimately may delineate the specific role of vegetation in potential moderation of VOC exposure and lead to the development of more targeted greenness-based exposure mitigation strategies.
Supplementary Material
5. Acknowledgments
We thank the UofL Ambulatory Care and University Medical Associates for biological sample collection and Dave Young, Russell Barnett, Wes Abplanalp, and Jordan Finch, Natalie Quisenberry, Victoria Clemons, and Emma Proietti for their assistance with this study.
Sources of funding
This work was supported in part by grants from the WellPoint Foundation and the National Institute of Environmental Health Sciences (ES19217, ES023716).
Abbreviations
- VOCs
Volatile Organic Compounds
- GIS
Geographic Information Systems
- FRS
Framingham Risk Score
- CVD
Cardiovascular Disease
- BMI
Body Mass Index
- GIS
Geographic Information Systems
- NDVI
Normalized Difference Vegetation Index
- MODIS
Moderate Resolution Imaging Spectroradiometer
- QC
Quality Control
- PCA
Principal Component Analysis
Footnotes
Competing financial Interests
None
6. References
- 1.James P, Banay RF, Hart JE and Laden F. A review of the health benefits of greenness. Current epidemiology reports. 2015;2:131–142. [DOI] [PMC free article] [PubMed] [Google Scholar]
- 2.Yeager RA, Smith TR and Bhatnagar AJTicm. Green Environments and Cardiovascular Health. 2019. [DOI] [PMC free article] [PubMed] [Google Scholar]
- 3.Zijlema WL, Triguero-Mas M, Smith G, Cirach M, Martinez D, Dadvand P, Gascon M, Jones M, Gidlow C, Hurst G, Masterson D, Ellis N, van den Berg M, Maas J, van Kamp I, van den Hazel P, Kruize H, Nieuwenhuijsen MJ and Julvez J. The relationship between natural outdoor environments and cognitive functioning and its mediators. Environ Res. 2017;155:268–275. [DOI] [PubMed] [Google Scholar]
- 4.Yeager R, Riggs DW, DeJarnett N, Tollerud DJ, Wilson J, Conklin DJ, O’Toole TE, McCracken J, Lorkiewicz P, Xie Z, Zafar N, Krishnasamy SS, Srivastava S, Finch J, Keith RJ, DeFilippis A, Rai SN, Liu G and Bhatnagar A. Association Between Residential Greenness and Cardiovascular Disease Risk. Journal of the American Heart Association. 2018;7:e009117–e009117. [DOI] [PMC free article] [PubMed] [Google Scholar]
- 5.Kondo M, Fluehr J, McKeon T and Branas C. Urban green space and its impact on human health. Int J Environ Res Public Health. 2018;15:445. [DOI] [PMC free article] [PubMed] [Google Scholar]
- 6.de Vries S, van Dillen SME, Groenewegen PP and Spreeuwenberg P. Streetscape greenery and health: Stress, social cohesion and physical activity as mediators. Social Science & Medicine. 2013;94:26–33. [DOI] [PubMed] [Google Scholar]
- 7.Baldauf R Roadside vegetation design characteristics that can improve local, near-road air quality. Transportation Research Part D: Transport and Environment. 2017;52:354–361. [DOI] [PMC free article] [PubMed] [Google Scholar]
- 8.Tong Z, Baldauf RW, Isakov V, Deshmukh P and Zhang KM. Roadside vegetation barrier designs to mitigate near-road air pollution impacts. Sci Total Environ. 2016;541:920–927. [DOI] [PubMed] [Google Scholar]
- 9.Terzaghi E, Wild E, Zacchello G, Cerabolini BE, Jones KC and Di Guardo A. Forest filter effect: role of leaves in capturing/releasing air particulate matter and its associated PAHs. Atmospheric Environment. 2013;74:378–384. [Google Scholar]
- 10.King KL, Johnson S, Kheirbek I, Lu JW and Matte T. Differences in magnitude and spatial distribution of urban forest pollution deposition rates, air pollution emissions, and ambient neighborhood air quality in New York City. Landscape and Urban Planning. 2014;128:14–22. [Google Scholar]
- 11.Sun D and Zhang Y. Influence of avenue trees on traffic pollutant dispersion in asymmetric street canyons: Numerical modeling with empirical analysis. Transportation Research Part D: Transport and Environment. 2017. [Google Scholar]
- 12.Isakov V, Venkatram A, Baldauf R, Deshmukh P and Zhang M. Evaluation and development of tools to quantify the impacts of roadside vegetation barriers on near-road air quality. International Journal of Environment and Pollution. 2017;62:127–135. [DOI] [PMC free article] [PubMed] [Google Scholar]
- 13.Dadvand P, Rivas I, Basagaña X, Alvarez-Pedrerol M, Su J, Pascual MDC, Amato F, Jerret M, Querol X and Sunyer J. The association between greenness and traffic-related air pollution at schools. Science of the Total Environment. 2015;523:59–63. [DOI] [PubMed] [Google Scholar]
- 14.Weber F, Kowarik I and Säumel I. Herbaceous plants as filters: Immobilization of particulates along urban street corridors. Environmental pollution. 2014;186:234–240. [DOI] [PubMed] [Google Scholar]
- 15.Nowak DJ, Crane DE and Stevens JC. Air pollution removal by urban trees and shrubs in the United States. Urban forestry & urban greening. 2006;4:115–123. [Google Scholar]
- 16.Cruz MD, Christensen JH, Thomsen JD and Müller R. Can ornamental potted plants remove volatile organic compounds from indoor air?—a review. Environmental Science and Pollution Research. 2014;21:13909–13928. [DOI] [PubMed] [Google Scholar]
- 17.Karl T, Harley P, Emmons L, Thornton B, Guenther A, Basu C, Turnipseed A and Jardine K. Efficient atmospheric cleansing of oxidized organic trace gases by vegetation. Science. 2010;330:816–819. [DOI] [PubMed] [Google Scholar]
- 18.Billionnet C, Sherrill D and Annesi-Maesano I. Estimating the Health Effects of Exposure to Multi-Pollutant Mixture. Ann Epidemiol. 2012;22:126–141. [DOI] [PubMed] [Google Scholar]
- 19.Abplanalp W, DeJarnett N, Riggs DW, Conklin DJ, McCracken JP, Srivastava S, Xie Z, Rai S, Bhatnagar A and O’Toole TE. Benzene exposure is associated with cardiovascular disease risk. PLoS One. 2017;12:e0183602. [DOI] [PMC free article] [PubMed] [Google Scholar]
- 20.Faroon O, Roney N, Taylor J, Ashizawa A, Lumpkin M and Plewak D. Acrolein environmental levels and potential for human exposure. Toxicology and Industrial Health. 2008;24:543–564. [DOI] [PubMed] [Google Scholar]
- 21.Lybarger JA, Lee R, Vogt DP, Perhac RM, Spengler RF and Brown DR. Medical Costs and Lost Productivity from Health Conditions at Volatile Organic Compound-Contaminated Superfund Sites. Environmental Research. 1998;79:9–19. [DOI] [PubMed] [Google Scholar]
- 22.Tsai D-H, Wang J-L, Chuang K-J and Chan C-C. Traffic-related air pollution and cardiovascular mortality in central Taiwan. Science of The Total Environment. 2010;408:1818–1823. [DOI] [PubMed] [Google Scholar]
- 23.Villeneuve PJ, Jerrett M, Su J, Burnett RT, Chen H, Brook J, Wheeler AJ, Cakmak S and Goldberg MS. A cohort study of intra-urban variations in volatile organic compounds and mortality, Toronto, Canada. Environmental Pollution. 2013;183:30–39. [DOI] [PubMed] [Google Scholar]
- 24.Matanoski GM, Santos-Burgoa C and Schwartz L. Mortality of a cohort of workers in the styrene-butadiene polymer manufacturing industry (1943–1982). Environmental health perspectives. 1990;86:107. [DOI] [PMC free article] [PubMed] [Google Scholar]
- 25.Mukund R, Kelly TJ and Spicer CW. Source attribution of ambient air toxic and other VOCs in Columbus, Ohio. Atmospheric Environment. 1996;30:3457–3470. [Google Scholar]
- 26.Paciência I, Madureira J, Rufo J, Moreira A and Fernandes EdO. A systematic review of evidence and implications of spatial and seasonal variations of volatile organic compounds (VOC) in indoor human environments. Journal of Toxicology and Environmental Health, Part B. 2016;19:47–64. [DOI] [PubMed] [Google Scholar]
- 27.Oiamo TH, Johnson M, Tang K and Luginaah IN. Assessing traffic and industrial contributions to ambient nitrogen dioxide and volatile organic compounds in a low pollution urban environment. Sci Total Environ. 2015;529:149–157. [DOI] [PubMed] [Google Scholar]
- 28.Kim KJ, Kim HJ, Khalekuzzaman M, Yoo EH, Jung HH, Jang HSJES P. Removal ratio of gaseous toluene and xylene transported from air to root zone via the stem by indoor plants. 2016;23:6149–6158. [DOI] [PMC free article] [PubMed] [Google Scholar]
- 29.Cruz MD, Christensen JH, Thomsen JD, Müller RJES P. Can ornamental potted plants remove volatile organic compounds from indoor air?—a review. 2014;21:13909–13928. [DOI] [PubMed] [Google Scholar]
- 30.Pope CA, Burnett RT, Krewski D, Jerrett M, Shi Y, Calle EE and Thun MJ. Cardiovascular Mortality and Exposure to Airborne Fine Particulate Matter and Cigarette Smoke. Shape of the Exposure-Response Relationship. 2009;120:941–948. [DOI] [PubMed] [Google Scholar]
- 31.Bureau USC. American FactFinder. 2017. [Google Scholar]
- 32.Beelen R, Hoek G, Vienneau D, Eeftens M, Dimakopoulou K, Pedeli X, Tsai M-Y, Künzli N, Schikowski T, Marcon A, Eriksen KT, Raaschou-Nielsen O, Stephanou E, Patelarou E, Lanki T, Yli-Tuomi T, Declercq C, Falq G, Stempfelet M, Birk M, Cyrys J, von Klot S, Nádor G, Varró MJ, Dėdelė A, Gražulevičienė R, Mölter A, Lindley S, Madsen C, Cesaroni G, Ranzi A, Badaloni C, Hoffmann B, Nonnemacher M, Krämer U, Kuhlbusch T, Cirach M, de Nazelle A, Nieuwenhuijsen M, Bellander T, Korek M, Olsson D, Strömgren M, Dons E, Jerrett M, Fischer P, Wang M, Brunekreef B and de Hoogh K. Development of NO2 and NOx land use regression models for estimating air pollution exposure in 36 study areas in Europe – The ESCAPE project. Atmos Environ. 2013;72:10–23. [Google Scholar]
- 33.Tucker CJ. Red and photographic infrared linear combinations for monitoring vegetation. Remote Sensing of Environment. 1979;8:127–150. [Google Scholar]
- 34.Pettorelli N, Vik JO, Mysterud A, Gaillard J-M, Tucker CJ and Stenseth NC. Using the satellite-derived NDVI to assess ecological responses to environmental change. Trends in Ecology & Evolution. 2005;20:503–510. [DOI] [PubMed] [Google Scholar]
- 35.United States Geological Survey. USGS Landsat Missions Overview. 2018. [Google Scholar]
- 36.Huete A, Justice C and Van Leeuwen W. MODIS vegetation index (MOD13). Algorithm theoretical basis document. 1999;3:213. [Google Scholar]
- 37.Milti-Resolution Landcover Consortium. National Land Cover Database 2011. 2016. [Google Scholar]
- 38.Davey Resource Group. Louisville Urban Tree Canopy Assessment. 2015. [Google Scholar]
- 39.Lorkiewicz P, Riggs DW, Keith RJ, Conklin DJ, Xie Z, Sutaria S, Lynch B, Srivastava S and Bhatnagar A. Comparison of Urinary Biomarkers of Exposure in Humans Using Electronic Cigarettes, Combustible Cigarettes, and Smokeless Tobacco. Nicotine Tobacco Res. 2018;21:1228–1238. [DOI] [PMC free article] [PubMed] [Google Scholar]
- 40.Keith RJ, Fetterman JL, Orimoloye OA, Dardari Z, Lorkiewicz PK, Hamburg NM, DeFilippis AP, Blaha MJ and Bhatnagar A. Characterization of Volatile Organic Compound Metabolites in Cigarette Smokers, Electronic Nicotine Device Users, Dual Users, and Nonusers of Tobacco. Nicotine Tobacco Res. 2019. [DOI] [PMC free article] [PubMed] [Google Scholar]
- 41.Alwis KU, Blount BC, Britt AS, Patel D and Ashley DL. Simultaneous analysis of 28 urinary VOC metabolites using ultra high performance liquid chromatography coupled with electrospray ionization tandem mass spectrometry (UPLC-ESI/MSMS). Anal Chim Acta. 2012;750:152–160. [DOI] [PMC free article] [PubMed] [Google Scholar]
- 42.Branch AT and Blount B. Laboratory Procedure Manual. https://wwwncdcgov/nchs/data/nhanes/2015-2016/labmethods/UVOC_UVOCS_I_METpdf 2008.
- 43.Pereira G, Foster S, Martin K, Christian H, Boruff BJ, Knuiman M and Giles-Corti BJBph. The association between neighborhood greenness and cardiovascular disease: an observational study. 2012;12:466. [DOI] [PMC free article] [PubMed] [Google Scholar]
- 44.Fong KC, Hart JE and James P. A Review of Epidemiologic Studies on Greenness and Health: Updated Literature Through 2017. Current Environmental Health Reports. 2018:1–11. [DOI] [PMC free article] [PubMed] [Google Scholar]
- 45.Pellizzari ED, Hartwell TD, Perritt RL, Sparacino CM, Sheldon LS, Zelon HS, Whitmore RW, Breen JJ and Wallace L. Comparison of indoor and outdoor residential levels of volatile organic chemicals in five U.S. geographical areas. Environ Int 1986;12:619–623. [Google Scholar]
- 46.Brugge D, Durant JL and Rioux C. Near-highway pollutants in motor vehicle exhaust: a review of epidemiologic evidence of cardiac and pulmonary health risks. Environmental health. 2007;6:23. [DOI] [PMC free article] [PubMed] [Google Scholar]
- 47.Beckerman B, Jerrett M, Brook JR, Verma DK, Arain MA and Finkelstein MM. Correlation of nitrogen dioxide with other traffic pollutants near a major expressway. Atmospheric Environment. 2008;42:275–290. [Google Scholar]
- 48.Browning M and Lee K. Within What Distance Does “Greenness” Best Predict Physical Health? A Systematic Review of Articles with GIS Buffer Analyses across the Lifespan. International Journal of Environmental Research and Public Health. 2017;14:675. [DOI] [PMC free article] [PubMed] [Google Scholar]
- 49.Amorim JH, Rodrigues V, Tavares R, Valente J and Borrego C. CFD modelling of the aerodynamic effect of trees on urban air pollution dispersion. Science of The Total Environment. 2013;461-462:541–551. [DOI] [PubMed] [Google Scholar]
- 50.Tara IY, Scott CH, Joseph RR, Cody F, Knighton WB and Charles EK. Air Pollutant Mapping with a Mobile Laboratory during the BEE-TEX Field Study. Environmental Health Insights. 2015;9s4:EHIS15660. [DOI] [PMC free article] [PubMed] [Google Scholar]
- 51.Zweidinger RB, Sigsby JE, Tejada SB, Stump FD, Dropkin DL, Ray WD and Duncan JW. Detailed hydrocarbon and aldehyde mobile source emissions from roadway studies. Environmental science & technology. 1988;22:956–962. [DOI] [PubMed] [Google Scholar]
- 52.Haussmann H-JJCrit. Use of hazard indices for a theoretical evaluation of cigarette smoke composition. 2012;25:794–810. [DOI] [PubMed] [Google Scholar]
Associated Data
This section collects any data citations, data availability statements, or supplementary materials included in this article.


