

Abstract
Glucose controls the phosphorylation of silent information regulator 2 (Sir2), a NAD+‐dependent protein deacetylase, which regulates the expression of the ATP‐dependent proton pump Pma1 and replicative lifespan (RLS) in yeast. TORC1 signaling, which is a central regulator of cell growth and lifespan, is regulated by glucose as well as nitrogen sources. In this study, we demonstrate that TORC1 signaling controls Sir2 phosphorylation through casein kinase 2 (CK2) to regulate PMA1 expression and cytoplasmic pH (pHc) in yeast. Inhibition of TORC1 signaling by either TOR1 deletion or rapamycin treatment decreased PMA1 expression, pHc, and vacuolar pH, whereas activation of TORC1 signaling by expressing constitutively active GTR1 (GTR1Q65L) resulted in the opposite phenotypes. Deletion of SIR2 or expression of a phospho‐mutant form of SIR2 increased PMA1 expression, pHc, and vacuolar pH in the tor1Δ mutant, suggesting a functional interaction between Sir2 and TORC1 signaling. Furthermore, deletion of TOR1 or KNS1 encoding a LAMMER kinase decreased the phosphorylation level of Sir2, suggesting that TORC1 signaling controls Sir2 phosphorylation. It was also found that Sit4, a protein phosphatase 2A (PP2A)‐like phosphatase, and Kns1 are required for TORC1 signaling to regulate PMA1 expression and that TORC1 signaling and the cyclic AMP (cAMP)/protein kinase A (PKA) pathway converge on CK2 to regulate PMA1 expression through Sir2. Taken together, these findings suggest that TORC1 signaling regulates PMA1 expression and pHc through the CK2–Sir2 axis, which is also controlled by cAMP/PKA signaling in yeast.
Keywords: aging, cytoplasmic pH, Pma1, Saccharomyces cerevisiae, Sir2, TORC1
TORC1 signaling and the cAMP/PKA pathway converge on CK2 to regulate PMA1 expression and cytoplasmic pH through Sir2. Cytoplasmic pH regulates TORC1 signaling and the cAMP/PKA pathway. Consequently, cytoplasmic pHc and TORC1 and cAMP/PKA signaling pathways form a kind of feedback loop to regulate cell growth in response to glucose availability.

1. INTRODUCTION
Tor1 and Tor2 proteins in budding yeast are serine/threonine protein kinases belonging to the phosphoinositide 3‐kinases (PI3K)‐related kinase family (Keith & Schreiber, 1995). Rapamycin‐sensitive TORC1 connects nutrient availability and stress conditions to anabolic and catabolic activity to control cell growth (Loewith & Hall, 2011; Schmelzle & Hall, 2000). The limited supply of nutrients inhibits TORC1 activity, which leads to the extension of lifespan in yeast as well as in other various organisms (Bjedov et al., 2010; Harrison et al., 2009; Kaeberlein et al., 2005). In yeast, TORC1 activity is regulated through the vacuolar membrane‐associated EGO complex, (Gao & Kaiser, 2006), in which Gtr1 and Gtr2 are Ras‐family GTPases and orthologs of the metazoan counterparts RagA/B and Rag C/D, respectively (Kim, Goraksha‐Hicks, Li, Neufeld, & Guan, 2008; Sancak et al., 2008). Gtr1 loaded with GTP by the guanine nucleotide exchange factor Vam6 interacts with and activates TORC1 depending on amino acid availability, leucine and glutamine in particular (Binda et al., 2009; Powis & De Virgilio, 2016). Interestingly, Gtr1/2 GTPases also mediate glucose signaling to TORC1 (R. Dechant, Saad, Ibanez, & Peter, 2014; Efeyan et al., 2013).
Activation of Sir2, a NAD+‐dependent deacetylase, plays an important role in lifespan extension in yeast, worms, flies, and mice (Kaeberlein, McVey, & Guarente, 1999; Rogina & Helfand, 2004; Satoh et al., 2013; Tissenbaum & Guarente, 2001). Sir2 extends lifespan by inhibiting the formation of extrachromosomal rDNA circles (ERCs) in yeast (Huang & Moazed, 2003; Kaeberlein et al., 1999); it has also been reported that Sir2 regulates replicative lifespan (RLS) through deacetylating histone H4 lysine 16 (H4K16) at the subtelomeric regions (Dang et al., 2009). Recently, our group proposed a novel mechanism for Sir2 role in extending RLS: Sir2 phosphorylated by the activated PKA–casein kinase 2 (CK2) axis derepresses PMA1 transcription and decreases lifespan (Kang, Kim, Kang, Kwon, & Kim, 2015).
Pma1 is a P‐type H+‐ATPase that transports protons across the plasma membrane and functions as a major regulator of cytoplasmic pH (pHc) in yeast (Orij, Brul, & Smits, 2011; Serrano, Kielland‐Brandt, & Fink, 1986). As pHc tightly correlates with cell growth (R. Dechant et al., 2014), understanding the regulatory mechanisms of PMA1 expression and activity is crucial to know how yeast cells respond to a variety of nutritional and environmental factors, such as glucose and acidic pH, to maintain cellular processes for growth and survival. Pma1 is reversibly activated by phosphorylation at the C‐terminal tail in response to glucose (Chang & Slayman, 1991; Eraso & Portillo, 1994; Serrano, 1983) and also transcriptionally regulated by glucose (Portillo, 2000). Interestingly, it has been recently reported that inhibition of TORC1 signaling reduces Pma1 activity almost by half, although detailed mechanisms remain elusive (Deprez, Eskes, Wilms, Ludovico, & Winderickx, 2018). However, the role of TORC1 in Pma1 activity regulation does not seem to be affected by N sources or amino acids, because addition of various amino acids does not alter pHc (Dechant et al., 2014; Wilms et al., 2017). Thus, it is likely that regulation of Pma1 expression and activity for pH homeostasis in yeast would be largely dependent on glucose availability.
Sir2 receives a signal for Pma1 expression regulation from the cAMP/PKA–CK2 axis activated by glucose (Kang et al., 2015), and TORC1 signaling is also regulated by glucose (Prouteau et al., 2017). Sir2, cAMP/PKA signaling, and TORC1 signaling are major players in determining longevity in response to nutrient availability (Dilova, Easlon, & Lin, 2007). Furthermore, TOR signaling negatively regulates Sir2 function toward ERC formation to extend lifespan in yeast (Ha & Huh, 2011; Medvedik, Lamming, Kim, & Sinclair, 2007), and a similar negative relationship between sirtuins and mTOR has been also observed in mammals (Ghosh, McBurney, & Robbins, 2010; Guo et al., 2011). Based on these reports, we hypothesized that Sir2 and TORC1 signaling may be somehow connected to each other to regulate Pma1 expression. Here, we demonstrate that TORC1 signaling regulates Pma1 expression to control pHc, and vacuolar acidity through Sir2. Additionally, we proved that TORC1 and cAMP/PKA signaling pathways converge on CK2 kinase to regulate Sir2.
2. RESULTS
2.1. TORC1 signaling regulates PMA1 expression through Sir2
A previous report has demonstrated that inhibition of TORC1 signaling stabilizes rDNA loci by modulating the association of Sir2 with rDNA region, indicating a cross‐talk between TORC1 signaling and Sir2 activity (Ha & Huh, 2011). We were curious about whether TORC1 signaling is also associated with Sir2 activity to regulate PMA1 expression in Saccharomyces cerevisiae. To investigate the possibility, NaCl stress resistance was exploited as a phenotypic readout because sir2Δ cells are sensitive to NaCl due to increased PMA1 expression (Kang et al., 2015). The tor1Δ mutant was highly resistant to NaCl compared to the wild‐type strain (Figure 1a). Interestingly, the NaCl‐resistant phenotype of tor1Δ was completely eradicated by SIR2 deletion (Figure 1a), suggesting a possibility that TORC1 signaling controls NaCl resistance through Sir2. PMA1 expression levels were measured in the tor1Δ and tor1Δ sir2Δ mutant strains because the transcriptional repression of PMA1 by Sir2 contributes to NaCl resistance (Kang et al., 2015). The amount of PMA1 mRNA was lower in the tor1Δ strain than that in the wild‐type (Figure 1b), which is consistent with the observation that treatment of rapamycin, an inhibitor of TORC1, decreased PMA1 mRNA level (Figure S1a). However, SIR2 deletion in the tor1Δ strain elevated PMA1 expression level up to that observed in the sir2Δ strain (Figure 1b). In addition, the differences in PMA1 mRNA level were similarly reflected in the amount of Pma1 protein (Figure 1c). The involvement of Tor1 in the regulation of PMA1 expression was valid in another strain (Figures S1b,c), suggesting that TORC1 signaling may generally control Sir2 activity to regulate PMA1 expression in S. cerevisiae. Next, we measured the phosphorylation status of Sir2 in tor1Δ and wild‐type strains and found that lack of Tor1 decreased the phosphorylation level of Sir2 (Figure 1d), which indicates that TORC1 signaling is involved in the Sir2 phosphorylation that controls PMA1 expression (Kang et al., 2015).
Figure 1.
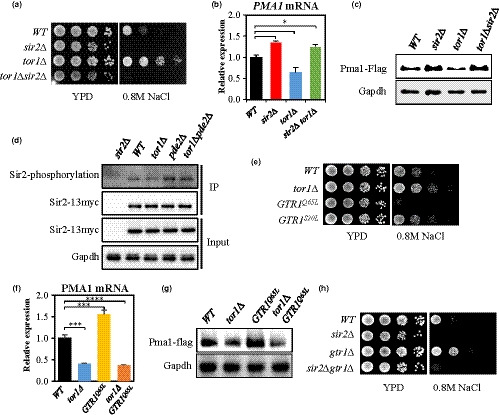
Change in TORC1 activity modulates PMA1 expression through Sir2. (a) Salt stress resistance was tested by spotting the wild‐type (BY4741), sir2Δ, tor1Δ, and sir2Δ tor1Δ strains on YPD with or without 0.8 M NaCl and incubating the plates for three days. (b) PMA1 mRNA levels were measured in the indicated strains by qRT–PCR (*p < .05). (c) Pma1‐FLAG tag was expressed chromosomally and analyzed by Western blot in the indicated strains. (d) Sir2 phosphorylation level in WT, tor1Δ, pde2Δ, and pde2Δ tor1Δ strains. Sir2‐myc13 expressing strains were immunoprecipitated (IP) with anti‐myc antibody and analyzed by Western blotting as indicated. Sir2∆ strain was used as a negative control. (e) Salt stress resistance was tested by spotting the WT, tor1Δ, GTR1Q65L, and GTR1S20L strains on YPD with or without 0.8 M NaCl and incubating the plates for three days. (f) PMA1 mRNA levels were measured in the indicated strains by qRT–PCR (***p < .001, ****p < .0001). (g) Pma1 protein levels were analyzed by Western blot in the indicated strains. GAPDH was used as the loading control. (h) Salt stress resistance was tested by spotting the WT, sir2Δ, gtr1Δ, and sir2Δ gtr1Δ strains on YPD with or without 0.8 M NaCl and incubating the plates for three days. Values in (b) and (f) represent average of at least three independent experiments (±SD)
Glucose regulates Sir2 activity through cAMP/PKA (Kang et al., 2015) and activates TORC1 signaling through the Rag GTPases Gtr1/Gtr2 (Dechant et al., 2014). Hence, we determined whether Gtr1 is involved in the activation of TORC1 signaling to regulate PMA1 expression through Sir2. To answer the question, we examined the NaCl stress resistance of cells expressing GTR1Q65L or GTR1S20L allele, which is restricted to an active GTP‐bound or inactive GDP‐bound confirmation, respectively (Binda et al., 2009; Nakashima, Noguchi, & Nishimoto, 1999). Constitutive activation of Gtr1 (GTR1Q65L) resulted in a hypersensitive phenotype to NaCl, whereas inactivation of Gtr1 (GTR1S20L) increased resistance to NaCl stress (Figure 1e). mRNA and protein levels of Pma1 were higher in GTR1Q65L‐expressing cells than those in the wild‐type but were similarly low in the tor1Δ and tor1Δ GTR1Q65L strains (Figure 1f,g). Moreover, the NaCl‐resistant phenotype of the gtr1∆ strain was abolished in the gtr1∆ sir2∆ strain (Figure 1h). We also examined whether Pib2 participates in PMA1 expression regulation because Pib2 is required to reactivate TORC1 following rapamycin‐induced growth arrest, independently of the Rag GTPases Gtr1/Gtr2 (Ukai et al., 2018; Varlakhanova, Mihalevic, Bernstein, & Ford, 2017). However, the minor effect of PIB2 deletion on PMA1 mRNA and protein levels (Figure S2) suggested that Pib2 is not involved in the activation of TORC1 signaling for PMA1 expression regulation. Collectively, these results led us to conclude that Gtr1/2 GTPases control TORC1 signaling to regulate PMA1 expression through Sir2.
2.2. TORC1 signaling controls pHc and vacuolar pH
pHc and vacuolar pH in yeast are primarily controlled by Pma1 (Reinhard Dechant et al., 2010) and the vacuolar H+‐ ATPase (V‐ATPase) (Forgac, 2007; Kane, 2006), respectively. As Sir2 and TORC1 signaling are associated with PMA1 expression, we hypothesized that pHc of the sir2Δ or tor1Δ mutant cells would be different from that of the wild‐type. To test the hypothesis, we measured the amount of Pma1 localized to the plasma membrane and pHc of the sir2Δ, tor1Δ, and sir2Δ tor1Δ cells growing exponentially in a glucose‐rich complex medium. Pma1 tagged with mCherry was expressed from its native promoter, and the pH‐sensitive super‐ecliptic pHluorin (SEP) (Sankaranarayanan, De Angelis, Rothman, & Ryan, 2000) was expressed from the TEF1 promoter to measure pHc. Although the amount of Pma1 localized to the plasma membrane increased in the sir2∆ mutant compared to that in the wild‐type strain, less amount of Pma1 was present on the plasma membrane in the tor1∆ strain than that in the wild‐type (Figure 2a). Moreover, the deletion of SIR2 in the tor1∆ mutant increased Pma1 present on the plasma membrane up to the level of that observed in the sir2∆ mutant (Figure 2a). The change in the amount of Pma1 on the plasma membrane was correlated with pHc; pHc was higher in the sir2Δ mutant and lower in the tor1∆ mutant than that in the wild‐type, and pHc was similar in the sir2Δ tor1Δ and sir2Δ mutants (Figure 2b). These results suggest that the regulation of PMA1 expression by TORC1 signaling through Sir2 plays an important role in maintaining the pHc of yeast cells growing exponentially in a glucose‐rich complex medium.
Figure 2.
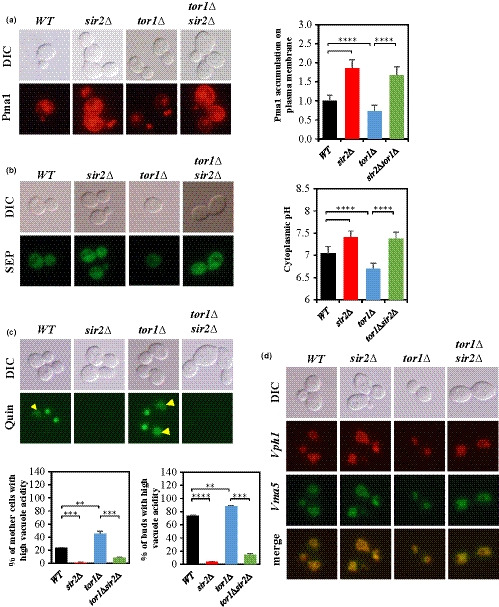
TORC1 signaling regulates the amount of Pma1 and pHc and vacuolar pH. (a) In exponentially growing cells, the amount of Pma1‐mCherry localized at the plasma membrane was determined by measuring the fluorescence intensity in the WT, sir2Δ, tor1Δ, and sir2Δ tor1Δ strains. (b) pHc was determined by measuring fluorescence intensity of pH‐sensitive SEP. (c) Vacuolar acidity was determined as indicated by quinacrine staining of exponentially growing cells. (d) V‐ATPase assembly in exponentially growing cell was analyzed by fluorescence microscopy by co‐expressing Vph1‐mCherry (a component of the Vo sector) and Vma5‐GFP (a component associated with the V1 sector). (a), (b), and (c), n > 100 cells for all strains. A representative image is shown for each strain
Next, we measured vacuolar acidity in the sir2Δ, tor1Δ, and sir2Δ tor1Δ mutant strains because an increased accumulation of Pma1 on the plasma membrane of aged cells negatively affects vacuolar acidity (Henderson, Hughes, & Gottschling, 2014). The portions of the mother and newly budding cells with high vacuolar acidity decreased significantly in the sir2∆ mutant and increased in the tor1∆ mutant compared to those in the wild‐type (Figure 2c). Again, SIR2 deletion in the tor1∆ mutant significantly reduced the portions of cells with high vacuolar acidity (Figure 2c). Because we found similar phenotypes in vacuolar acidity of the mutant strains with cells purified at five divisions (Figure S4a), we continued to experiment without purifying cells at a specific age. V‐ATPase activity is essential for vacuole acidification in response to glucose metabolism and is regulated by the assembly of V‐ATPase subunits on the vacuolar membrane (Martinez‐Munoz & Kane, 2008; Wilms et al., 2017). Thus, we examined whether the sir2∆, tor1∆, and sir2∆ tor1∆ mutant strains differed in V‐ATPase assembly. V‐ATPases appeared normally assembled in the strains proliferating exponentially in a glucose‐rich medium and disassembled in glucose‐starved medium (Figure 2d and FigureS4b), indicating no difference in V‐ATPase assembly in the mutant strains. These results suggest that the regulation of PMA1 expression by TORC1 signaling through Sir2 affects vacuolar acidification independently of V‐ATPase activation.
2.3. TORC1 signaling regulates PMA1 expression through Sir2 phosphorylation at the serine 473 residue
Our previous study revealed that the phosphorylation of Sir2 at the serine 473 (S473) residue, a conserved phosphorylation site in sirtuin family proteins, is essential for Sir2 to repress PMA1 expression (Kang et al., 2015) and this study uncovered that deletion of TOR1 decreased the phosphorylation level of Sir2 (Figure 1d). Thus, we examined whether TORC1 signaling regulates PMA1 expression through Sir2 phosphorylation at S473. Expression of a phospho‐mimetic form of Sir2 (SIR2S473E) in the tor1Δ strain abrogated NaCl stress resistance and increased PMA1 mRNA and protein levels as high as those observed in the sir2∆ or tor1Δ sir2Δ strains (Figure 3a–c), indicating the importance of Sir2 phosphorylation at S473 for the regulation of PMA1 expression by TORC1 signaling. We also determined the involvement of Sir2 phosphorylation in the regulation of pHc by TORC1 signaling. pHc was elevated in the tor1∆ strain expressing SIR2S473E, similar to that observed in the sir2Δ strain, but decreased in the tor1∆ strain expressing a phospho‐defective form (SIR2S473A) (Figure 3d). In addition, the increase in vacuolar acidity by TOR1 deletion decreased significantly by SIR2S473E expression, but the expression of SIR2S473A did not cause a noticeable change in vacuolar acidity in the tor1Δ mutant (Figures 2c and 3e). Further, we investigated whether inhibition of TORC1 signaling affects RLS through Sir2 phosphorylation at S473. Expression of the phospho‐mimetic SIR2S473E decreased RLSs of the tor1∆ mutant strain, whereas expression of a phospho‐defective SIR2S473A had little effect on RLS of the tor1∆ mutant (Figure 3f). These findings support that TORC1 signaling contributes to the regulation of PMA1 expression and pHc through Sir2 phosphorylation at the S473 residue that is associated with the regulation of RLS in yeast.
Figure 3.
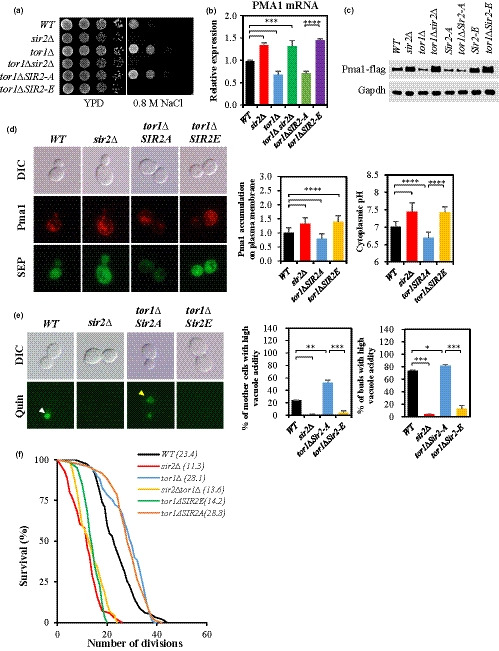
TORC1 signaling regulates PMA1 expression through Sir2 phosphorylation at the S473 residue. (a) Salt stress resistance was tested by spotting the WT, sir2Δ, tor1Δ, sir2Δ tor1Δ, tor1Δ SIR2‐A, and tor1Δ SIR2‐E strains on YPD with or without 0.8 M NaCl and incubating the plates for three days. (b) PMA1 mRNA levels were measured in the indicated strains by qRT–PCR. (c) Pma1‐FLAG tag was expressed chromosomally and analyzed by Western blot in the indicated strains. (d) In exponentially growing cells, Pma1 accumulation and pHc were determined by measuring the fluorescence intensity. (e) Vacuolar acidity was determined as indicated by quinacrine staining of exponentially growing cells. (f) RLS of the WT, sir2Δ, tor1Δ, sir2Δ tor1Δ, tor1∆SIR2‐A, and tor1∆SIR2‐E strains. p < .0001 (WT versus. sir2Δ), p < .0001 (WT versus. tor1Δ), p < .0001 (WT versus. tor1Δ sir2Δ), and p < .0001 (tor1∆ SIR2‐A versus. tor1∆ SIR2‐E). n = 72 for all strains. RLS was measured by micromanipulation. The mean lifespan is indicated. (d) and (e), n > 100 cells for all strains. A representative image is shown for each strain. Values in (b) represent average of at least three independent experiments (±SD)
2.4. Kns1 acts downstream of TORC1 signaling to regulate PMA1 expression
Kns1, a LAMMER kinase, is regulated by TORC1 signaling and mediates the phosphorylation of the RNA polymerase subunit Rpc53 and a CK2 subunit in response to nutrient limitation or various cellular stresses (Lee, Moir, McIntosh, & Willis, 2012; Sanchez‐Casalongue et al., 2015). Thus, we determined whether Kns1 is involved in TORC1 signaling for the regulation of PMA1 expression and pHc. It was found that cells deleted for KNS1 were highly resistant to NaCl, similar to that observed in the tor1∆ strain, and there was no additive effect of simultaneous deletion of KNS1 and TOR1 on NaCl resistance (Figure 4a). In addition, SIR2 deletion in the kns1∆ mutant highly reduced the resistance to NaCl and increased the amount of PMA1 mRNA and protein (Figure 4b,d), and expression of a kinetically inactive KNS1 (KNS1 D440A) (Lee et al., 2012) imparted NaCl resistance to the wild‐type strain (Figure 4e). Furthermore, we found that lack of Kns1 significantly decreased the phosphorylation level of Sir2 (Figure 4f), supporting that Kns1 plays a role in regulating PMA1 expression through Sir2 phosphorylation.
Figure 4.
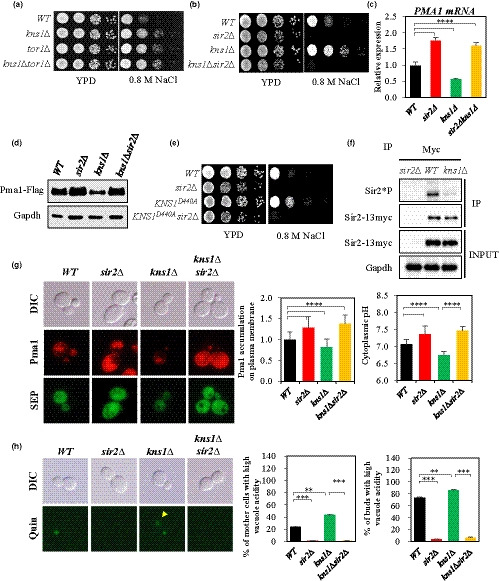
Kns1 acts downstream of TORC1 to regulate PMA1 expression. (a), (b), and (e) Salt stress resistance was analyzed by spotting the WT, kns1Δ, tor1Δ, and kns1 Δ tor1Δ (a); WT, sir2Δ, kns1Δ, and kns1Δ sir2Δ (b); and WT, sir2Δ, KNS1D440A, and KNS1D440A sir2Δ (e) strains on YPD with or without 0.8 M NaCl and incubating the plates for three days. (c) PMA1 mRNA levels were measured in the indicated strains by qRT–PCR (****p < .0001). (d) Pma1‐FLAG tag was expressed chromosomally and analyzed by Western blot. (f) Sir2 phosphorylation level in WT and kns1Δ strains. Sir2‐myc13 expressing strains were immunoprecipitated (IP) with anti‐myc antibody and analyzed by Western blotting as indicated. Sir2∆ strain was used as a negative control. (g) In exponentially growing cells, Pma1 accumulation and pHc were determined by measuring the fluorescence intensity. (h) Vacuolar acidity was determined as indicated by quinacrine staining of exponentially growing cells. (g) and (h), n > 100 cells for all strains. A representative image is shown for each strain. Values in (c) represent average of at least three independent experiments (±SD)
Subsequently, we assessed whether Kns1 is required for maintaining pHc and vacuolar acidity. The kns1∆ mutant showed a decreased amount of Pma1 localized to the plasma membrane and low pHc compared to those observed in the wild‐type strain (Figure 4g), and deletion of SIR2 in the kns1∆ mutant increased the amount of Pma1 present on the plasma membrane and pHc up to the levels observed in the sir2∆ mutant (Figure 4g). In addition, the portion of mother cells with high vacuolar acidity increased in the kns1∆ mutant and significantly decreased in the kns1∆ sir2∆ mutant compared to that in the wild‐type (Figure 4h). We further tested whether expression of SIR2S473E altered the phenotypes of the kns1Δ mutant. The kns1Δ mutant expressing SIR2S473E was more sensitive to NaCl and produced less acidic vacuoles than those by the wild‐type and kns1∆ strains (Figure S5). Collectively, these results suggest that Kns1, as a part of TORC1 signaling, is involved in PMA1 expression regulation through Sir2 phosphorylation at S473.
2.5. Sit4 phosphatase mediates TORC1 signaling for PMA1 expression regulation
TORC1 signaling controls cellular growth primarily through two main downstream effectors, the AGC kinase Sch9 and Tap42‐regulated phosphatase complex, that are directly phosphorylated by TORC1 (Jacinto, Guo, Arndt, Schmelzle, & Hall, 2001; Jiang & Broach, 1999). First, we examined whether Sch9 is involved in the regulation of PMA1 expression by TORC1 signaling. PMA1 expression levels of the wild‐type and sch9∆ cells were similar when no rapamycin treatment was administered (Figure S6). However, the Pma1 protein level in sch9∆ cells decreased upon rapamycin treatment as was the case in the wild‐type (Figure 5a). Thus, we concluded that Sch9 is not associated with TORC1 signaling for the regulation of PMA1 expression. Then, we examined whether TORC1 signaling regulates PMA1 expression through Tap42‐regulated phosphatases. Mutants deleted for individual catalytic phosphatase subunits (PP4/pph3∆, PPG1/ppg1∆, and PP6/sit4∆) of PP2A‐like protein phosphatases or the common regulatory subunit (tpd3∆) of PP2A phosphatases (Hombauer et al., 2007; Workman, Chen, & Laribee, 2016) were generated and examined for the change in Pma1 protein level by rapamycin treatment. Rapamycin treatment reduced Pma1 protein level in the wild‐type and all phosphatase mutants, except for in the sit4∆ cells (Figure 5a), suggesting that the effect of TORC1 inhibition on PMA1 expression is achieved through Sit4. To further investigate the involvement of Sit4 in the regulation of PMA1 expression by TORC1 signaling, we measured the amount of Pma1 on the plasma membrane and pHc before and after rapamycin treatment in the sit4∆ and wild‐type cells. Rapamycin treatment reduced the amount of Pma1 on the plasma membrane and lowered pHc in the wild‐type, but not in the sit4∆ strain (Figure 5b), which supports that Sit4 is required for the regulation of PMA1 expression by TORC1 signaling. As both Sit4 and Kns1 participate in TORC1 signaling to regulate PMA1 expression, a possibility is that Sit4 and Kns1 may form an epistatic relationship in the signaling pathway. Co‐immunoprecipitation experiment revealed that Sit4 and Kns1 physically interact with each other in a rapamycin‐dependent manner (Figure 5c), suggesting that Sit4 released from Tap42 upon rapamycin treatment may control Kns1 activity because Sit4 is a direct downstream effector of TORC1. Taken together, these results suggest that TORC1 signaling regulates PMA1 expression through Sit4, probably via Sit4–Kns1.
Figure 5.
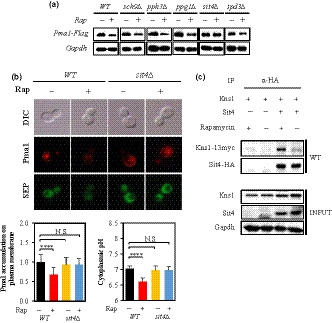
Sit4 phosphatase is involved in TORC1 signaling for PMA1 expression regulation. (a) The sch9Δ, pph3Δ, ppg1Δ, sit4Δ, and tpd3Δ mutant strains were grown exponentially and then treated or not (mock) with 300 nM rapamycin for 1 hr, and Pma1 protein level was analyzed by Western blot. (b) Exponentially growing WT and sit4∆ cells were treated or not with rapamycin as in (a), and Pma1 accumulation and pHc were determined by measuring the fluorescence intensity. n > 100 cells for all strains. A representative image is shown for each strain. (c) Cells co‐expressing KNS1‐myc13 and SIT4‐HA were grown exponentially in YPD and treated or not (mock) with 300 nM rapamycin for 1 hr, and extracts were immunoprecipitated with anti‐HA antibody. Whole‐cell extract and immunoprecipitated proteins were analyzed by Western blotting
2.6. TORC1 and cAMP/PKA signaling pathways converge on CK2 to regulate PMA1 expression
The cAMP/PKA signaling pathway regulates PMA1 expression through the CK2–Sir2 axis (Kang et al., 2015). Thus, our finding that TORC1 signaling regulates PMA1 expression through Sir2 prompted us to hypothesize that TORC1 signaling may also regulate PMA1 expression via the CK2–Sir2 axis. To test the hypothesis, CKA2 encoding a catalytic subunit of CK2 was deleted from the strain expressing a TORC1‐activating GTR1Q65L allele and checked for sensitivity to NaCl. The GTR1Q65L strain became resistant to NaCl in the absence of Cka2, which was similar to the phenotypic change of the pde2∆ mutant by CKA2 deletion (Figure 6a). Moreover, CKA2 deletion reduced PMA1 mRNA and protein levels in the GTR1Q65L and pde2∆ mutants as well as in the wild‐type (Figure 6b,c). These results suggest that TORC1 signaling is connected to Sir2–Pma1 via CK2 as with the cAMP/PKA signaling pathway. Furthermore, we observed that the introduction of PDE2 deletion into the tor1∆ mutant resulted in an intermediate NaCl‐resistant phenotype and PMA1 mRNA level compared to those in the pde2∆ and tor1∆ mutants (Figure S7). Taken together, these results suggest that TORC1 signaling and the cAMP/PKA pathway converge on CK2 to regulate PMA1 expression through Sir2.
Figure 6.
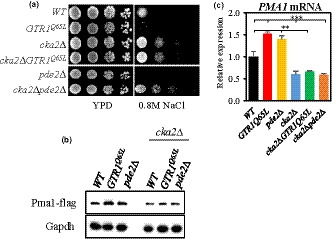
TORC1 signaling regulates PMA1 expression through CK2. (a) Salt stress resistance was analyzed by spotting the WT, GTR1Q65L, cka2Δ, cka2Δ GTR1Q65L, pde2Δ, and cka2Δ pde2Δ strains on YPD with or without 0.8 M NaCl and incubating the plates for three days. (b) PMA1 mRNA levels were measured in the indicated strains by qRT–PCR. **p < .01 (WT versus. pde2∆ and cka2∆ GTR1Q65L), *** p < .001 (WT versus. GTR1Q65L, cka2∆, and cka2∆ pde2∆). (c) Pma1‐FLAG was expressed chromosomally in the indicated strains and analyzed by Western blot
3. DISCUSSION
TORC1, which is a highly conserved protein kinase complex from yeast to humans, controls cell growth by regulating ribosome biogenesis, protein synthesis, autophagy, and entry into the reversible quiescent state/Go (Loewith & Hall, 2011). In this study, we showed that TORC1 signaling is involved in the regulation of PMA1 expression, pHc, and vacuolar pH. We also uncovered that TORC1 signal is delivered to CK2 through Sit4 and affects Sir2 phosphorylation at the S473 residue, which in turn controls PMA1 expression. Together with our previous results demonstrating that cAMP/PKA signaling regulates PMA1 expression and RLS through the CK2–Sir2 axis, this study provides us with very intriguing information that two of the most important nutrient signaling pathways, TORC1 and cAMP/PKA, converge on CK2 to regulate Sir2 activity toward PMA1 expression, pHc, and vacuolar pH in S. cerevisiae.
TORC1 and PKA signaling pathways coordinate cellular processes for growth in response to nutrients and stress conditions in yeast. The two pathways converge on the protein kinase Rim15 to properly control the entry into a quiescent state (Pedruzzi et al., 2003) and regulate a few common target proteins that are important for growth and stress responses (Beck & Hall, 1999; Gorner et al., 1998; Jorgensen et al., 2004), although whether they function dependently or interact with each other for the purpose is not determined unequivocally. According to one model, TORC1 and PKA signaling pathways function in parallel to promote cell growth or control autophagy (Ramachandran, Shah, & Herman, 2011; Stephan, Yeh, Ramachandran, Deminoff, & Herman, 2009), but the other model proposes that TORC1 is upstream of the PKA pathway (Martin, Demougin, Hall, & Bellis, 2004; Schmelzle, Beck, Martin, & Hall, 2004) and activates only a subset of PKA substrates (Soulard et al., 2010). In this study, we report that the TORC1 and cAMP/PKA signaling pathways converge on the protein kinase CK2 to control PMA1 expression through Sir2. Activation or inactivation of one of the pathways increased or decreased PMA1 expression, respectively, when the other was normally functioning, but the effect of activation of cAMP/PKA signaling on PMA1 expression was compromised by inactivation of TORC1 signaling (Figure S7). Thus, it is likely that two signals from TORC1 and PKA combine together to control the intensity of the overall signal for regulating pHc and maintaining proper growth according to environmental conditions, although we do not know the detailed mechanism of how each of the two pathways regulates CK2 activity.
A recent study reported that inhibition of TORC1 signaling reduces Pma1 activity to 57% of the control cells (Mahmoud et al., 2017). As Pma1 activity was measured from the total membrane fraction, not from purified Pma1, in the study, the reduced Pma1 activity is likely to be due to its downregulated expression level. If this were the case, the result would be consistent with our data showing that inhibition of TORC1 signaling downregulates PMA1 expression. The study also reported that the deletion of SIT4 decreases Pma1 activity and lowers pHc compared to that in the wild‐type (Mahmoud et al., 2017). In this study, however, we found that the deletion of SIT4 did not alter the levels of Pma1 and pHc (Figure 5b). If Sit4 detached from Tap42 upon TORC1 inactivation is involved in PMA1 expression regulation, the absence of Sit4 is expected to alter PMA1 expression. However, if most Sit4 proteins are bound to Tap42 and are maintained as inactivated in glucose‐rich condition wherein TORC1 is active (Di Como & Arndt, 1996), there may be little difference, if any, in Pma1 levels between the sit4∆ mutant and wild‐type cells growing in glucose‐rich condition, which is in agreement with our data (Figure 5b). Further studies are needed to explain the reason for the discrepancy between the results of this study and the previous publication (Mahmoud et al., 2017).
Kns1 is the only member of the LAMMER/CDC‐like (CLK) kinase family in yeast. A number of studies in different organisms have revealed a function of LAMMER kinases to phosphorylate serine/arginine‐rich (SR) proteins that regulate mRNA splicing (Colwill et al., 1996; Du, McGuffin, Dauwalder, Rabinow, & Mattox, 1998; Nikolakaki et al., 2002). However, less is known about its function in other processes. Recent studies have reported that Kns1 is a downstream effector of TORC1 in the regulation of ribosome and tRNA synthesis and functions by priming the phosphorylation of Rpc53 by Mck1 (Lee et al., 2012); Kns1 directly phosphorylates Cbk1, a regulatory subunit of CK2, to regulate the association of CK2 with some of its substrates (Sanchez‐Casalongue et al., 2015). In this study, we discovered that Kns1 is positively controlled by TORC1 to regulate Sir2 activity and PMA1 expression. In addition, because we detected a direct interaction between Sit4 and Kns1 (Figure 5c), we speculate that Sit4 freed from Tap42 when TORC1 signaling is inhibited might inhibit Kns1 through dephosphorylation, which in turn inhibit CK2 from phosphorylating Sir2. Further study is expected to uncover how Sit4 is related to Kns1 to control PMA1 expression regulation.
Alteration in pHc causes an enormous impact on cell growth as it could change enzyme activity, protein structure, membrane potential, functions of subcellular organelles, etc. (Deprez et al., 2018; Orij et al., 2011). Because Pma1 effluxes protons from the cytoplasm to the extracellular space to control pHc (Morsomme, Slayman, & Goffeau, 2000), tight regulation of activity and expression level of Pma1 in accordance with the environmental condition would be crucial for maintaining optimal cell growth and increasing survival and longevity. In addition, low pHc due to the asymmetric distribution of Pma1 on the plasma membrane is responsible for the rejuvenation of daughter cell budding from old mother cells (Henderson et al., 2014). Glucose activates Pma1 post‐translationally by inducing phosphorylation at serine 911 and threonine 912 residues of Pma1 (Lecchi et al., 2007; Mazon, Eraso, & Portillo, 2015) and increases the transcription of PMA1 by controlling Sir2 phosphorylation and binding of the Rap1 transcription factor to the upstream activating sequence of PMA1 (Capieaux, Vignais, Sentenac, & Goffeau, 1989; Rao, Drummond‐Barbosa, & Slayman, 1993). Thus, in glucose‐rich condition, wherein Pma1 is fully active and the PMA1 promoter is highly activated, it is possible that V‐ATPase may contribute to pHc regulation. V‐ATPase, which is a multi‐subunit enzyme structurally organized into two major sectors, a peripheral V1 sector for ATP hydrolysis and a membrane‐embedded Vo sector for proton translocation (Parra, Chan, & Chen, 2014), is a primary proton pump localized on the vacuolar membrane and is responsible for the glucose‐mediated increase in vacuolar acidity (Orij et al., 2011). Sch9 kinase, a major downstream effector of TORC1, is involved in the regulation of V‐ATPase by affecting reversible disassembly of the Vo and V1 sectors in response to glucose availability (Kane, 1995; Parra et al., 2014; Wilms et al., 2017). However, we found that Sch9 has no role in PMA1 expression regulation by TORC1 signaling in glucose‐rich condition (Figure S6), and V‐ATPase remained assembled in the sir2∆ and tor1∆ strains as long as glucose was present in the environment, although vacuolar pH was different in the strains (Figure 2d and Figure S4b). In contrast, the tor1∆, SIR2A, and tor1∆ SIR2A strains, which exhibited decreased PMA1 expression, showed lower pHc than that in the wild‐type, whereas sir2∆, tor1∆ sir2∆, and tor1∆ SIR2E strains, which exhibited increased PMA1 expression, showed higher pHc than that in the wild‐type (Figures 2 and 3). Thus, it seems likely that the amount of Pma1 on the plasma membrane would be a major contributor to the change in pHc and vacuolar acidity in the sir2∆ and tor1∆ strains. These results are consistent with the previous observation that Pma1 accumulation on the plasma membrane is linked with reduced vacuolar acidity (Hughes & Gottschling, 2012).
A number of studies have reported that TOR1 deletion or inhibition of TORC1 signaling by rapamycin or nutrient deprivation extends lifespan by sirtuin‐independent pathways in yeast (Kaeberlein et al., 2005; Powers, Kaeberlein, Caldwell, Kennedy, & Fields, 2006). However, there are also a few studies demonstrating that inhibition of TORC1 signaling enhances Sir2 activity to stabilize the rDNA loci and prevent the formation of ERCs, resulting in increased RLS in yeast (Ha & Huh, 2011; Medvedik et al., 2007). We demonstrated that TORC1 signaling regulates Sir2 phosphorylation (Figures 1d and 4f), which affects RLS through PMA1 expression regulation independently of ERC formation (Kang et al., 2015). And, expression of the phospho‐mimetic SIR2S473E decreased RLS of the tor1∆ mutant strain (Figure 3f), suggesting that part of the effect of TOR1 deletion on RLS is related to Sir2 phosphorylation at S473. To more clearly show that Sir2 is placed downstream of TORC1 signaling in terms of the regulation of PMA1 expression and RLS, we analyzed the effect of SIR2 deletion on the RLS of TOR1 or KNS1 deletion strain. To exclude the effect of ERC formation on RLS, we deleted each gene in the fob1∆ background and measured RLS. It was found that SIR2 deletion reduced the RLS of fob1∆ tor1∆ or fob1∆ kns1∆ strain by 20.8% or 14.8%, respectively (Figure S8). Contrary to our expectation, however, the percent increase in RLS due to TOR1 or KNS1 deletion was greater in the absence of Sir2 (37.4% for fob1∆ sir2∆ tor1∆ and 27.5% for fob1∆ sir2∆ kns1∆) than in the presence of Sir2 (32.9% for fob1∆ tor1∆ and 16% for fob1∆ kns1∆), which is inconsistent with the Sir2’s role in promoting longevity. Interestingly, similar observations have been reported that the effect of HXK2 or GPA2 deletion on the percent extension in RLS was greater in the fob1∆ sir2∆ background (67.2% or 53.8%, respectively) than in the fob1∆ background (45.1% or 39%, respectively) (Delaney, Murakami, Olsen, Kennedy, & Kaeberlein, 2011; Kaeberlein, Kirkland, Fields, & Kennedy, 2004). These results suggest that the data of RLS analysis should be carefully interpreted to determine the epistasis relationship between two or more RLS‐altering genes. Especially with regard to SIR2, TOR1, and KNS1, which have multiple downstream effectors affecting cellular growth and RLS and form unknown and intricate interconnections between the downstream effectors (He, Zhou, & Kennedy, 2018), more sophisticatedly designed biochemical and genetic analyses are expected to reveal the relationship between TORC1 signaling and Sir2 in terms of RLS extension.
In summary, this study proposes a novel signaling network where two important nutrient signaling pathways, TORC1 and cAMP/PKA, converge on CK2, which regulates Sir2 phosphorylation to control PMA1 expression and pHc in a glucose‐dependent manner. Considering that pHc acts as a cellular signal to control TORC1 and PKA activity in response to glucose availability (Dechant et al., 2014), we suggest that pHc and TORC1 and cAMP/PKA signaling pathways form a kind of positive feedback loop to regulate cell growth in response to glucose availability. Why this feedback loop is needed for growth control and how sophisticatedly it operates remain to be elucidated.
4. EXPERIMENTAL PROCEDURES
4.1. Yeast strains and growth conditions
The experiments were performed using the BY4741 (MATa his3∆1 leu2∆0 met15∆0 ura3∆0) strain unless otherwise noted. Cells were grown in standard YPD liquid media containing Bacto peptone 20 g/L (Becton Dickinson), yeast extract 10 g/L (Becton Dickinson), and dextrose 20 g/L (Junsei) and incubated at 30°C. Solid medium was prepared by adding 20 g/L agar (Junsei). Synthetic drop‐out medium was prepared by adding 0.67 g/L yeast nitrogen base without amino acids (Becton Dickinson) and amino acids, except for either uracil or histidine, to select yeast transformant cells. When required, transformants were plated onto solid medium containing 5′‐fluoroorotic acid (1 mg/ml) to select for the loss of the URA3 marker.
4.2. Molecular techniques
Deletion strains were generated by replacing each open reading frame with URA3 or HIS3 through homologous recombination, resulting in strains listed in Table S1 in the supplemental material. Disruption cassettes were amplified using the appropriate primers and plasmid templates listed in Table S2. Yeast cells were transformed using the lithium acetate method as described previously (Gietz & Schiestl, 2007), and successful transformants were selected on SC‐URA plates. To measure Pma1 protein levels by Western blotting, the endogenous PMA1 gene was replaced with a DNA fragment containing the C‐terminal FLAG‐tagged PMA1 and URA3 marker genes by homologous recombination. To generate strains expressing Kns1 without catalytic activity (Kns1D440A), a DNA fragment including the FLAG‐tagged mutant KNS1 and URA3 (marker gene) was integrated at the endogenous KNS1 region. All strains generated in this study were verified by PCR and/or Western blotting.
4.3. Stress resistance test
Yeast cells were grown in YPD medium at 30°C for overnight and then seeded into 2 ml of YPD medium at an initial OD600 of 0.2 and incubated to log phase. One milliliter of the cell culture was collected, and the cells were washed with distilled water, diluted, and spotted onto regular YPD or YPD containing 0.8 M NaCl. The cells were incubated for 2–3 days at 30°C, and then, the plates were photographed.
4.4. Preparation of whole‐cell extracts and Western blotting
All the strains were grown in YPD till the exponential phase at 30°C. Total cell extracts were prepared using the trichloroacetic acid (TCA) method, and the pellet was resuspended in sample mercaptoethanol, 0.001% bromophenol blue. Proteins were separated on 10% SDS–polyacrylamide gel electrophoresis (PAGE) gels and transferred to polyvinylidene fluoride (PVDF) membranes (Millipore). The membranes were probed with specific antibodies and detected by HRP‐conjugated secondary antibody. The primary antibodies were anti‐FLAG (1:1,000; Sigma) and anti‐GAPDH (1:20,000; Acris). Band density trace and quantification were determined using ImageJ (National Institutes of Health).
4.5. Immunoprecipitation
WT strains expressing chromosomally tagged KNS1‐13myc and SIT4‐HA was grown in YPD till the exponential phase at 30°C and then treated with or without 300 nM rapamycin for 1 hr and harvested cells were lysed in lysis buffer [50 mM NaCl, 150 mM Tris‐HCl pH 8.0, 0.1% NP40, 1 mM EDTA, 1 mM EGTA, 1 mM PMSF]. The supernatants were immunoprecipitated with anti‐HA (Millipore) antibody and followed by incubation with protein A/G beads (Santa Cruz Biotechnology). Immunoprecipitates were washed four times with lysis buffer and then eluted by boiling in sample buffer. Samples were resolved by 8% SDS‐PAGE and analyzed by Western blotting using the appropriate antibodies. To analyze the Sir2 phosphorylation level in the indicated strains, cells with chromosomally tagged SIR2‐13MYC were grown to the exponential phase at 30°C in YPD, harvested, and lysed in lysis buffer [50 mM HEPES‐KOH pH 7.5, 150 mM NaCl, 1 mM EDTA, 1% Triton X‐100, 1 mM PMSF] containing phosphatase inhibitors. Supernatants were collected and immunoprecipitated with anti‐Myc antibody (Millipore), and followed by incubation with 20 μl protein A/G beads (Santa Cruz Biotechnology). Samples were resolved by 8% SDS‐PAGE and analyzed by Western blotting using a phosphoserine antibody (1:100, Qiagen, Valencia, CA).
4.6. RNA isolation, cDNA synthesis, and real‐time PCR analysis
All the strains were grown in YPD till the exponential phase at 30°C. Total RNA was purified using the NucleoSpin RNA kit (Macherey‐Nagel) and quantified by measuring absorbance at 260 nm. From each 1 μg of RNA sample, cDNA was synthesized using the ReverTra Ace qPCR RT Kit (Toyobo, Japan), according to the manufacturer's recommendations, and analyzed by quantitative RT–PCR. RT–PCR was performed with SYBR green PCR mix (Bio‐Rad) and CFX connect system (Bio‐Rad). Relative expression levels (normalized to ACT1) were determined using the comparative CT method.
4.7. Yeast lifespan determination
The RLS of the yeast strains was determined by micromanipulation as previously described (Kaeberlein et al., 2005) using 60–70 virgin cells grown on standard YPD plates containing 2% glucose. Statistical significance of the difference in the RLS between strains was determined by Student's t test (p < .05).
4.8. Vacuole staining
Quinacrine (Sigma Q3251) staining was performed as previously described (Hughes & Gottschling, 2012) with some modification. Cells were grown in YPD media to an OD600 of 0.8–1.0, and 1 ml was harvested and washed twice in uptake buffer (YPD buffered to pH 7.6 with 100 mM HEPES). The cell pellet was resuspended in 100 µl of the same buffered media containing 200 μM quinacrine. Cells were incubated at 30℃ for 10 min and then for 5 min on ice. Cells were pelleted and washed twice with ice‐cold 100 mM HEPES (pH 7.6) and 2% glucose for imaging. Before imaging, cells were maintained on ice, and all images were obtained within 1 hr of staining.
4.9. Measurement of pHc
To generate pH calibration curve (Figure S3), yeast cells expressing SEP (a gift from Daniel E. Gottschling) were grown in baffled flasks to an OD600 of approximately 1.0 in YPD medium, centrifuged for 5 min at 850×g, washed two times with PBS, and resuspended in PBS containing 5 µg/ml digitonin (Sigma). After 5 min, the cells were washed with PBS and resuspended in citric acid/Na2HPO4 buffer, with pH values ranging from 5.0 to 8.5. Images were captured using an Olympus BX51 microscope (green fluorescent protein (GFP) excitation and emission, 460–490 and 520 nm, respectively). Image analysis was performed using ImageJ (version 1.43m, NIH) to quantify mean pHluorin intensity from three different regions of images with a 1‐pixel straight line tool. The background fluorescence of SEP‐nonproducing wild‐type cells was subtracted from those of SEP‐producing cells. Exponentially growing cells were used to quantify pHc of viable single cells. The fluorescence intensity was measured, plotted against the corresponding buffer pH, and fitted to the pH calibration curve (third‐order polynomial regression curve). pH values are always represented as mean ± SD. All pH determination experiments were repeated at least three times (biological replicates), and figures show one representative experiment in which error bars represent the standard deviation of at least three technical replicates.
4.10. V‐ATPase assembly assay
V‐ATPase assembly was investigated by co‐localization of Vph1‐mCherry (a gift from Daniel E. Gottschling) with Vma5‐Venus. All images were captured using an Olympus BX51 microscope. Cells co‐expressing Vph1‐mCherry and Vma5‐Venus were grown to the exponential phase in YEPD, and their intracellular localization was analyzed by fluorescence microscopy. Co‐localization was assessed in at least 30 cells from two to three independent experiments. Combined fluorescence intensity profile plots of Vph1‐mCherry and Vma5‐Venus were measured along the line displayed in each panel. The x‐axis indicated the distance along the line in pixels, whereas the y‐axis indicated the relative mCherry or Venus signal intensity. Pearson's coefficient was calculated using the ImageJ plugin JACoP. Results depicted are mean values ± 95% CI (one‐way ANOVA).
4.11. Image acquisition
Images were captured using an Olympus BX51 microscope (4′,6‐diamidino‐2‐phenylindole (DAPI) excitation and emission, 330–385 and 420 nm, respectively; GFP excitation and emission, 460–490 nm and 520 nm, respectively; red fluorescent protein (RFP) excitation and emission 530–550 and 575 nm, respectively).
CONFLICT OF INTEREST
The authors declare no conflict of interest.
AUTHOR CONTRIBUTIONS
MND conducted experiments and wrote the manuscript; YHK conducted experiments and wrote the manuscript; JJ and WKK conducted experiments; K‐SK conceived the concept, interpreted the results, and edited the manuscript; J‐YK conceived the concept, supervised the study, and wrote and edited the manuscript. All authors approved the manuscript.
Supporting information
Supinfo
ACKNOWLEDGMENTS
We thank Prof. Daniel E. Gottschling for providing super‐ecliptic pHluorin. This work was supported by grants from NRF‐2016R1A2B4014529 and Chungnam National University (J‐YK) and KRIBB Initiative Program and NRF‐2017M3A9D8048709 (K‐SK).
Devare MN, Kim YH, Jung J, Kang WK, Kwon K‐S, Kim J‐Y. TORC1 signaling regulates cytoplasmic pH through Sir2 in yeast. Aging Cell. 2020;19:e13151 10.1111/acel.13151
Mayur Nimbadas Devare and Yeong Hyeock Kim are equal contributors to this paper.
DATA AVAILABILITY STATEMENT
The data that support the findings of this study are available from the corresponding author upon reasonable request.
REFERENCES
- Beck, T. , & Hall, M. N. (1999). The TOR signalling pathway controls nuclear localization of nutrient‐regulated transcription factors. Nature, 402(6762), 689–692. 10.1038/45287 [DOI] [PubMed] [Google Scholar]
- Binda, M. , Péli‐Gulli, M.‐P. , Bonfils, G. , Panchaud, N. , Urban, J. , Sturgill, T. W. , … De Virgilio, C. (2009). The Vam6 GEF controls TORC1 by activating the EGO complex. Molecular Cell, 35(5), 563–573. 10.1016/j.molcel.2009.06.033 [DOI] [PubMed] [Google Scholar]
- Bjedov, I. , Toivonen, J. M. , Kerr, F. , Slack, C. , Jacobson, J. , Foley, A. , & Partridge, L. (2010). Mechanisms of life span extension by rapamycin in the fruit fly Drosophila melanogaster . Cell Metabolism, 11(1), 35–46. 10.1016/j.cmet.2009.11.010 [DOI] [PMC free article] [PubMed] [Google Scholar]
- Capieaux, E. , Vignais, M. L. , Sentenac, A. , & Goffeau, A. (1989). The yeast H+‐ATPase gene is controlled by the promoter binding factor TUF. Journal of Biological Chemistry, 264(13), 7437–7446. [PubMed] [Google Scholar]
- Chang, A. , & Slayman, C. W. (1991). Maturation of the yeast plasma membrane [H+]ATPase involves phosphorylation during intracellular transport. Journal of Cell Biology, 115(2), 289–295. [DOI] [PMC free article] [PubMed] [Google Scholar]
- Colwill, K. , Pawson, T. , Andrews, B. , Prasad, J. , Manley, J. L. , Bell, J. C. , & Duncan, P. I. (1996). The Clk/Sty protein kinase phosphorylates SR splicing factors and regulates their intranuclear distribution. EMBO Journal, 15(2), 265–275. [PMC free article] [PubMed] [Google Scholar]
- Dang, W. , Steffen, K. K. , Perry, R. , Dorsey, J. A. , Johnson, F. B. , Shilatifard, A. , … Berger, S. L. (2009). Histone H4 lysine 16 acetylation regulates cellular lifespan. Nature, 459(7248), 802–807. 10.1038/nature08085 [DOI] [PMC free article] [PubMed] [Google Scholar]
- Dechant, R. , Binda, M. , Lee, S. S. , Pelet, S. , Winderickx, J. , & Peter, M. (2010). Cytosolic pH is a second messenger for glucose and regulates the PKA pathway through V‐ATPase. The EMBO Journal, 29(15), 2515–2526. 10.1038/emboj.2010.138 [DOI] [PMC free article] [PubMed] [Google Scholar]
- Dechant, R. , Saad, S. , Ibanez, A. J. , & Peter, M. (2014). Cytosolic pH regulates cell growth through distinct GTPases, Arf1 and Gtr1, to promote Ras/PKA and TORC1 activity. Molecular Cell, 55(3), 409–421. 10.1016/j.molcel.2014.06.002 [DOI] [PubMed] [Google Scholar]
- Delaney, J. R. , Murakami, C. J. , Olsen, B. , Kennedy, B. K. , & Kaeberlein, M. (2011). Quantitative evidence for early life fitness defects from 32 longevity‐associated alleles in yeast. Cell Cycle, 10(1), 156–165. 10.4161/cc.10.1.14457 [DOI] [PMC free article] [PubMed] [Google Scholar]
- Deprez, M. A. , Eskes, E. , Wilms, T. , Ludovico, P. , & Winderickx, J. (2018). pH homeostasis links the nutrient sensing PKA/TORC1/Sch9 menage‐a‐trois to stress tolerance and longevity. Microb Cell, 5(3), 119–136. 10.15698/mic2018.03.618 [DOI] [PMC free article] [PubMed] [Google Scholar]
- Di Como, C. J. , & Arndt, K. T. (1996). Nutrients, via the Tor proteins, stimulate the association of Tap42 with type 2A phosphatases. Genes & Development, 10(15), 1904–1916. [DOI] [PubMed] [Google Scholar]
- Dilova, I. , Easlon, E. , & Lin, S. J. (2007). Calorie restriction and the nutrient sensing signaling pathways. Cellular and Molecular Life Sciences, 64(6), 752–767. 10.1007/s00018-007-6381-y [DOI] [PMC free article] [PubMed] [Google Scholar]
- Du, C. , McGuffin, M. E. , Dauwalder, B. , Rabinow, L. , & Mattox, W. (1998). Protein phosphorylation plays an essential role in the regulation of alternative splicing and sex determination in Drosophila . Molecular Cell, 2(6), 741–750. [DOI] [PubMed] [Google Scholar]
- Efeyan, A. , Zoncu, R. , Chang, S. , Gumper, I. , Snitkin, H. , Wolfson, R. L. , … Sabatini, D. M. (2013). Regulation of mTORC1 by the Rag GTPases is necessary for neonatal autophagy and survival. Nature, 493(7434), 679–683. 10.1038/nature11745 [DOI] [PMC free article] [PubMed] [Google Scholar]
- Eraso, P. , & Portillo, F. (1994). Molecular mechanism of regulation of yeast plasma membrane H(+)‐ATPase by glucose. Interaction between domains and identification of new regulatory sites. Journal of Biological Chemistry, 269(14), 10393–10399. [PubMed] [Google Scholar]
- Forgac, M. (2007). Vacuolar ATPases: Rotary proton pumps in physiology and pathophysiology. Nature Reviews Molecular Cell Biology, 8(11), 917–929. 10.1038/nrm2272 [DOI] [PubMed] [Google Scholar]
- Gao, M. , & Kaiser, C. A. (2006). A conserved GTPase‐containing complex is required for intracellular sorting of the general amino‐acid permease in yeast. Nature Cell Biology, 8(7), 657–667. 10.1038/ncb1419 [DOI] [PubMed] [Google Scholar]
- Ghosh, H. S. , McBurney, M. , & Robbins, P. D. (2010). SIRT1 negatively regulates the mammalian target of rapamycin. PLoS ONE, 5(2), e9199 10.1371/journal.pone.0009199 [DOI] [PMC free article] [PubMed] [Google Scholar]
- Gietz, R. D. , & Schiestl, R. H. (2007). High‐efficiency yeast transformation using the LiAc/SS carrier DNA/PEG method. Nature Protocols, 2(1), 31–34. 10.1038/nprot.2007.13 [DOI] [PubMed] [Google Scholar]
- Gorner, W. , Durchschlag, E. , Martinez‐Pastor, M. T. , Estruch, F. , Ammerer, G. , Hamilton, B. , … Schuller, C. (1998). Nuclear localization of the C2H2 zinc finger protein Msn2p is regulated by stress and protein kinase A activity. Genes & Development, 12(4), 586–597. [DOI] [PMC free article] [PubMed] [Google Scholar]
- Guo, W. , Qian, L. , Zhang, J. , Zhang, W. , Morrison, A. , Hayes, P. , … Zhao, J. (2011). Sirt1 overexpression in neurons promotes neurite outgrowth and cell survival through inhibition of the mTOR signaling. Journal of Neuroscience Research, 89(11), 1723–1736. 10.1002/jnr.22725 [DOI] [PubMed] [Google Scholar]
- Ha, C. W. , & Huh, W. K. (2011). Rapamycin increases rDNA stability by enhancing association of Sir2 with rDNA in Saccharomyces cerevisiae. Nucleic Acids Research, 39(4), 1336–1350. 10.1093/nar/gkq895 [DOI] [PMC free article] [PubMed] [Google Scholar]
- Harrison, D. E. , Strong, R. , Sharp, Z. D. , Nelson, J. F. , Astle, C. M. , Flurkey, K. , … Miller, R. A. (2009). Rapamycin fed late in life extends lifespan in genetically heterogeneous mice. Nature, 460(7253), 392–395. 10.1038/nature08221 [DOI] [PMC free article] [PubMed] [Google Scholar]
- He, C. , Zhou, C. , & Kennedy, B. K. (2018). The yeast replicative aging model. Biochimica Et Biophysica Acta (BBA) – Molecular Basis of Disease, 1864(9), 2690–2696. 10.1016/j.bbadis.2018.02.023 [DOI] [PubMed] [Google Scholar]
- Henderson, K. A. , Hughes, A. L. , & Gottschling, D. E. (2014). Mother‐daughter asymmetry of pH underlies aging and rejuvenation in yeast. Elife, 3, e03504 10.7554/eLife.03504 [DOI] [PMC free article] [PubMed] [Google Scholar]
- Hombauer, H. , Weismann, D. , Mudrak, I. , Stanzel, C. , Fellner, T. , Lackner, D. H. , & Ogris, E. (2007). Generation of active protein phosphatase 2A is coupled to holoenzyme assembly. PLoS Biology, 5(6), e155 10.1371/journal.pbio.0050155 [DOI] [PMC free article] [PubMed] [Google Scholar]
- Huang, J. , & Moazed, D. (2003). Association of the RENT complex with nontranscribed and coding regions of rDNA and a regional requirement for the replication fork block protein Fob1 in rDNA silencing. Genes & Development, 17(17), 2162–2176. 10.1101/gad.1108403 [DOI] [PMC free article] [PubMed] [Google Scholar]
- Hughes, A. L. , & Gottschling, D. E. (2012). An early age increase in vacuolar pH limits mitochondrial function and lifespan in yeast. Nature, 492(7428), 261–265. 10.1038/nature11654 [DOI] [PMC free article] [PubMed] [Google Scholar]
- Jacinto, E. , Guo, B. , Arndt, K. T. , Schmelzle, T. , & Hall, M. N. (2001). TIP41 interacts with TAP42 and negatively regulates the TOR signaling pathway. Molecular Cell, 8(5), 1017–1026. [DOI] [PubMed] [Google Scholar]
- Jiang, Y. , & Broach, J. R. (1999). Tor proteins and protein phosphatase 2A reciprocally regulate Tap42 in controlling cell growth in yeast. EMBO Journal, 18(10), 2782–2792. 10.1093/emboj/18.10.2782 [DOI] [PMC free article] [PubMed] [Google Scholar]
- Jorgensen, P. , Rupes, I. , Sharom, J. R. , Schneper, L. , Broach, J. R. , & Tyers, M. (2004). A dynamic transcriptional network communicates growth potential to ribosome synthesis and critical cell size. Genes & Development, 18(20), 2491–2505. 10.1101/gad.1228804 [DOI] [PMC free article] [PubMed] [Google Scholar]
- Kaeberlein, M. , Kirkland, K. T. , Fields, S. , & Kennedy, B. K. (2004). Sir2‐independent life span extension by calorie restriction in yeast. PLoS Biology, 2(9), E296 10.1371/journal.pbio.0020296 [DOI] [PMC free article] [PubMed] [Google Scholar]
- Kaeberlein, M. , McVey, M. , & Guarente, L. (1999). The SIR2/3/4 complex and SIR2 alone promote longevity in Saccharomyces cerevisiae by two different mechanisms. Genes & Development, 13(19), 2570–2580. [DOI] [PMC free article] [PubMed] [Google Scholar]
- Kaeberlein, M. , Powers, R. W. 3rd , Steffen, K. K. , Westman, E. A. , Hu, D. , Dang, N. , … Kennedy, B. K. (2005). Regulation of yeast replicative life span by TOR and Sch9 in response to nutrients. Science, 310(5751), 1193–1196. 10.1126/science.1115535 [DOI] [PubMed] [Google Scholar]
- Kane, P. M. (1995). Disassembly and reassembly of the yeast vacuolar H(+)‐ATPase in vivo. Journal of Biological Chemistry, 270(28), 17025–17032. [PubMed] [Google Scholar]
- Kane, P. M. (2006). The where, when, and how of organelle acidification by the yeast vacuolar H+‐ATPase. Microbiology and Molecular Biology Reviews, 70(1), 177–191. 10.1128/MMBR.70.1.177-191.2006 [DOI] [PMC free article] [PubMed] [Google Scholar]
- Kang, W. K. , Kim, Y. H. , Kang, H. A. , Kwon, K. S. , & Kim, J. Y. (2015). Sir2 phosphorylation through cAMP‐PKA and CK2 signaling inhibits the lifespan extension activity of Sir2 in yeast. Elife, 4, 10.7554/eLife.09709 [DOI] [PMC free article] [PubMed] [Google Scholar]
- Keith, C. T. , & Schreiber, S. L. (1995). PIK‐related kinases: DNA repair, recombination, and cell cycle checkpoints. Science, 270(5233), 50–51. [DOI] [PubMed] [Google Scholar]
- Kim, E. , Goraksha‐Hicks, P. , Li, L. , Neufeld, T. P. , & Guan, K. L. (2008). Regulation of TORC1 by Rag GTPases in nutrient response. Nature Cell Biology, 10(8), 935–945. 10.1038/ncb1753 [DOI] [PMC free article] [PubMed] [Google Scholar]
- Lecchi, S. , Nelson, C. J. , Allen, K. E. , Swaney, D. L. , Thompson, K. L. , Coon, J. J. , … Slayman, C. W. (2007). Tandem phosphorylation of Ser‐911 and Thr‐912 at the C terminus of yeast plasma membrane H+‐ATPase leads to glucose‐dependent activation. Journal of Biological Chemistry, 282(49), 35471–35481. 10.1074/jbc.M706094200 [DOI] [PubMed] [Google Scholar]
- Lee, J. , Moir, R. D. , McIntosh, K. B. , & Willis, I. M. (2012). TOR signaling regulates ribosome and tRNA synthesis via LAMMER/Clk and GSK‐3 family kinases. Molecular Cell, 45(6), 836–843. 10.1016/j.molcel.2012.01.018 [DOI] [PMC free article] [PubMed] [Google Scholar]
- Loewith, R. , & Hall, M. N. (2011). Target of rapamycin (TOR) in nutrient signaling and growth control. Genetics, 189(4), 1177–1201. 10.1534/genetics.111.133363 [DOI] [PMC free article] [PubMed] [Google Scholar]
- Mahmoud, S. , Planes, M. D. , Cabedo, M. , Trujillo, C. , Rienzo, A. , Caballero‐Molada, M. , … Serrano, R. (2017). TOR complex 1 regulates the yeast plasma membrane proton pump and pH and potassium homeostasis. FEBS Letters, 591(13), 1993–2002. 10.1002/1873-3468.12673 [DOI] [PubMed] [Google Scholar]
- Martin, D. E. , Demougin, P. , Hall, M. N. , & Bellis, M. (2004). Rank difference analysis of microarrays (RDAM), a novel approach to statistical analysis of microarray expression profiling data. BMC Bioinformatics, 5, 148 10.1186/1471-2105-5-148 [DOI] [PMC free article] [PubMed] [Google Scholar]
- Martinez‐Munoz, G. A. , & Kane, P. (2008). Vacuolar and plasma membrane proton pumps collaborate to achieve cytosolic pH homeostasis in yeast. Journal of Biological Chemistry, 283(29), 20309–20319. 10.1074/jbc.M710470200 [DOI] [PMC free article] [PubMed] [Google Scholar]
- Mazon, M. J. , Eraso, P. , & Portillo, F. (2015). Specific phosphoantibodies reveal two phosphorylation sites in yeast Pma1 in response to glucose. FEMS Yeast Research, 15(5), fov030 10.1093/femsyr/fov030 [DOI] [PubMed] [Google Scholar]
- Medvedik, O. , Lamming, D. W. , Kim, K. D. , & Sinclair, D. A. (2007). MSN2 and MSN4 link calorie restriction and TOR to sirtuin‐mediated lifespan extension in Saccharomyces cerevisiae. PLoS Biology, 5(10), e261 10.1371/journal.pbio.0050261 [DOI] [PMC free article] [PubMed] [Google Scholar]
- Morsomme, P. , Slayman, C. W. , & Goffeau, A. (2000). Mutagenic study of the structure, function and biogenesis of the yeast plasma membrane H(+)‐ATPase. Biochimica Et Biophysica Acta, 1469(3), 133–157. [DOI] [PubMed] [Google Scholar]
- Nakashima, N. , Noguchi, E. , & Nishimoto, T. (1999). Saccharomyces cerevisiae putative G protein, Gtr1p, which forms complexes with itself and a novel protein designated as Gtr2p, negatively regulates the Ran/Gsp1p G protein cycle through Gtr2p. Genetics, 152(3), 853–867. [DOI] [PMC free article] [PubMed] [Google Scholar]
- Nikolakaki, E. , Du, C. , Lai, J. , Giannakouros, T. , Cantley, L. , & Rabinow, L. (2002). Phosphorylation by LAMMER protein kinases: Determination of a consensus site, identification of in vitro substrates, and implications for substrate preferences. Biochemistry, 41(6), 2055–2066. [DOI] [PubMed] [Google Scholar]
- Orij, R. , Brul, S. , & Smits, G. J. (2011). Intracellular pH is a tightly controlled signal in yeast. Biochimica Et Biophysica Acta, 1810(10), 933–944. 10.1016/j.bbagen.2011.03.011 [DOI] [PubMed] [Google Scholar]
- Parra, K. J. , Chan, C. Y. , & Chen, J. (2014). Saccharomyces cerevisiae vacuolar H+‐ATPase regulation by disassembly and reassembly: One structure and multiple signals. Eukaryotic Cell, 13(6), 706–714. 10.1128/EC.00050-14 [DOI] [PMC free article] [PubMed] [Google Scholar]
- Pedruzzi, I. , Dubouloz, F. , Cameroni, E. , Wanke, V. , Roosen, J. , Winderickx, J. , & De Virgilio, C. (2003). TOR and PKA signaling pathways converge on the protein kinase Rim15 to control entry into G0. Molecular Cell, 12(6), 1607–1613. [DOI] [PubMed] [Google Scholar]
- Portillo, F. (2000). Regulation of plasma membrane H(+)‐ATPase in fungi and plants. Biochimica Et Biophysica Acta, 1469(1), 31–42. [DOI] [PubMed] [Google Scholar]
- Powers, R. W. 3rd , Kaeberlein, M. , Caldwell, S. D. , Kennedy, B. K. , & Fields, S. (2006). Extension of chronological life span in yeast by decreased TOR pathway signaling. Genes & Development, 20(2), 174–184. 10.1101/gad.1381406 [DOI] [PMC free article] [PubMed] [Google Scholar]
- Powis, K. , & De Virgilio, C. (2016). Conserved regulators of Rag GTPases orchestrate amino acid‐dependent TORC1 signaling. Cell Discov, 2, 15049 10.1038/celldisc.2015.49 [DOI] [PMC free article] [PubMed] [Google Scholar]
- Prouteau, M. , Desfosses, A. , Sieben, C. , Bourgoint, C. , Lydia Mozaffari, N. , Demurtas, D. , … Loewith, R. (2017). TORC1 organized in inhibited domains (TOROIDs) regulate TORC1 activity. Nature, 550(7675), 265–269. 10.1038/nature24021 [DOI] [PMC free article] [PubMed] [Google Scholar]
- Ramachandran, V. , Shah, K. H. , & Herman, P. K. (2011). The cAMP‐dependent protein kinase signaling pathway is a key regulator of P body foci formation. Molecular Cell, 43(6), 973–981. 10.1016/j.molcel.2011.06.032 [DOI] [PMC free article] [PubMed] [Google Scholar]
- Rao, R. , Drummond‐Barbosa, D. , & Slayman, C. W. (1993). Transcriptional regulation by glucose of the yeast PMA1 gene encoding the plasma membrane H(+)‐ATPase. Yeast, 9(10), 1075–1084. 10.1002/yea.320091006 [DOI] [PubMed] [Google Scholar]
- Rogina, B. , & Helfand, S. L. (2004). Sir2 mediates longevity in the fly through a pathway related to calorie restriction. Proceedings of the National Academy of Sciences, 101(45), 15998–16003. 10.1073/pnas.0404184101 [DOI] [PMC free article] [PubMed] [Google Scholar]
- Sancak, Y. , Peterson, T. R. , Shaul, Y. D. , Lindquist, R. A. , Thoreen, C. C. , Bar‐Peled, L. , & Sabatini, D. M. (2008). The Rag GTPases bind raptor and mediate amino acid signaling to mTORC1. Science, 320(5882), 1496–1501. 10.1126/science.1157535 [DOI] [PMC free article] [PubMed] [Google Scholar]
- Sanchez‐Casalongue, M. E. , Lee, J. , Diamond, A. , Shuldiner, S. , Moir, R. D. , & Willis, I. M. (2015). Differential phosphorylation of a regulatory subunit of protein kinase CK2 by target of rapamycin complex 1 signaling and the Cdc‐like kinase Kns1. Journal of Biological Chemistry, 290(11), 7221–7233. 10.1074/jbc.M114.626523 [DOI] [PMC free article] [PubMed] [Google Scholar]
- Sankaranarayanan, S. , De Angelis, D. , Rothman, J. E. , & Ryan, T. A. (2000). The use of pHluorins for optical measurements of presynaptic activity. Biophysical Journal, 79(4), 2199–2208. 10.1016/S0006-3495(00)76468-X [DOI] [PMC free article] [PubMed] [Google Scholar]
- Satoh, A. , Brace, C. S. , Rensing, N. , Cliften, P. , Wozniak, D. F. , Herzog, E. D. , … Imai, S.‐I. (2013). Sirt1 extends life span and delays aging in mice through the regulation of Nk2 homeobox 1 in the DMH and LH. Cell Metabolism, 18(3), 416–430. 10.1016/j.cmet.2013.07.013 [DOI] [PMC free article] [PubMed] [Google Scholar]
- Schmelzle, T. , Beck, T. , Martin, D. E. , & Hall, M. N. (2004). Activation of the RAS/cyclic AMP pathway suppresses a TOR deficiency in yeast. Molecular and Cellular Biology, 24(1), 338–351. [DOI] [PMC free article] [PubMed] [Google Scholar]
- Schmelzle, T. , & Hall, M. N. (2000). TOR, a central controller of cell growth. Cell, 103(2), 253–262. [DOI] [PubMed] [Google Scholar]
- Serrano, R. (1983). In vivo glucose activation of the yeast plasma membrane ATPase. FEBS Letters, 156(1), 11–14. [DOI] [PubMed] [Google Scholar]
- Serrano, R. , Kielland‐Brandt, M. C. , & Fink, G. R. (1986). Yeast plasma membrane ATPase is essential for growth and has homology with (Na+ + K+), K+‐ and Ca2+‐ATPases. Nature, 319(6055), 689–693. 10.1038/319689a0 [DOI] [PubMed] [Google Scholar]
- Soulard, A. , Cremonesi, A. , Moes, S. , Schutz, F. , Jeno, P. , & Hall, M. N. (2010). The rapamycin‐sensitive phosphoproteome reveals that TOR controls protein kinase A toward some but not all substrates. Molecular Biology of the Cell, 21(19), 3475–3486. 10.1091/mbc.E10-03-0182 [DOI] [PMC free article] [PubMed] [Google Scholar]
- Stephan, J. S. , Yeh, Y. Y. , Ramachandran, V. , Deminoff, S. J. , & Herman, P. K. (2009). The Tor and PKA signaling pathways independently target the Atg1/Atg13 protein kinase complex to control autophagy. Proceedings of the National Academy of Sciences of the United States of America, 106(40), 17049–17054. 10.1073/pnas.0903316106 [DOI] [PMC free article] [PubMed] [Google Scholar]
- Tissenbaum, H. A. , & Guarente, L. (2001). Increased dosage of a sir‐2 gene extends lifespan in Caenorhabditis elegans. Nature, 410(6825), 227–230. 10.1038/35065638 [DOI] [PubMed] [Google Scholar]
- Ukai, H. , Araki, Y. , Kira, S. , Oikawa, Y. , May, A. I. , & Noda, T. (2018). Gtr/Ego‐independent TORC1 activation is achieved through a glutamine‐sensitive interaction with Pib2 on the vacuolar membrane. PLoS Genetics, 14(4), e1007334 10.1371/journal.pgen.1007334 [DOI] [PMC free article] [PubMed] [Google Scholar]
- Varlakhanova, N. V. , Mihalevic, M. J. , Bernstein, K. A. , & Ford, M. G. J. (2017). Pib2 and the EGO complex are both required for activation of TORC1. Journal of Cell Science, 130(22), 3878–3890. 10.1242/jcs.207910 [DOI] [PMC free article] [PubMed] [Google Scholar]
- Wilms, T. , Swinnen, E. , Eskes, E. , Dolz‐Edo, L. , Uwineza, A. , Van Essche, R. , … Winderickx, J. (2017). The yeast protein kinase Sch9 adjusts V‐ATPase assembly/disassembly to control pH homeostasis and longevity in response to glucose availability. PLoS Genetics, 13(6), e1006835 10.1371/journal.pgen.1006835 [DOI] [PMC free article] [PubMed] [Google Scholar]
- Workman, J. J. , Chen, H. , & Laribee, R. N. (2016). Saccharomyces cerevisiae TORC1 controls histone acetylation by signaling through the Sit4/PP6 phosphatase to regulate sirtuin deacetylase nuclear accumulation. Genetics, 203(4), 1733–1746. 10.1534/genetics.116.188458 [DOI] [PMC free article] [PubMed] [Google Scholar]
Associated Data
This section collects any data citations, data availability statements, or supplementary materials included in this article.
Supplementary Materials
Supinfo
Data Availability Statement
The data that support the findings of this study are available from the corresponding author upon reasonable request.