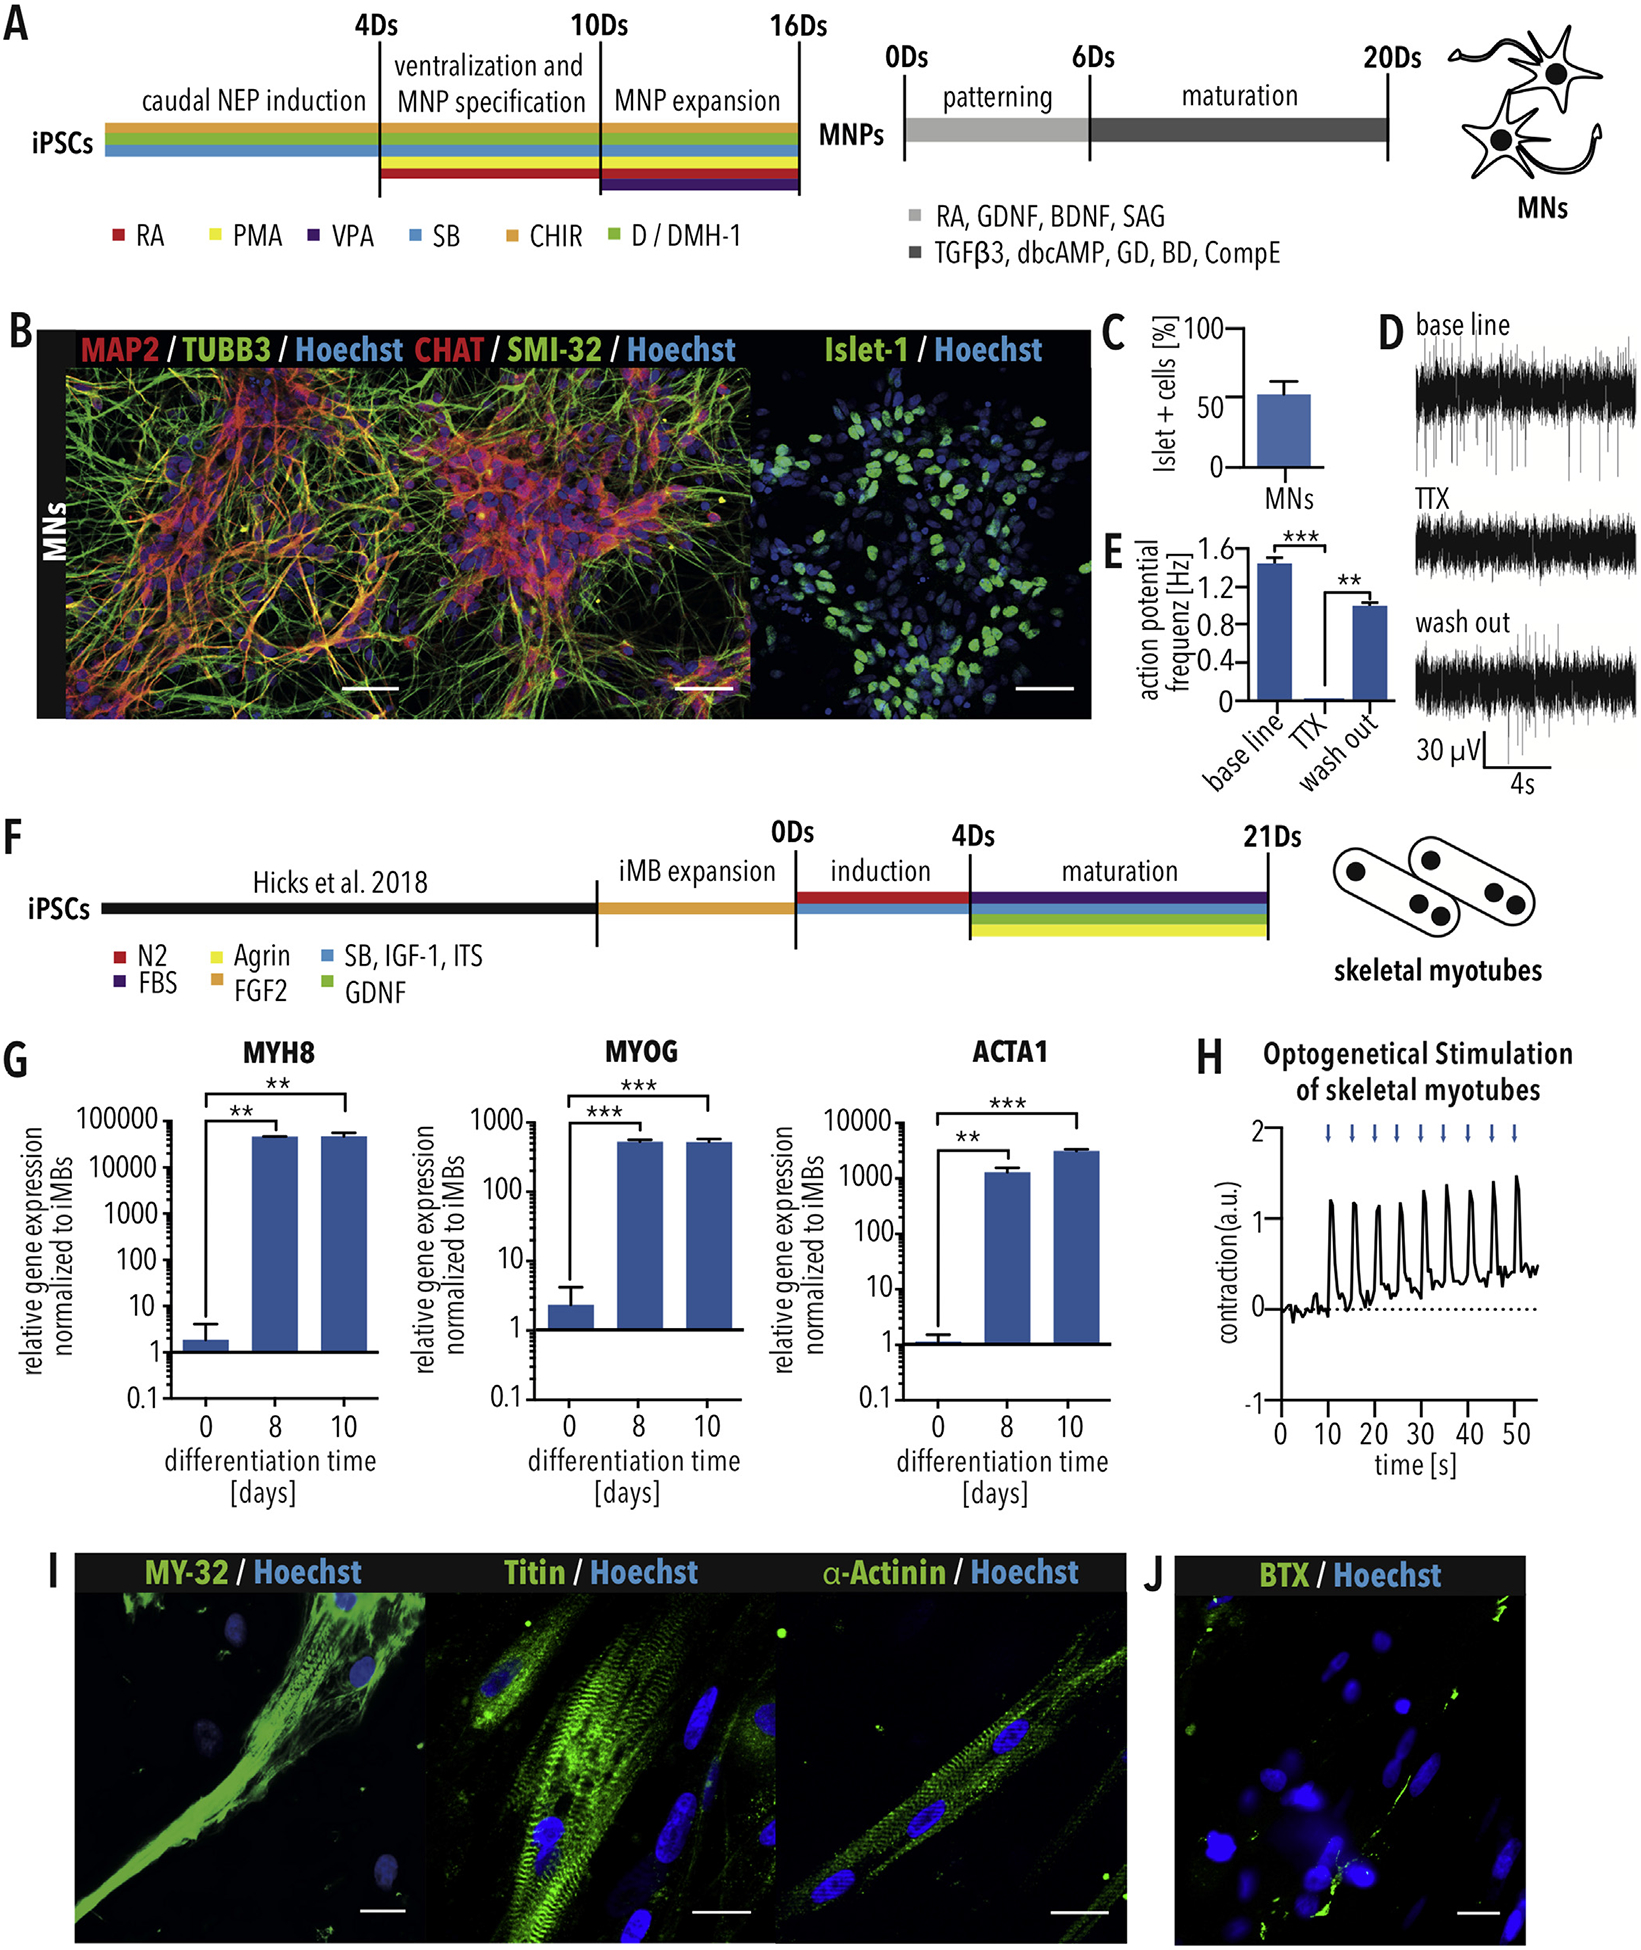
Fig. 1.

Derivation of MNs and skeletal myotubes from iPSCs (A) Schematic of MN differentiation protocol. MNPs = motor neuron progenitors. (B) Immunostaining of iPSC-derived MNs for the neuronal markers MAP2 and TUBB3 and the MN markers CHAT, SMI-32 and Islet-1. Scale bar = 50 μm. (C) Quantification of MN differentiation efficiency using Islet-1 immunostaining. n = 3. Error bars show SEM. (D) Multi-electrode array recording of MNs showing spontaneous activity (base line), which can be blocked using 1 μM tetrodotoxin (TTX) treatment and recovered by washing out (E) Quantification of action potential frequency shows significant effect of TTX, which proves electrical activity of neurons. (F) Schematic of skeletal myotube differentiation protocol. Bars indicated SEM. ** and *** indicate p < 0.01 and 0.001, respectively, according to t-test. (G) Quantitative RT-PCR showing increased expression of the indicated skeletal myotube markers. Bars indicated SEM. * and ** indicate p < 0.05 and 0.01, respectively, according to one-way ANOVA and Dunnett’s multiple comparisons test. (H) Myotube contraction after contraction optogenetic stimulation using ChR2-EYFP with 20 ms blue light pulses (475 nm) at 0.2 Hz. (I) Skeletal myotubes differentiated from myoblasts show skeletal muscle marker expression (MY-32, titin, α-actinin) and striation. Scale bar = 25 μm. (J) Skeletal myotubes display acetylcholine receptor clusters visualized with fluorescently conjugated α-bungarotoxin (BTX). (For interpretation of the references to colour in this figure legend, the reader is referred to the Web version of this article.)
