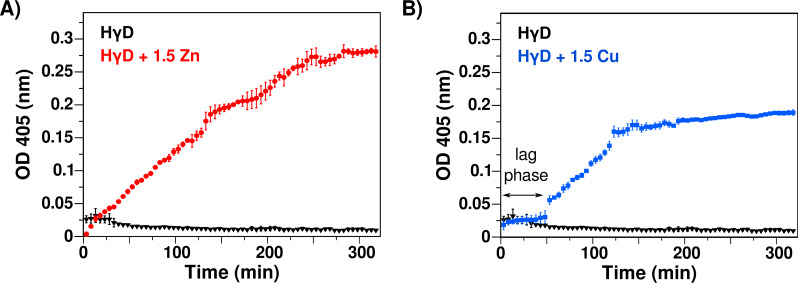
Figure 2. Effect of Zn(II) and Cu(II) as reported by turbidity assays at 37 °C.
(A) Absorbance at 405 nm as function of time of HγD crystallin in the absence (black line) and presence of 1.5 equivalents of Zn(II) (red). (B) HγD crystallin in the absence (black line) and presence of 1.5 equivalents of Cu(II) (blue). The lag phase for copper is shown. The change in absorbance is due to the formation of aggregates that scatter the light.

