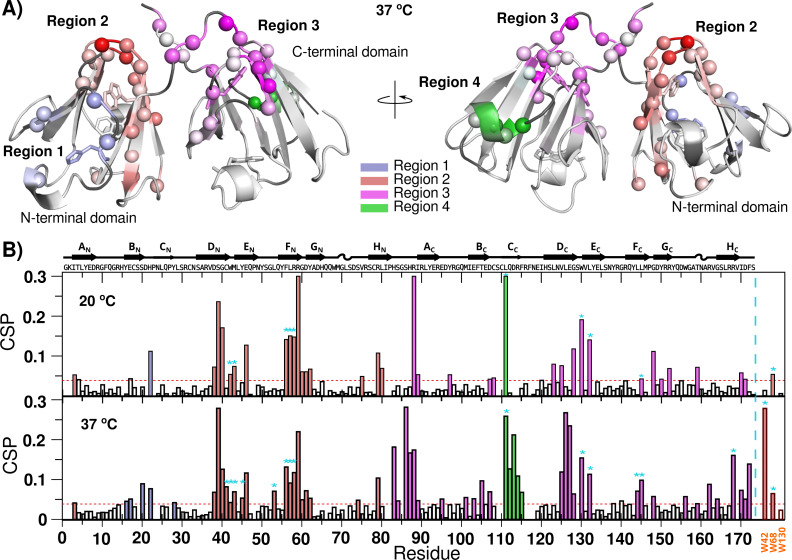
Figure 5. Zn(II) binding to HγD crystallin as detected by NMR.
(A) HγD chemical shift changes induced by the binding to Zn(II) at 37 °C mapped onto the protein structure (1HK0). Different regions are color-coded with a linear gradient from light (small CSP changes) to dark (largest CSP changes): region 1 (blue), region 2 (red), region 3 (purple), and region 4 (green). Unassigned residues are shown in dark gray. Residues H22, W42, W68, W130 and W156 are shown as sticks (B) HγD Chemical Shift Perturbation (CSP) after the addition of Zn(II) at 20 °C and 37 °C. Bars have been color-coded based on affected regions as described above. Cyan asterisks show buried residues that suffer significant changes. Sidechain CSP for W42, W68 and W130 are shown at the far right. Possible binding sites are shown in Fig. S11.

