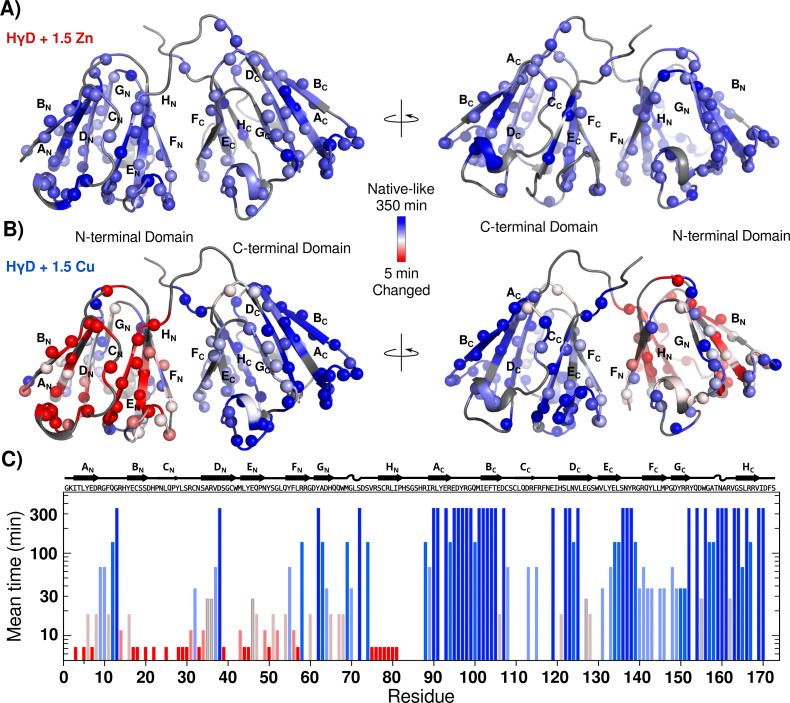
Figure 6. HγD conformational changes induced by metal ions followed by real time NMR.
(A) Intensity mean time changes mapped onto the crystal structure of HγD crystallin (1HK0) and color-coded based on the profiles with a linear gradient ramp from dark blue (no changes) to red (small mean time), for (A) Zn(II) and (B) Cu(II). Unassigned residues are shown in dark gray. (C) Intensity mean-time changes (I/Io profiles) for the HSQC signals over time for each residue with 1.5 equivalents of Cu(II).

