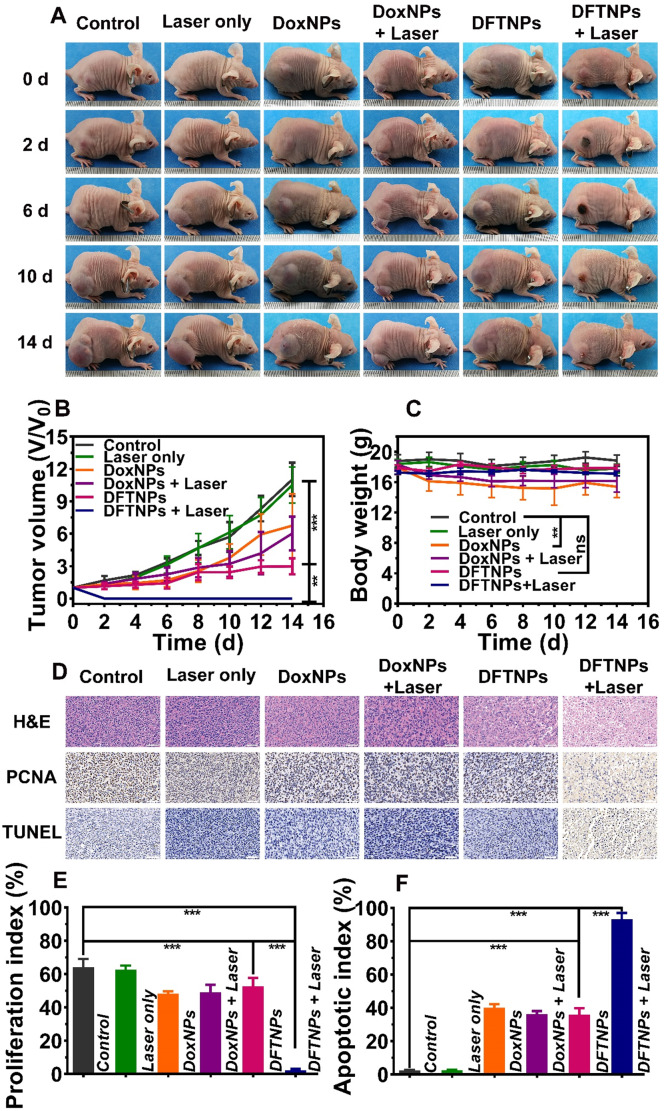
Figure 6.
In vivo chemo-photothermal synergistic therapy. (A) Photographs of MDA-MB-231 tumor-bearing mice of six groups during 14 d period treatments. (B) Relative tumor volume after various treatments of six groups. (C) Body weight change in various groups. (D) H&E, PCNA and TUNEL staining on tumor sections collected from MDA-MB-231 tumor-bearing mice after various treatments. The scale bar is 50 μm. (E) Quantitative proliferation index of tumors from different groups. (F) Quantitative apoptotic index of tumors from different groups.

