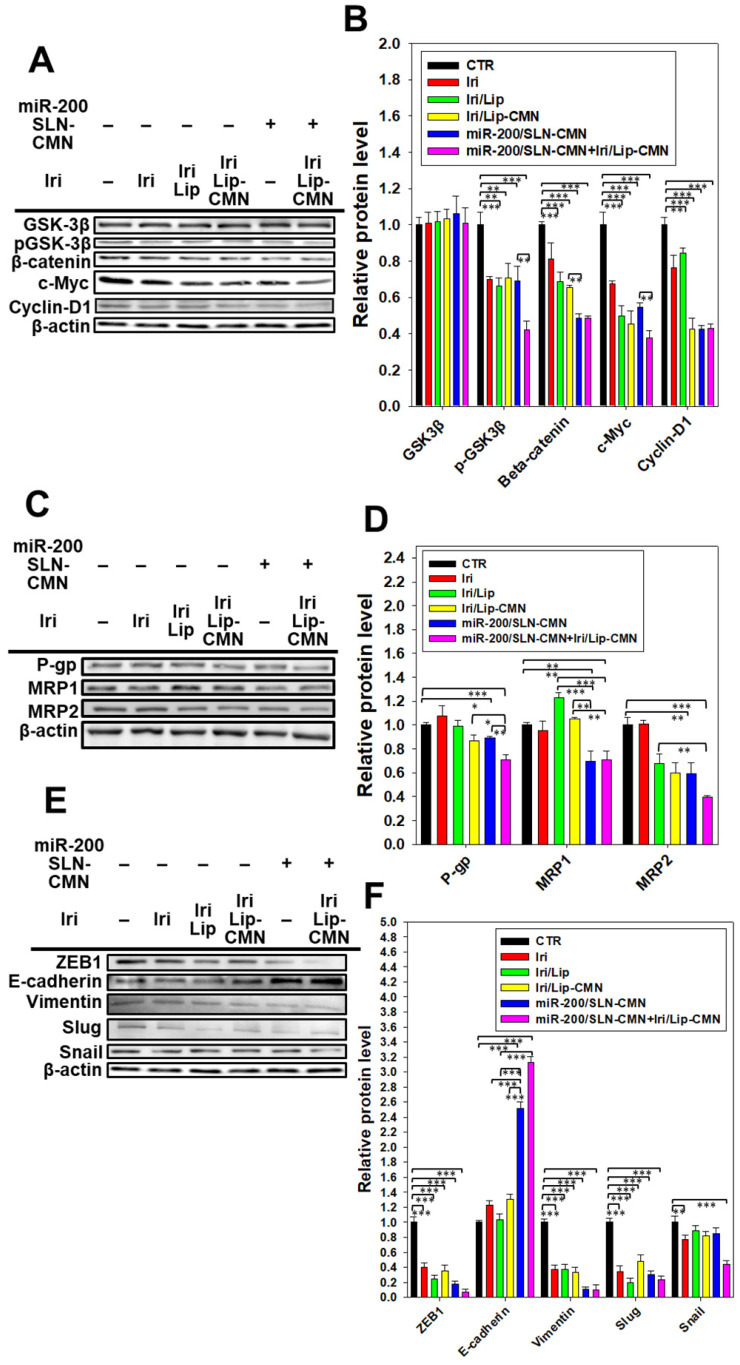
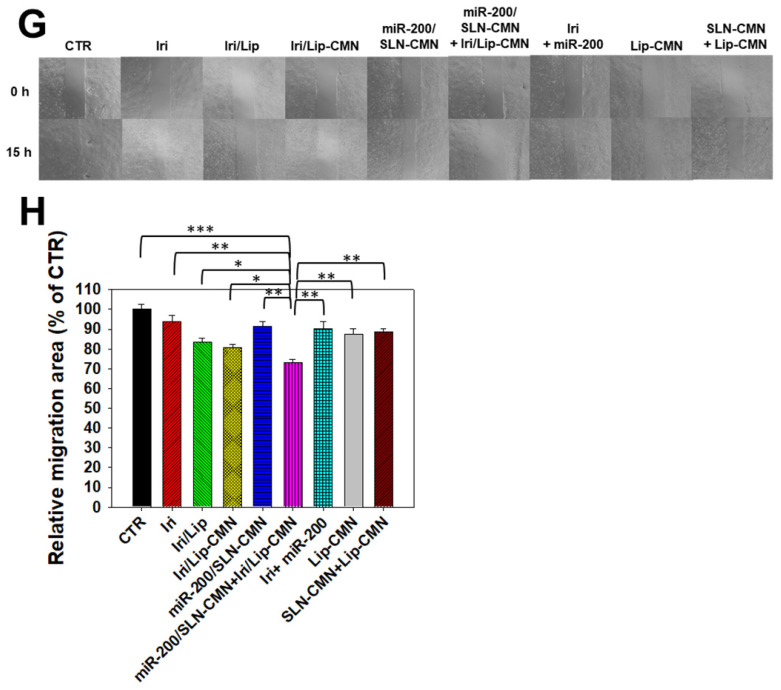
Figure 6.
Effects of different formulations on diverse signaling pathways and relative migration percentage in SAS cells. SAS cells were pretreated with miR-200/SLN-CMN (100 nM) for 24 h and then with Iri or Iri/Lip-CMN (SAS = 0.7 μM) for 48 h. The protein expression levels of (A-B) Wnt/β-catenin, (C-D) MDR, and (E-F) EMT pathways were determined by Western blotting. (G) Cells were pretreated with different formulations for 15 h before the images were taken. (H) Quantification of the relative percentage of cell-migration area (*statistical significance at P < 0.05; **P < 0.01; ***P < 0.001).


