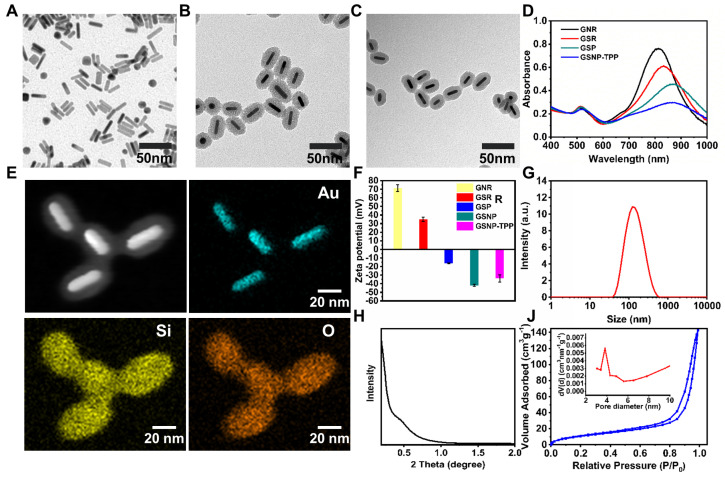
Figure 2.
A-C) TEM images of GNR, GSR and GSNP-TPP. D) UV-vis absorption spectrum of GNR, GSR, GSP and GSNP-TPP. E) Energy-dispersive X-ray mapping images of GSNP-TPP. The element maps shows the distribution of Au (blue), Si (yellow) and O (orange). F) Zeta potential of GNR, GSR, GSNP and GSNP-TPP. G) Hydrated particle size of GSNP-TPP. H) Small-angel X-ray diffraction curve of Au@SiO2. J) N2 adsorption/desorption isotherms and pore size distribution (inset) plots.

