Figure 3.
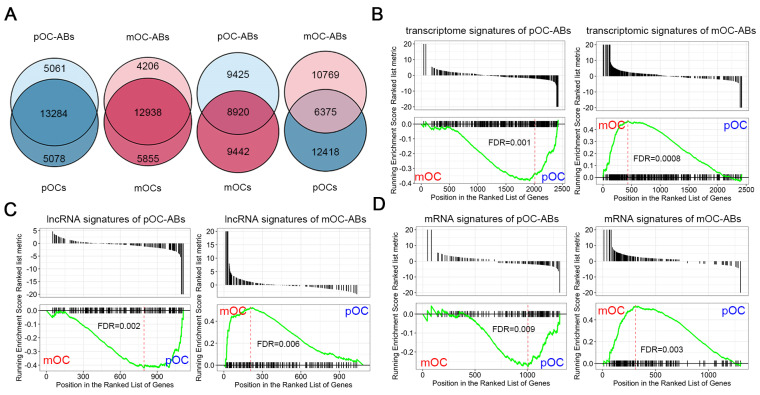
Transcriptional similarities of osteoclast derived ABs with their parental cells. (A) Venn diagram comparing all identified RNAs of the pOC-ABs and mOC-ABs with corresponding parental cell or non-parental cell. Gene set enrichment analysis (GSEA) plots showing the correlation of pOC-ABs and mOC-ABs (B) transcriptome signatures, (C) lncRNA signatures and (D) mRNA signatures with genes expressed in pOC or mOC. The RNA signatures of pOC-ABs preferred to show a pOC-phenotype, while signatures of mOC-ABs preferred to display a mOC-phenotype.

