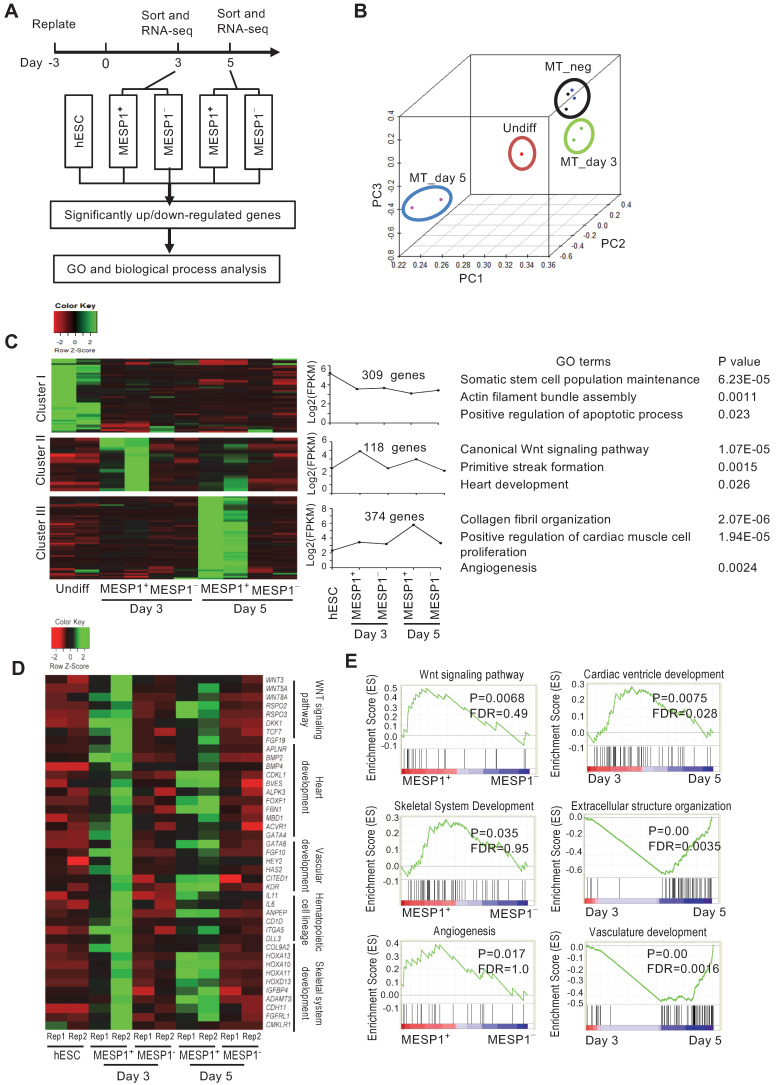
Figure 3.
Transcriptome analysis of MESP1-mTomato+ cardiovascular progenitor cells. (A) Flow chart of MESP1-mTomato cell gene expression analysis. (B) PCA graph showing that hESCs, MESP1-mTomato+ cells at day 3 and 5 (MT_day3, MT_day5), and MESP1-mTomato- cells (MT_neg) were separated from each other. (C) Representative gene expression patterns in day 3 and day 5 MESP1+ cells. The number of genes in each category, representative GO terms and enrichment P values were listed on the right side. (D) Heatmaps showing that many key regulators of cardiovascular development were differentially expressed in day 3 or day 5 MESP1+ cells, including Wnt pathway members, heart development genes, endothelial genes, hematopoietic cell genes and skeletal development genes. (E) GSEA plot of selective biological process enriched in MESP1+ or MESPI- cells, day 3 or day 5 MESP1 cells.

