

Abstract
Objectives
Deconvolution-derived maps of CT perfusion (CTP) data may be confounded by transit delays. We propose temporal similarity perfusion (TSP) analysis to decrease CTP maps’ dependence on transit times and investigate its sensitivity to detect perfusion deficits.
Methods
CTP data of acute stroke patients obtained within 9 h of symptom onset was analyzed using a delay-insensitive singular value decomposition method and with TSP. The TSP method applies an iterative process whereby a pixel’s highest Pearson’s R value is obtained through comparison of a pixel’s time-shifted signal density time-series curve and the average whole brain signal density time-series curve. Our evaluation included a qualitative and quantitative rating of deconvolution maps (MTT, CBV, and TTP), of TSP maps, and of follow-up CT.
Results
Sixty-five patients (mean 68 (SD 13) years, 34 male) were included. A perfusion deficit was identified in 90%, 86%, 65%, and 84% of MTT, TTP, CBV, and TSP maps. The agreement of MTT, TTP, and TSP with CT follow-up was comparable but noticeably lower for CBV. CBV had the best relationship with final infarct volume (R2 = 0.77, p < 0.001), followed by TSP (R2 = 0.63, p < 0.001). Intra-rater agreement of an inexperienced reader was higher for TSP than for CBV/MTT maps (kappa’s of 0.79–0.84 and 0.63–0.7). Inter-rater agreement for experienced readers was comparable across maps.
Conclusions
TSP maps are easier to interpret for inexperienced readers. Perfusion deficits detected by TSP are smaller which may suggest less dependence on transit delays although more investigation is required.
Keywords: Humans, Stroke, Brain ischemia, Perfusion, Tomography, X-ray computed
Introduction
Computed tomography perfusion (CTP) imaging of the brain, which allows for assessment of brain perfusion and perfusion-related parameters, has become a routine clinical imaging protocol for patients suspected of stroke. It has been shown to differentiate stroke mimics from ischemia, and recent guidelines have recommended it to identify stroke patients who may benefit from mechanical thrombectomy but present between 6 and 24 h of last known normal [1, 2].
Computed tomography perfusion maps are derived by measuring the influx of intravenously injected contrast agent into the cerebral vessels. CTP data are processed to generate parametric maps, such as cerebral blood volume (CBV) and time to peak (TTP), which are then interpreted to identify volumes of ischemic core and penumbra, respectively. Despite recent evidence of clinical value for selection of patients for therapy, CTP’s application into daily clinical practice is hampered by a high variability in results generated from the different mathematical algorithms, post-processing packages, and variable image quality. Each CTP software package has its own method to transform the raw perfusion data into parametric maps; variability is introduced with arterial input and venous output function, bolus timing, algorithm, and tracer delay sensitivity [3–6]. In addition, the results of CTP analysis vary with scan parameters including tube voltage, tube current, and temporal resolution [7–9].
In this study, we propose temporal similarity perfusion (TSP) mapping as a new CTP analysis method. The method has been used previously on MR perfusion data [10] and evaluates similarities of signal time-series curves independent of transit delays, and these are reflected by means of the Pearson product-moment correlation coefficient (Pearson’s R). Herewith, normally perfused brain tissue should have a perfusion curve (signal time-series) closely related to the perfusion curve of the rest of the brain, and thus would demonstrate a high correlation (or Pearson’s R value close to 1). Contrary, aberrantly perfused brain tissue will show different signal time-series as compared to the most of the brain and thus low correlation. The main advantages of the method are that (i) correlation analysis is fast, robust, and tolerant of noise and (ii) it allows for analysis of perfusion data independent of transit delays or truncation artifacts, which is cause of most of the inconsistency across software packages [6, 11]. The resulting maps result in anecdotally higher conspicuity of lesions, which may decrease the expertise needed to interpret the results.
The purpose of this study was to investigate the predictability and reliability of the TSP method by evaluating intra- and inter-rater agreement, image quality, and performing qualitative and quantitative comparisons with deconvolution-derived CTP maps and final infarct volume using non-contrast CT imaging (NCCT). We tested the ability of a relatively inexperienced reader, a radiology resident, to interpret both TSP and conventional perfusion maps, which has relevance to the acute care emergency setting in which residents often function as first responders in evaluating potential acute stroke patients.
Methods
Study population
This was a retrospective study for which data was obtained from the DUtch acute STroke study (DUST) [12]. The DUST study was a prospective multicenter cohort study of suspected acute ischemic stroke patients. Patients were included from May 2009 until July 2013 in one of six university hospitals and eight non-university hospitals of The Netherlands. Inclusion criteria for this particular retrospective study were (1) clinical diagnosis of acute ischemic stroke, (2) age > 18 years, (3) admission National Institutes of Health Stroke Scale (NIHSS) ≥ 2 [13], or an indication for intravenous recombinant tissue plasminogen activator (IV-rtPA, e.g., isolated aphasia), (4) stroke symptom onset to imaging < 9 h, (5) discharge diagnosis of ischemic stroke, and (6) CT perfusion imaging on a Philips Healthcare CT. Exclusion criteria were (1) admission CT imaging of the brain excluded acute ischemic stroke as clinical diagnosis, (2) known contrast allergy or previously known renal failure at the time of admission, and (3) patients with wake-up stroke or time from stroke symptom onset to imaging > 9 h.
Ethical approval was obtained from the medical ethics committees of the participating centers. All patients or their legal representatives signed informed consent. If a patient died before consent could be obtained, the need for consent was waived by the medical ethics committee. All imaging and clinical data processed for this analysis was de-identified and delinked by the DUST investigators.
Study design and data collection
Patients included in the DUST study underwent NCCT, CT angiography (CTA), and CTP at admission to the hospital and NCCT approximately 3 days after admission. If a patient was eligible for IV-rtPA, then this was administered in between CTA and CTP imaging. As part of the DUST study [12], baseline and follow-up clinical data were gathered, and lab work was performed. All patients were clinically evaluated by a fellow or vascular neurologist. Of relevance to this particular study were the following variables: age, gender, time of stroke symptom onset, time of arrival at the hospital, time of imaging, stroke severity determined by the admission NIHSS [13], pre-existing functional status (modified Rankin Scale, mRS), follow-up mRS, Alberta stroke program early CT score (ASPECTS) [14] as determined on the NCCT performed at admission, and final infarct volume as determined on the follow-up NCCT. The latter two measurements were assessed blinded by a core lab reader (from a pool of three readers) with established ASPECTS rater reliability statistics [15].
CT imaging protocol
All imaging was performed on 40- to 320-detector CT scanners (Brilliance 40, Brilliance 64, and Brilliance iCT 256, Philips Healthcare). NCCT parameters were 120 kV, 300–375 mAs, and 5-mm reconstructed slice thickness. For CTP imaging, 40 ml of non-ionic contrast material was injected intravenously with a flow of 6 ml/s followed by 40 ml of saline with a flow of 6 ml/s. CTP scans were performed with 80 kV and 150 mAs; images were acquired every 2 s for 50 s after initiation of contrast injection, followed by one image every 30 s from 60 to 210 s. CTP coverage ranged from 40 mm to full brain coverage and covered at least the basal ganglia up to the lateral ventricles. CTP images were reconstructed as 5-mm contiguous axial slices.
CTP deconvolution analysis
CTP deconvolution analysis (delay-insensitive singular value decomposition (SVD)) was performed using commercially available software which relies on the central volume principle (Brain Perfusion v4.5.2, Philips Healthcare). The software applies Gaussian curve fitting by least mean squares to obtain mathematical descriptions of the time-density curves for each pixel [16, 17]. An arterial input function and venous output are selected after which a closed-form deconvolution is applied to create a mean transit time (MTT) map [18]. Time to peak (TTP) is the time to the point of maximum Hounsfield units on the deconvoluted tissue residue function. The cerebral blood volume (CBV) is determined based on the area under the time attenuation curve. The software also provides a cerebral blood flow (CBF) map as output, but given the sensitivity of SVD CBF maps to both arterial-tissue delay and mean transit time, we decided not to incorporate the CBF map into our analysis [19].
Temporal similarity perfusion analysis
Temporal similarity perfusion (TSP) mapping was performed using an in-house script which was built upon AFNI (Analysis of Functional NeuroImages, https://afni.nimh.nih.gov/) functions [10]. An iterative process was used to automatically generate the TSP maps from the raw CTP data. Patient motion was reduced for by aligning the time-series images to the first image volume using the “3dvolreg” AFNI function. Next, a brain mask was created excluding areas of signal loss (based on the first (precontrast) perfusion time-series) and excluding ventricles (based on the NCCT scan). This was followed by the calculation of an average signal density time-series curve including all pixels within the brain mask. Delay-correlations datasets were created in which the eventual value per pixel was representative of the highest Pearson’s R correlation achieved between that pixel’s individual time-shifted signal density time-series curve and the average signal density time-series curve (3dTcorr1D function in AFNI). A new mask was then generated which only included voxels with Pearson’s R > 0.6, and a new average signal density time-series was calculated for each pixel within this second mask after which a new Pearson’s correlation map was calculated based on the correlation between individual pixel’s signal density time-series (all pixels within the initial brain mask) and the newly calculated average signal density time-series. This entire process was repeated once more to obtain the final correlation or TSP map. The Pearson’s R threshold greater than 0.6 to depict likely healthy brain tissue was based on a sensitivity analysis presented in the previous paper [10]. Post-processing time was around 25 s per subject on a typical 64-bit Linux machine (Intel Zeon CPU x5660 at 2.8 GHz).
Qualitative image evaluation
Qualitative image assessment was performed blinded to the patient’s identity, clinical information, and diagnosis. Image quality (uninterpretable, poor, acceptable, good, and excellent), perfusion deficit (present/absent), side of the perfusion deficit (left, right, or both hemispheres), location of the perfusion deficit (supratentorial, infratentorial, or both), and affected perfusion territory (deep gray matter, anterior cerebral artery (ACA) territory, medial cerebral artery (MCA) territory, posterior cerebral artery (PCA), vertebrobasilar (VBA) territory, or multiple perfusion territories) were rated.
The ratings from one inexperienced reader (WK, no prior experience with CTP data) were used to evaluate intra-rater agreement. For this reading, TSP and deconvolution maps (CBV and MTT) were viewed independently and blinded from each other. The CBV and MTT maps were showed simultaneously as this resembled the clinical situation most closely.
Data of two readers (JWD and RPHB, both with more than 10 years of experience in neuroradiology) was used to assess the inter-rater agreement. For this analysis, all deconvolution-derived maps (CBV, MTT, and TTP) and TSP maps were viewed and assessed independently. In patients where there was a discrepancy between both readers, an agreement was obtained by means of adjudication by a tiebreaker (JDV, 2.5 years of experience). For the comparison with CT follow-up images, only patients who demonstrated an infarct (on CT follow-up images) within the original CTP field-of-view were taken into account.
All images were assessed using freely available software (v12, MRIcron). This program allows for adjusting contrast, applying color schemes, and magnifying the images when necessary.
Quantitative perfusion deficit evaluation
The volumes of perfusion deficits detected by qualitative (consensus) reading (see previous paragraph) were measured on the MTT, TTP, CBV, and TSP images. This was performed in a randomized and independent order by a core laboratory rater (ML) who has extensive experience and established rater reliability statistics [20]. To calculate the volumes, the images were segmented on a slice-by-slice basis; user-selected seed points were used followed by user-driven editing (MIPAV, Medical Image Processing, Analysis and Visualization, National Institute of Health). The volumes were automatically calculated by the software by multiplying the total lesion area by the slice thickness.
Statistical analysis
Descriptive statistics were performed, and values were expressed as mean ± standard deviation (SD) or median and range unless otherwise specified. Images scored as “uninterpretable” were not included in agreement and in quantitative analyses. Agreement analyses were performed using kappa statistic to determine consistency. Linear regression analysis was performed to assess the relation between perfusion deficit volume on CTP maps and final infarct volume on CT follow-up images. A probability value of < 0.05 was considered statistically significant. Statistical analyses were performed using IBM SPSS Statistics for Windows, version 24 (IBM Corp.).
Results
Between May 2009 and August 2013, 432 patients eligible for this study were included in the DUST study. Of these patients, 65 patients were randomly selected for inclusion. The median time from stroke symptom onset to imaging was 135 min (IQR, 1 h 14–213 min). The baseline characteristics of the included patients are shown in Table 1. Follow-up NCCT was performed three (IQR, 2–4) days after admission.
Table 1.
Baseline characteristics
| Median [IQR] | |
|---|---|
| Age (years) | 70 [57.8–77.4] |
| Gender (M/F) | 34/31 |
| Admission NIHSS | 8 [4–16] |
| NIHSS 0–2 | 6 (9%) |
| NIHSS 3–4 | 12 (18%) |
| NIHSS 5–7 | 10 (15%) |
| NIHSS 8–13 | 16 (25%) |
| NIHSS > 13 | 21 (32%) |
| Imaging time (min)a | 135 [83.5–272.5] |
| ASPECTS baseline | 10 [8–10] |
| Occlusion location | |
| No occlusion | 20 of 63 |
| ICA occlusion | 13 of 65 |
| MCA occlusion | 40 of 65 |
| Proximal MCA, 55% | |
| Distal MCA, 45% | |
| ACA | 1 of 65 |
| VBA | 5 of 65 |
| Stroke therapy | 57% |
| rTPA | 55% |
| IAT/MT | 2% |
| FU-NCCT time (days) | 3 [2–4] |
| FU-mRS | 2 [1–4] |
ACA anterior cerebral artery, ASPECTS Alberta stroke program early CT score, FU-mRS follow-up modified Rankin Scale, FU-NCCT follow-up non-contrast CT, IAT intra-arterial therapy, ICA internal carotid artery, IV-rTPA intravenous recombinant tissue plasminogen activator, MCA middle cerebral artery, MT mechanical thrombectomy, NIHSS National Institutes of Health Stroke Scale sd standard deviation
Time between symptom onset and imaging time
Image quality
Figure 1 illustrates example CTP maps and CT follow-up images of a patient with a right MCA perfusion deficit at admission and infarction at follow-up. The quality of the deconvolution and TSP images was variable. Ninety-eight percent of the CBV/MTT images were interpretable by the inexperienced reader; in 21 patients, image quality was poor (33%), acceptable in 12 (19%), good in 25 (40%), and excellent in 5 (8%) patients. Ninety-four percent of the TSP images were interpretable; image quality was poor in 12 (20%), acceptable in 15 (24%), good in 17 (28%), and excellent in 17 (28%).
Fig. 1.
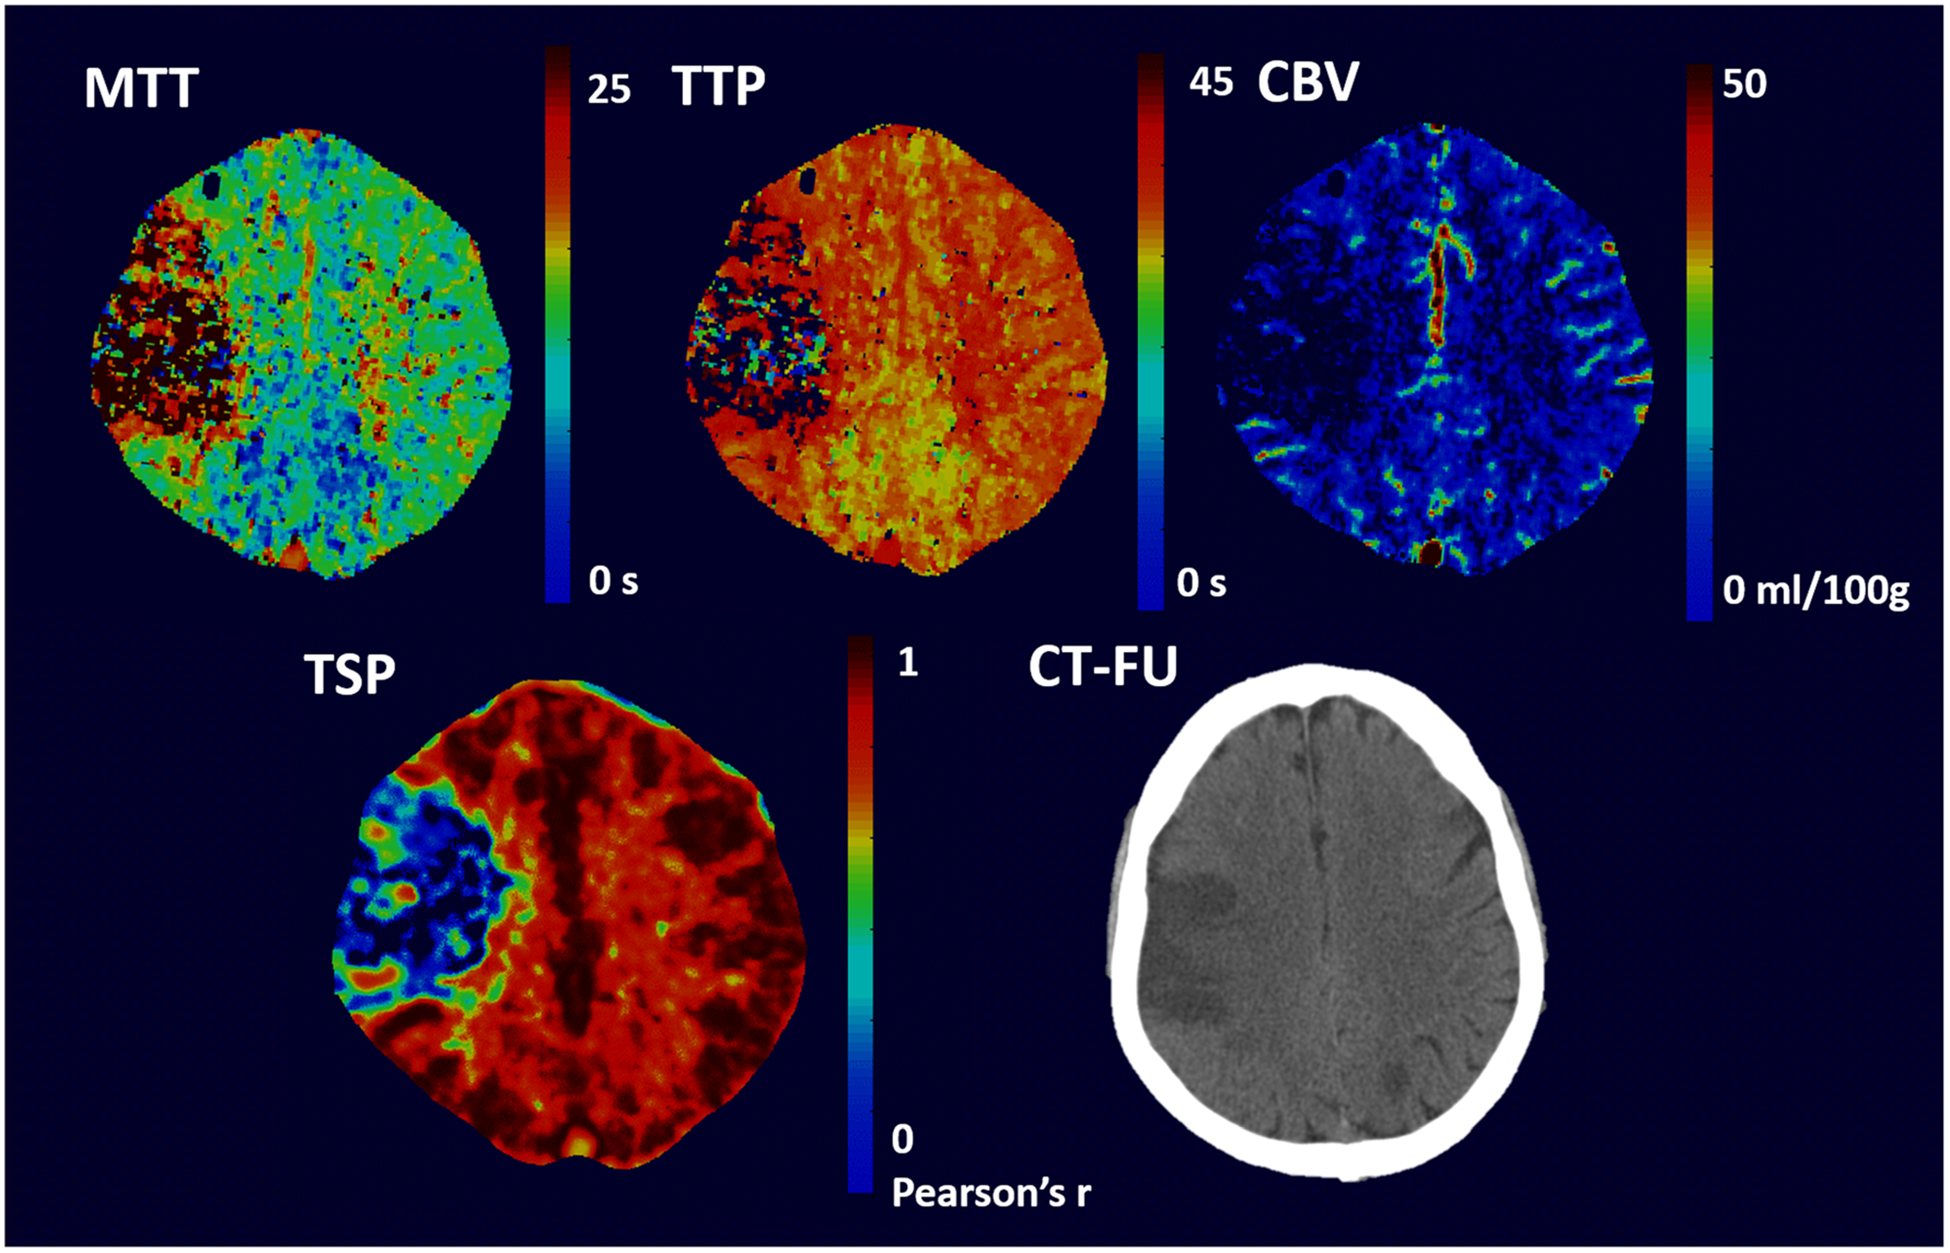
CTP images and follow-up NCCT image of a 69-year-old male patient with a right MCA infarction. The patient arrived at the hospital with an NIHSS of 15 and was treated with IV-rTPA. Within the MCA territory, a perfusion deficit was visible at admission on both the conventional perfusion images (MTT, TTP, and CBV images) as well as the TSP
Sensitivity for perfusion deficit detection
A perfusion deficit was detected on MTT maps in 44 (90%) out of 49 patients who had infarction on CT follow-up and with TSP in 41 out of 49 cases (84%). One case out of 49 (2%) was deemed uninterpretable on MTT images while two cases (4%) were uninterpretable on TSP images. A perfusion deficit was visualized on MTT but not on TSP in one case; images of this patient are shown in Fig. 2. In four cases, the perfusion deficit was not visible on MTT nor on TSP.
Fig. 2.
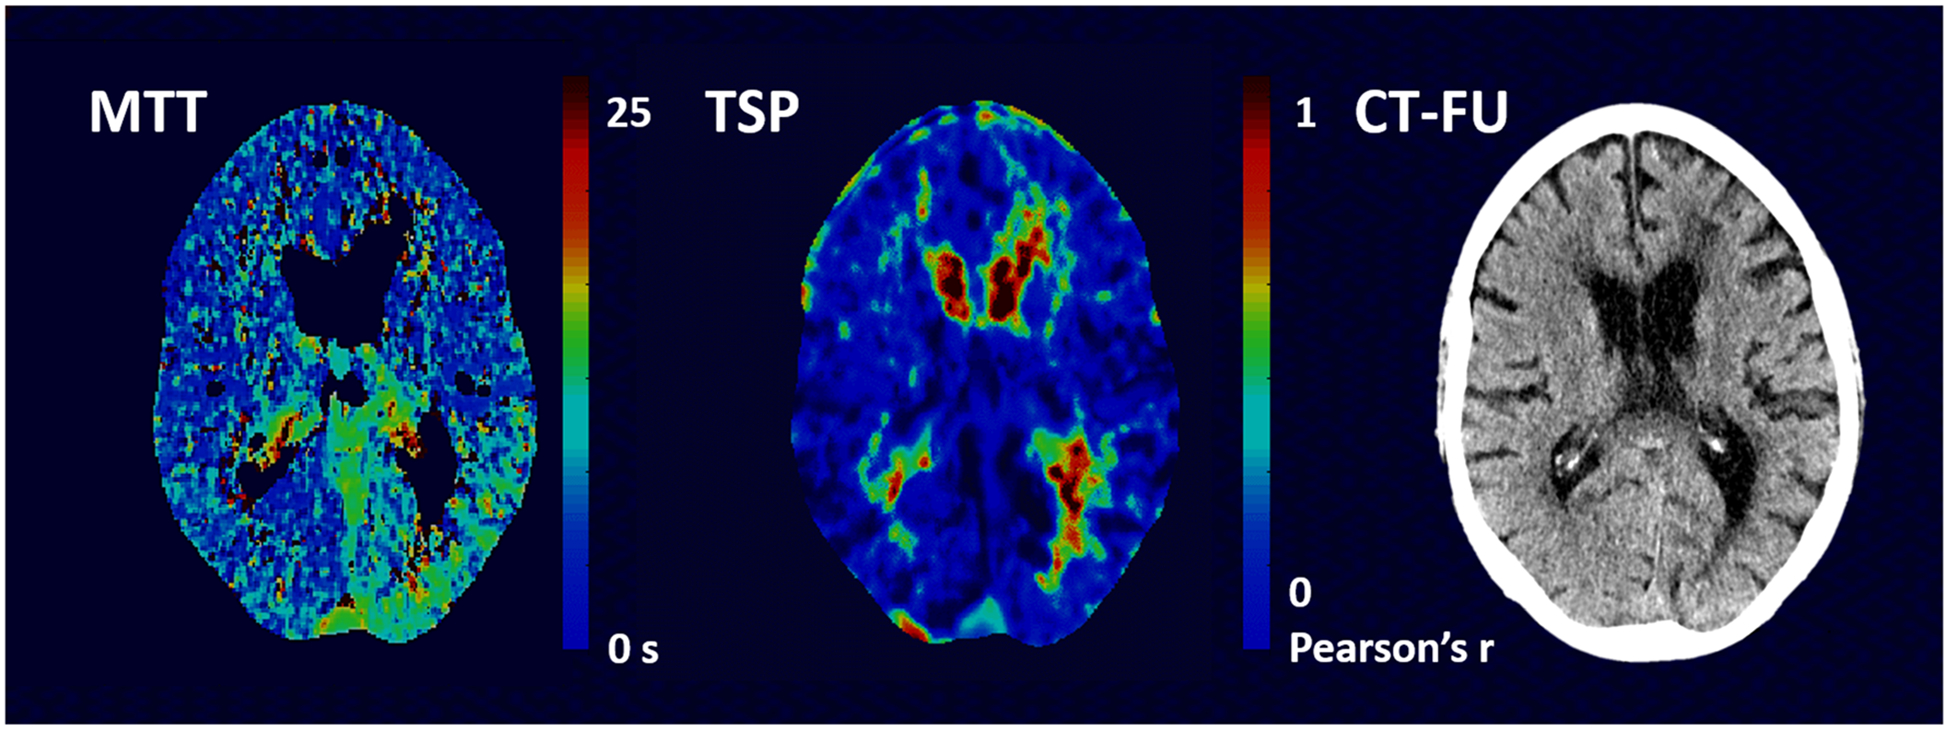
MTT and TSP images of a 74-year-old male patient who was admitted to the hospital with an NIHSS of 13 and was treated with IV-rTPA. A perfusion deficit was visible posteriorly in the left hemisphere on the MTT images but not on the TSP images. CT follow-up did not demonstrate infarction
Kappa values for the agreement of MTT/TTP/CBV/TSP with NCCT follow-up, in terms of perfusion deficit side, location, and affected perfusion territory, are shown in Table 2. Reader agreement on MTTand TSP performed similarly: 0.78 and 0.75 for side of perfusion deficit, 0.35 and 0.27 for location of perfusion deficit (supra-, infratentorial, or both), and 0.46 and 0.42 for affected perfusion territory, respectively. Reader performance on CBV was noticeably lower than the performance of the other perfusion maps (0.48, 0.08, and 0.16 for side of perfusion deficit, location of perfusion deficit, and affected perfusion territory, respectively). Example images of a patient in whom a perfusion deficit was not detected on the CBV images is shown in Fig. 3.
Table 2.
Agreement of perfusion maps with NCCT follow-up
| NCCT follow-up | |||
|---|---|---|---|
| Perfusion deficit hemisphere | Location | Territory | |
| MTT | 0.78 | 0.35 | 0.46 |
| TTP | 0.81 | 0.35 | 0.47 |
| CBV | 0.48 | 0.08 | 0.16 |
| TSP | 0.75 | 0.27 | 0.42 |
Hemisphere of perfusion deficit was either right, left, or both
Perfusion deficit location was either supratentorial, infratentorial, or both
Perfusion deficit territory was either deep gray matter, anterior cerebral artery (ACA) territory, middle cerebral artery (MCA) territory, posterior cerebral artery (PCA) or vertebrobasilar artery (VBA) territory, or multiple perfusion territories
Fig. 3.
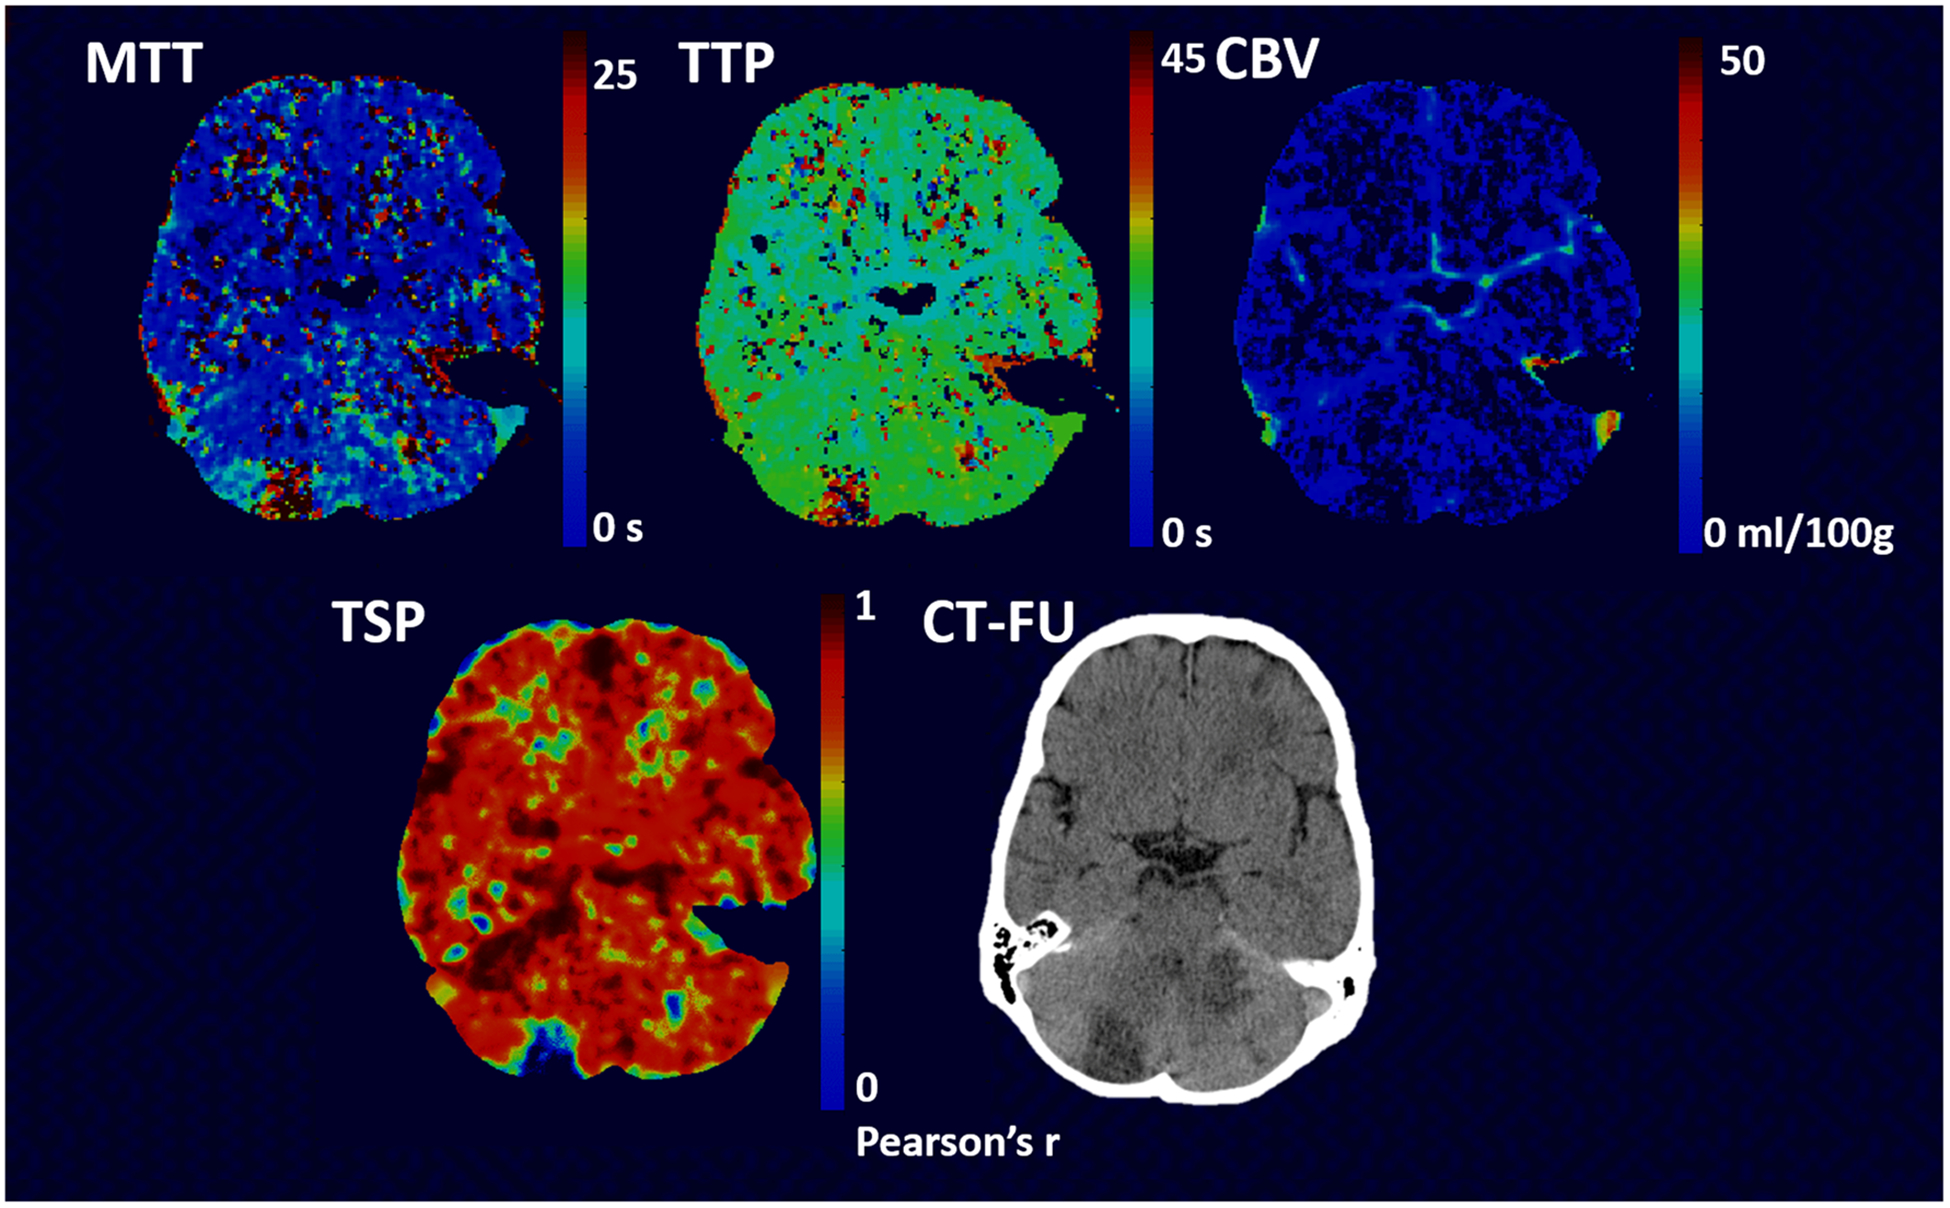
Example images of a 56-year-old male patient with an infarction in both the right and left cerebellum on NC CT (follow-up) image. The patient had an NIHSS of 4 at admission and no treatment was given. The perfusion deficit in the right cerebellum is well visible on both the TSP, MTT, and TTP images but more subtle on the CBVimages. The area of infarction as seen on the NCCT in the left cerebellum shows only a very small perfusion lesion on the TSP, MTT, and TTP images but is not visible on the CBV images
Intra-rater and inter-rater agreement
The intra-rater agreement (kappa) of the inexperienced reader for the CBV/MTT images was 0.66, 0.63, 0.69, and 0.7 for presence of a perfusion deficit, the affected hemisphere, location, and perfusion territory, respectively. The intra-rater agreement for the TSP images was 0.84, 0.79, 0.83, and 0.83, respectively. Kappa values for inter-rater agreement of the experienced readers are given in Table 3. TSP showed the highest inter-rater agreement for “presence of perfusion deficit” and “location of perfusion deficit” (0.88 and 0.92, respectively). CBV had the highest inter-rater agreement for “side of perfusion deficit” (0.79), and MTT showed the highest inter-rater agreement for “affected perfusion territory” (0.82). Overall, inter-rater agreements across maps were comparable with all kappa values ranging between 0.66 and 0.92.
Table 3.
Inter-rater agreement
| Perfusion deficit | Perfusion deficit hemisphere | Location | Territory | |
|---|---|---|---|---|
| MTT | 0.83 | 0.76 | 0.88 | 0.82 |
| TTP | 0.79 | 0.74 | 0.86 | 0.66 |
| CBV | 0.77 | 0.79 | 0.81 | 0.68 |
| TSP | 0.88 | 0.76 | 0.92 | 0.80 |
Inter-rater agreement of two experienced readers for the different perfusion maps are given
Perfusion deficit was scored as either present or absent
Perfusion deficit hemisphere was either right, left or both
Perfusion deficit location was either supratentorial, infratentorial, or both
Perfusion deficit territory was either deep gray matter, anterior cerebral artery (ACA) territory, middle cerebral artery (MCA) territory, posterior cerebral artery (PCA) or vertebrobasilar artery (VBA) territory, or multiple perfusion territories
Size of perfusion deficit
In Table 4, the mean perfusion volumes as measured on the CTP maps (MTT, TTP, CBV, and TSP) are given and compared to the corresponding infarct volumes on NCCT follow-up. The best relationship with final infarct volume was found for CBV (R2 = 0.77, p < 0.001). TSP performed second best, R2 = 0.63, p < 0.001. For MTT and TTP, R2 values of 0.53 and 0.57 were found (p = 0.001 and p < 0.001), respectively. Figure 4 shows images of a patient in whom the MTT and TTP maps overestimated the perfusion deficit whereas the perfusion deficit on the TSP maps was more closely related to the final infarct volume.
Table 4.
Size of perfusion deficit
| Perfusion deficit volume | MTT | NCCT follow-up | Linear regression |
| 94 [0–359] ml | 88.7 [0.1–465] ml | R2 = 0.53, B = 0.747, p = 0.001 | |
| Perfusion deficit volume | TTP | NCCT follow-up | Linear regression |
| 104 [0–339] ml | 84.9 [0.1–465] ml | R2 = 0.57, B = 0.691, p <0.001 | |
| Perfusion deficit volume | CBV | NCCT follow-up | Linear regression |
| 53 [0–328] ml | 101 [0.1–465] ml | R2 = 0.77, B = 1.191, p <0.001 | |
| Perfusion deficit volume | TSP | NCCT follow-up | Linear regression |
| 64.3 [0–279.9] ml | 89.9 [0.1–465] ml | R2 = 0.63, B = 1.064, p <0.001 |
Perfusion deficit volumes (mean [range]) measured on the different perfusion maps were compared to NCCT final infarct volume (mean [range]). Results of linear regression analyses are shown
Fig. 4.
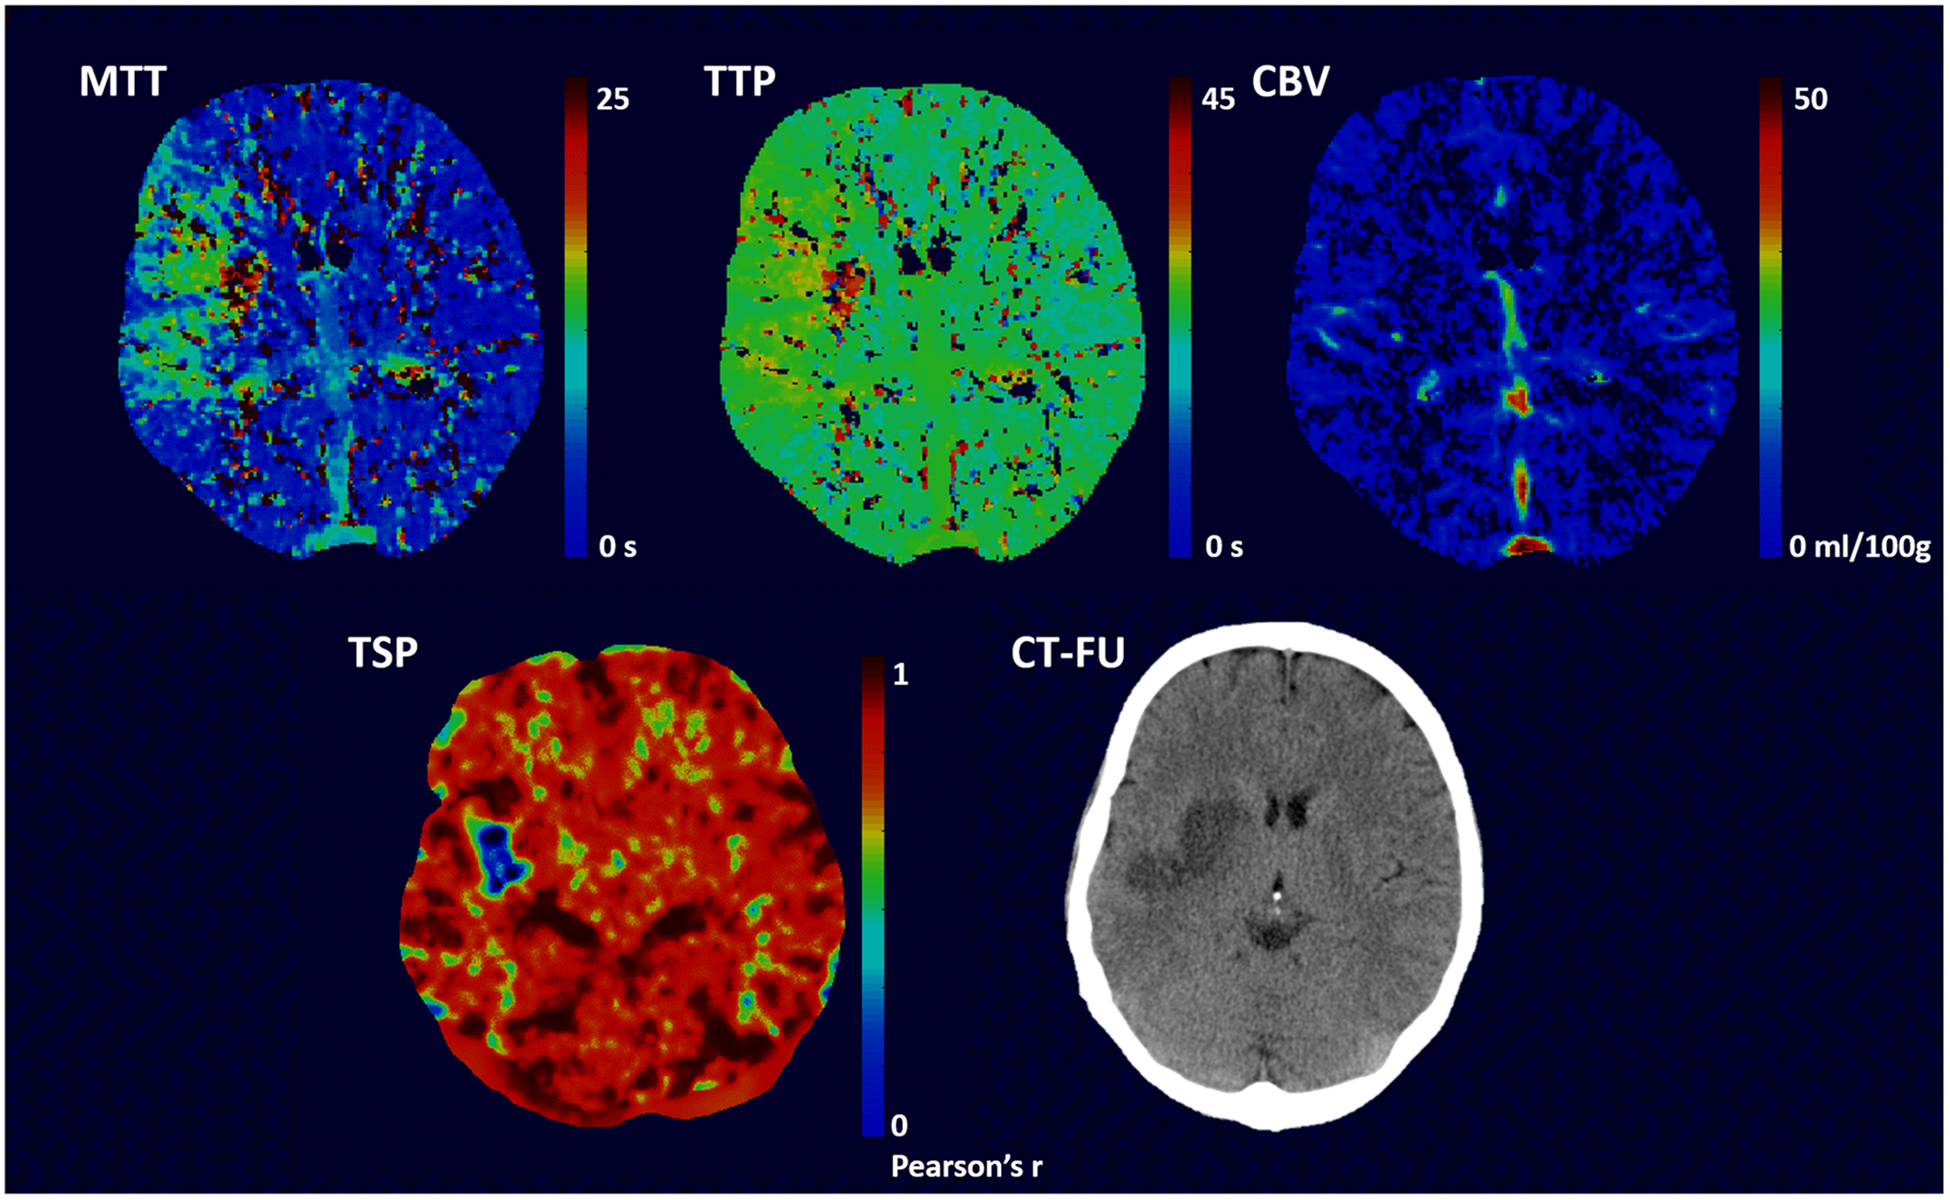
Images of a 50-year-old female patient who presented with an NIHSS of 12 at admission. The patient was treated with IA therapy. Infarction is seen within the right basal ganglia area on the NCCT (follow-up) images. The perfusion deficit as visualized on the TSP images is smaller than the area with increased transit time on the MTT and TTP images. No clear lesion is visible on the CBV images
The relation between the MTT and TSP perfusion deficit volume was significant (p < 0.001, R2 = 0.83, and B = 0.726). A significant relation was also found between TTP and TSP perfusion deficit volumes (p < 0.001, R2 = 0.714, and B = 0.64) and between CBV and TSP perfusion deficit volumes (p < 0.001, R2 = 0.73, and B = 0.735).
Discussion
This study demonstrates that TSP maps have comparable performance to traditional deconvolution-derived maps, namely MTT and TTP maps, in the detection of perfusion deficits in suspected stroke patients. The inter-rater agreement is comparable for both analysis methods, but there was an increased sensitivity to detect deficits on TSP for the inexperienced reader.
The equal interpretability of TSP as compared to deconvolution-derived maps is of importance as TSP might have the potential to differentiate core and penumbra from benign oligemia and delayed arrival. This latter comes forth of its iterative post-processing algorithm whereby a voxel’s signal time-curve is shifted across its time-domain to find its highest correlation with the brain’s likely healthy tissue. Thereby, the correlation map or a voxel’s Pearson’s correlation coefficient is independent of transit differences across the brain. In subjects with benign oligemia, on the other hand, the correlation coefficient with likely healthy tissue is expected to be higher than the correlation coefficient of the stroke core and penumbra. Thereby, TSP mapping may be particularly valuable in patients with proximal steno-occlusive disease whereby it is unclear whether the perceived perfusion deficit is due to the proximal disease, benign oligemia, or a real perfusion-diffusion mismatch. With recent advances in embolectomy treatment, this differentiation has only become more important [1, 2]. As a first step to investigating this particular property of TSP, we compared final infarct volumes to perfusion deficit volumes on commercially available (delay insensitive) deconvolution-derived maps and TSP maps. Thereby, we need to take into account that 57% of included patients received (possibly successful) therapy which complicates interpretation for both deconvolution-derived maps as the TSP map due to the heterogenous nature of therapy-induced changes in perfusion. In line with earlier research, CBV maps were found to have the best correlation with final infarct volume [21, 22]. We furthermore found that the perfusion deficits detected with TSP were smaller than the ones detected with MTT or TTP. This may suggest that TSP maps are less confounded by prolonged transit times, although further investigation is necessary.
The detection of perfusion deficits was similar for both TSP and the traditional deconvolution-derived perfusion maps. For the inexperienced reader, we found the intra-rater agreement to be higher. This is of importance as CTP images are commonly assessed in the routine clinical setting by residents on call. The inter-rater agreement of TSP as assessed on data of experienced readers was comparable to the inter-rater agreement of the deconvolution-derived maps as reported here, and of previous literature which reported kappa’s of 0.8 and 0.9 for CBV and MTT maps, respectively [23].
Our results are in line with a previous study that used TSP to assess perfusion deficits with dynamic susceptibility MRI [10]. Other non-deconvolution-based methods, such as cross-correlation analysis and clustering, have been investigated for the use in acute stroke [24], although these were generally used for detection of perfusion deficits outside the brain [25, 26]. Wissmuller et al also presented a method based on neural network clustering that was shown to be able to identify groups of voxels sharing common properties of signal dynamics and delineate perfusion deficits in stroke [27].
This study was limited in the sense that TSP images could not be compared to a true gold standard. This limited the investigation of the underlying physiology associated with the perfusion deficit as visualized on the TSP maps. More so, the comparison of the deconvolution and TSP-derived maps with final infarct volume was limited in the sense that only the value of the final infarct volume was available. This precluded a voxelwise comparison of perfusion deficits versus final infarct. As well, thus far we have not yet compared the performance of TSP to transit-delay insensitive algorithms such as delay-corrected singular value decomposition (dSVD), block-circulant SVD, maximum slope, or inverse filter which are known to perform better when it comes to final infarct prediction [4]. Delay-corrected SVD-derived CBF maps are known to be less dependent on arterial-tissue delay and mean transit time than standard SVD [19]. Thereby, future work will compare delay-insensitive maps to TSP maps and will incorporate the CBF map in its analysis to determine whether TSP maps are indeed more specific for penumbra than the MTT or TTP maps. Efforts will also be done to validate the technique across centers and imaging parameters. Once full evaluation has been performed, the software will be made freely available to the scientific community; in the meanwhile, we want to refer the user to AFNI’s InstaCorr function (https://afni.nimh.nih.gov/pub/dist/doc/misc/instacorr.pdf’) which allows for an interactive exploration of inter-voxel time-series correlation albeit not shifted across the time-domain.
Conclusion
In conclusion, perfusion deficits can be reliably detected and delineated by analyzing similarity between signal density time-series in CTP images of patients with acute stroke. TSP is a non-deconvolution-based alternative to MTT/TTP and CBV analyses, and our findings demonstrated a high comparability, but of superior quality to interpret for inexperienced readers. Further research is needed in order to investigate whether it can be used to distinguish core from penumbra.
Key Points.
Temporal similarity perfusion mapping assesses CTP data based on similarities in signal time-curves.
TSP maps are comparable in perfusion deficit detection to deconvolution maps.
TSP maps are easier to interpret for inexperienced readers.
Funding
This study has received funding by the Netherlands Heart Foundation (grant numbers 2008T034, 2012T061, and 2013T047) and the Nuts Ohra Foundation (grant number 0903-012).
Abbreviations
- ACA
Anterior cerebral artery
- ASPECTS
Alberta stroke program early CT score
- CBF
Cerebral blood flow
- CBV
Cerebral blood volume
- CT
Computed tomography
- CTA
CT angiography
- CTP
CT perfusion
- DUST
DUtch acute STroke study
- FOV
Field-of-view
- IAT
Intra-arterial therapy
- ICA
Internal carotid artery
- IV-rTPA
Intravenous recombinant tissue plasminogen activator
- MCA
Middle cerebral artery
- MT
Mechanical thrombectomy
- MTT
Mean transit time
- NCCT
Non-contrast CT
- NIHSS
National Institutes of Health Stroke Scale
- PCA
Posterior cerebral artery
- PET
Positron emission tomography
- TSP
Temporal similarity perfusion
- TTP
Time-to-peak
- VBA
Vertebrobasilar artery
Footnotes
Electronic supplementary material The online version of this article (https://doi.org/10.1007/s00330-018-5896-y) contains supplementary material, which is available to authorized users.
Compliance with ethical standards
Guarantor The scientific guarantor of this publication is Reinoud P.H. Bokkers.
Conflict of interest The authors of this manuscript declare no relationships with any companies, whose products or services may be related to the subject matter of the article.
Statistics and biometry No complex statistical methods were necessary for this paper.
Informed consent Written informed consent was obtained from all subjects (patients) in this study.
Ethical approval Institutional Review Board approval was obtained.
Study subjects or cohorts overlap Some study subjects or cohorts have been previously reported in studies related to the Dutch acute STroke study (http://www.clinicaltrials.gov. Unique identifier: NCT00880113).
- retrospective
- cross-sectional study
- multicenter study
References
- 1.Albers GW, Marks MP, Kemp S et al. (2018) Thrombectomy for stroke at 6 to 16 hours with selection by perfusin imaging. N Engl J Med 251:241–249 [DOI] [PMC free article] [PubMed] [Google Scholar]
- 2.Nogueira RG, Jadhav AP, Haussen DC et al. (2018) Thrombectomy 6 to 24 hours after stroke with a mismatch between deficit and infarct. N Engl J Med 378:11–21 [DOI] [PubMed] [Google Scholar]
- 3.Sanelli PC, Lev MH, Eastwood JD, Gonzalez RG, Lee TY (2004) The effect of varying user-selected input parameters on quantitative values in CT perfusion maps. Acad Radiol 11:1085–1092 [DOI] [PubMed] [Google Scholar]
- 4.Kudo K, Sasaki M, Ogasawara K, Terae S, Ehara S, Shirato H (2009) Difference in tracer delay-induced effect among deconvolution algorithms in CT perfusion analysis: quantitative evaluation with digital phantoms. Radiology 251:241–249 [DOI] [PubMed] [Google Scholar]
- 5.Fiorella D, Heiserman J, Prenger E, Partovi S (2004) Assessment of the reproducibility of postprocessing dynamic CT perfusion data. AJNR Am J Neuroradiol 25:97–107 [PMC free article] [PubMed] [Google Scholar]
- 6.Sasaki M, Kudo K, Ogasawara K, Fujiwara S (2009) Tracer delay-insensitive algorithm can improve reliability of CT perfusion imaging for cerebrovascular steno-occlusive disease: comparison with quantitative single-photon emission CT. AJNR Am J Neuroradiol 30:188–193 [DOI] [PMC free article] [PubMed] [Google Scholar]
- 7.Wintermark M, Maeder P, Verdun FR et al. (2000) Using 80 kVp versus 120 kVp in perfusion CT measurement of regional cerebral blood flow. AJNR Am J Neuroradiol 21:1881–1884 [PMC free article] [PubMed] [Google Scholar]
- 8.Hirata M, Sugawara Y, Fukutomi Y et al. (2005) Measurement of radiation dose in cerebral CT perfusion study. Radiat Med 23:97–103 [PubMed] [Google Scholar]
- 9.Wintermark M, Smith WS, Ko NU, Quist M, Schnyder P, Dillon WP (2004) Dynamic perfusion CT: optimizing the temporal resolution and contrast volume for calculation of perfusion CT parameters in stroke patients. AJNR Am J Neuroradiol 25:720–729 [PMC free article] [PubMed] [Google Scholar]
- 10.Song S, Bokkers RPH, Luby M et al. (2017) Temporal similarity perfusion mapping: a standardized and model-free method for detecting perfusion deficits in stroke. PLoS One 12:e0185552. [DOI] [PMC free article] [PubMed] [Google Scholar]
- 11.Kudo K, Sasaki M, Yamada K et al. (2010) Differences in CT perfusion maps generated by different commercial software: quantitative analysis by using identical source data of acute stroke patients. Radiology 254:200–209 [DOI] [PubMed] [Google Scholar]
- 12.van Seeters T, Biessels GJ, van der Schaaf IC et al. (2014) Prediction of outcome in patients with suspected acute ischaemic stroke with CT perfusion and CT angiography: the Dutch acute stroke trial (DUST) study protocol. BMC Neurol 14:37. [DOI] [PMC free article] [PubMed] [Google Scholar]
- 13.Brott T, Adams HP Jr, Olinger CP et al. (1989) Measurements of acute cerebral infarction: a clinical examination scale. Stroke 20: 864–870 [DOI] [PubMed] [Google Scholar]
- 14.Pexman JH, Barber PA, Hill MD et al. (2001) Use of the Alberta stroke program early CT score (ASPECTS) for assessing CT scans in patients with acute stroke. AJNR Am J Neuroradiol 22:1534–1542 [PMC free article] [PubMed] [Google Scholar]
- 15.Soares BP, Dankbaar JW, Bredno J et al. (2009) Automated versus manual post-processing of perfusion-CT data in patients with acute cerebral ischemia: influence on interobserver variability. Neuroradiology 51:445–451 [DOI] [PMC free article] [PubMed] [Google Scholar]
- 16.Wintermark M, Lau BC, Chien J, Arora S (2008) The anterior cerebral artery is an appropriate arterial input function for perfusion-CT processing in patients with acute stroke. Neuroradiology 50:227–236 [DOI] [PubMed] [Google Scholar]
- 17.Wintermark M, Flanders AE, Velthuis B et al. (2006) Perfusion-CT assessment of infarct core and penumbra: receiver operating characteristic curve analysis in 130 patients suspected of acute hemispheric stroke. Stroke 37:979–985 [DOI] [PubMed] [Google Scholar]
- 18.Axel L (1983) Tissue mean transit time from dynamic computed tomography by a simple deconvolution technique. Invest Radiol 18: 94–99 [DOI] [PubMed] [Google Scholar]
- 19.Ibaraki M, Ohmura T, Matsubara K, Hinoshita T (2015) Reliability of CT perfusion-derived CBF in relation to hemodynamic compromise in patients with cerebrovascular steno-occlusive disease: a comparative study with 15O-PET. J Cereb Blood Flow Metab 35: 1280–1288 [DOI] [PMC free article] [PubMed] [Google Scholar]
- 20.Luby M, Bykowski JL, Schellinger PD, Merino JG, Warach S (2006) Intra- and interrater reliability of ischemic lesion volume measurements on diffusion-weighted, mean transit time and fluid-attenuated inversion recovery MRI. Stroke 37:2951–2956 [DOI] [PMC free article] [PubMed] [Google Scholar]
- 21.Man F, Patrie JT, Xin W et al. (2015) Delay-sensitive and delay-insensitive deconvolution perfusion-CT: similar ischemic core and penumbra volumes if appropriate threshold selected for each. Neuroradiology 57:573–581 [DOI] [PubMed] [Google Scholar]
- 22.Muir KW, Halbert HM, Baird TA, McCormick M, Teasdale E (2006) Visual evaluation of perfusion computed tomography in acute stroke accurately estimates infarct volume and tissue viability. J Neurol Neurosurg Psychiatry 77:334–339 [DOI] [PMC free article] [PubMed] [Google Scholar]
- 23.van Seeters T, Biessels GJ, Niesten JM et al. (2013) Reliability of visual assessment of non-contrast CT, CT angiography source images and CT perfusion in patients with suspected ischemic stroke. PLoS One 8:e75615. [DOI] [PMC free article] [PubMed] [Google Scholar]
- 24.Haacke EM, Li M, Juvvigunta F (2013) Tissue similarity maps (TSMs): a new means of mapping vascular behavior and calculating relative blood volume in perfusion weighted imaging. Magn Reson Imaging 31:481–489 [DOI] [PubMed] [Google Scholar]
- 25.Zöllner FG, Daab M, Weidner M et al. (2015) Semi-automatic lung segmentation of DCE-MRI data sets of 2-year old children after congenital diaphragmatic hernia repair: initial results. Magn Reson Imaging 33:1345–1349 [DOI] [PubMed] [Google Scholar]
- 26.Li S, Zöllner FG, Merrem AD et al. (2012) Wavelet-based segmentation of renal compartments in DCE-MRI of human kidney: initial results in patients and healthy volunteers. Comput Med Imaging Graph 36:108–118 [DOI] [PubMed] [Google Scholar]
- 27.Wismüller A, Meyer-Baese A, Lange O, Reiser MF, Leinsinger G (2006) Cluster analysis of dynamic cerebral contrast-enhanced perfusion MRI time-series. IEEE Trans Med Imaging 25:62–73 [DOI] [PubMed] [Google Scholar]