

Abstract
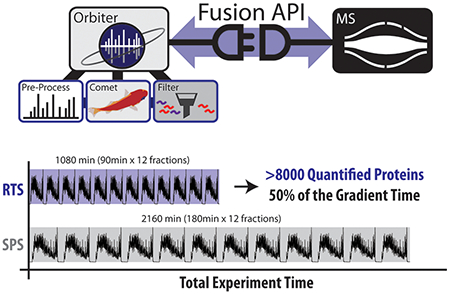
Multiplexed quantitative analyses of complex proteomes enable deep biological insight. While a multitude of workflows have been developed for multiplexed analyses, the most quantitatively accurate method (SPS-MS3) suffers from long acquisition duty cycles. We built a new, real-time database search (RTS) platform, Orbiter, to combat the SPS-MS3 method’s longer duty cycles. RTS with Orbiter eliminates SPS-MS3 scans if no peptide matches to a given spectrum. With Orbiter’s online proteomic analytical pipeline, which includes RTS and false discovery rate analysis, it was possible to process a single spectrum database search in less than 10 ms. The result is a fast, functional means to identify peptide spectral matches using Comet, filter these matches, and more efficiently quantify proteins of interest. Importantly, the use of Comet for peptide spectral matching allowed for a fully featured search, including analysis of post-translational modifications, with well-known and extensively validated scoring. These data could then be used to trigger subsequent scans in an adaptive and flexible manner. In this work we tested the utility of this adaptive data acquisition platform to improve the efficiency and accuracy of multiplexed quantitative experiments. We found that RTS enabled a 2-fold increase in mass spectrometric data acquisition efficiency. Orbiter’s RTS quantified more than 8000 proteins across 10 proteomes in half the time of an SPS-MS3 analysis (18 h for RTS, 36 h for SPS-MS3).
Keywords: real-time searching, intelligent data acquisition, adaptive instrument control, multiplexed proteomics, C#, smart TMT, real-time FDR filtering, Fusion API, Comet
Graphical Abstract
■ INTRODUCTION
Multiplexed quantitative methods continually attempt to balance acquisition speed and precursor isolation purity. The balance derives from the need to achieve high proteome coverage (speed, depth) to interrogate new biologies and the need for quantitative accuracy to eliminate spurious quantitative values (purity, accuracy) to improve quantitative dynamic range. Initial experiments with multiplexed isobaric reagents implemented HRMS2-based methods for multiplexed quantitation and relied on a single precursor isolation to attempt to eliminate coisolating ions.1 While the methods were relatively fast, the resulting quantitation suffered from the well-documented phenomenon of reporter ion interference due to coisolation of precursors.2
In an effort to eliminate the aforementioned quantitative interference, methods that employed a tertiary scan to analyze secondary fragmentation products, multinotch MS3 or SPS-MS3, were developed.2,3 The SPS-MS3 method vastly improved quantitative accuracy, but required the addition of a third quantification scan to every instrument scan cycle which subsequently slowed instrument acquisition speeds.3,4 While other methods have been developed to reduce precursor coisolation interference and/or increase the duty cycle speed, these methods generally still rely on either the HRMS2 method or SPS-MS3 method.5, Recently a proof-of-principle showed real-time spectral matching as a novel means to achieve the speed of HRMS2 analyses with the quantitative accuracy of SPS-MS3.4 This binomial score based real-time search (RTS) demonstrated potential to improve acquisition efficiency for multiplexed quantitative analysis by enabling quantitation if and only if a peptide spectral match (PSM) was found.4,7,8 By applying this strategy specifically to multiplexed analyses and through selective elimination of SPS-MS3 scans, this study demonstrated a strong improvement in data acquisition speed and improved accuracy for multiplexed quantitation.
In the present work we extended the robustness and flexibility of the RTS strategy for multiplexed quantitative proteomics. We implemented a full analytical pipeline, monoisotopic peak refinement, database searching, and FDR filtering,9 on a millisecond time scale, termed Orbiter. The speed of Orbiter analysis enabled real-time decision making to dictate the acquisition of SPS-MS3 scans only when a high-confidence PSM was observed. We chose the open source Comet search engine for database searching and scoring.10,11 For this work, Comet was revised to enable fast real-time spectral analysis while maintaining support for highly flexible searching (e.g., post translational modifications, multiple isotopic envelopes, and flexible fragmentation schemes).10,12 We evaluated the improved performance of Orbiter RTS against standard SPS-MS3. Orbiter achieved 2-fold faster acquisition speeds and improved quantitative accuracy compared to canonical SPS-MS3 methods.
■ EXPERIMENTAL METHODS
Sample Preparation
Saccharomyces cerevisae (BY4742) was grown in 500 mL YPD cultures to an OD600 of 0.8 then washed twice with ice-cold PBS, pelleted, and stored at −80 °C until use. Cells were resuspended in lysis buffer (8 M urea, 50 mM EPPS pH 8.5, 150 mM NaCl, Roche protease inhibitor tablet) and lysed by bead beating. After lysis and bead removal, the lysate was centrifuged to remove cellular debris and the supernatant was collected for use. Cell lines were grown to confluence in DMEM containing 10% fetal bovine serum and 1% streptomycin/puromycin. Cells were harvested by manual scraping and washed twice with PBS. Cells were syringe lysed in lysis buffer (8 M urea, 50 mM EPPS pH 8.5, 150 mM NaCl, and Roche protease inhibitor tablet) and the resulting lysates were cleared via centrifugation.
Desired protein amounts were aliquoted and chloroform methanol precipitated, followed by digestion with LysC (overnight at room temperature, vortex speed 2; Wako) and trypsin (6 h, 37 °C; Promega) digestion. Peptides were labeled with TMT reagents as described previously.6,13 Labeled peptides were mixed, and dried to remove organic solvent prior to cleanup via Sep-Pak (50 mg C18 SepPak; Waters). As needed, labeled peptide mixtures were separated via high-pH reversed phase chromatography and pooled into fractions.13 Samples were dried and stored at −80 °C prior to analysis.
LC-MS/MS Analysis
Samples were resuspended in 5% acetonitrile/2% formic acid prior to being loaded onto an in-house pulled C18 (Thermo Accucore, 2.6 Å, 150 μm) 35 cm column. Peptides were eluted over a 90, 120, or 180 min gradient from 96% buffer A (5% acetonitrile, 0.125% formic acid) to 30% buffer B (95% acetonitrile, 0.125% formic acid). Sample eluate was electro-sprayed (2600 V) into a Thermo Scientific Orbitrap Fusion Lumos mass spectrometer for analysis. The scan procedure for MS1 scans (Orbitrap scan at 120 000 resolution, 50 ms max injection time, and AGC set to 1e5) and MS2 scans (Rapid ion scan, 50 ms max injection time, AGC set to 2e4, CID collision energy of 35% with 10 ms activation time, and 0.5 m/z isolation width) was constant for all analyses.
Database Search and Analysis
Raw files were converted to mzXML format using an in-house adapted version of RawFileReader6 and searched using SEQUEST or Comet.11,14 Briefly, spectra were searched against a target-decoy database for the yeast, human, or concatenated human-yeast proteomes, including isoforms.6 Searches were performed with a 20 ppm peptide mass tolerance, 0.9 Da fragment ion tolerance, trypsin enzymatic cleavage with up to two missed cleavages, and three variable modifications allowed per peptide. Unless otherwise noted, all searches were performed with variable methionine oxidation (+15.99491), static cysteine carboxyamido-methylation (+57.02146), and static tandem mass tag modifications on lysine and the peptide N-termini (+229.16293). Peptide spectral matches were filtered to a peptide and protein false discovery rate (FDR) of less than 1%.15 Statistical analyses and plotting was done using the R project for statistical computing.16 Unless otherwise noted, peptides identified using HRMS or SPS-MS3 methods were considered quantified if the reporter ion summed signal:noise was greater than 100 and precursor isolation specificity was greater than 0.5; peptides identified using RTS methods were considered quantified if the reporter ion summed signal:noise was greater than 100. The mass spectrometry proteomics data have been deposited to the ProteomeXchange Consortium via the PRIDE partner repository with the data set identifier PXD017823.
Adaptive Instrument Control
The adaptive instrument control platform (Orbiter) was built in the .NET Framework (v4.6.5). Peptide spectral matches were determined using a version of the Comet search algorithm redesigned for improved spectral acquisition speed enabling searching full target-decoy databases. These improvements have been made available in the latest release of Comet, including removal of the E-value calculation and database indexing.10,11 Single spectrum searching via this modified revision of Comet retains the full complement of search features available to Comet (e.g., static/variable modifications, indexed databases) enabling highly customizable searches. The real-time search (RTS) Comet functionality has been released and is available here: http://comet-ms.sourceforge.net/. Real-time access to spectral data was enabled by the Thermo Scientific Fusion API (https://github.com/thermofisherlsms/iapi). The core search functionalities demonstrated here have been incorporated into the latest version of the Thermo Scientific instrument control software (Tune 3.3). Comet was run with the following parameters unless otherwise noted: peptide mass tolerance = 50 ppm, isotope error = −1/0/1 (three windows), digest mass range = 600–5000, default comet fragment tolerances, z = 3–6. Orbiter integrated the previously described protein-closeout4 functionality to suspend collection of RTS-SPS-MS3 scans once a user-defined number of PSMs had generated quantitative data (unless otherwise noted: two PSMs per LC-MS/MS run). RTS enabled smart SPS-ion selection whereby y-ions for R-terminated peptides and potential SPS ions with an isolation specificity below 0.75 in the 3 m/z isolation window were not considered for SPS ions.
Real-Time Monoisotopic Peak Correction
Isolated precursor peaks were corrected in real-time to attain highly accurate monoisotopic m/z values for each precursor by modeling averagine across a given precursor. Briefly, potential monoisotopic peaks from a given isotopic envelope were estimated using an averagine mass offset.17 The input for which was the triggered precursor mass-not Thermo’s assigned monoisotopic m/z, which has previously been shown to be inaccurate.18 Peaks were then compared using Pearson correlation against a theoretical distribution calculated from the estimated number of carbons and the natural abundance of 13C. The mass with the best correlation was used as the monoisotopic m/z.17
Real-Time False Discovery Rate Estimation
To improve scoring for a potentially diverse cohort of samples, real-time false discovery rate (rtFDR) filtering was implemented using a modified linear discriminant analysis15 adapted from the Accord.Net Statistical libraries.19 Comet results for seven parameters were used for rtFDR estimation: XCorr, deltaCorr, missed cleavages, charge state, absolute ppm error, peptide length, and the fraction of ions matched. These parameters were selected based on previous LDA implementations.15 After requiring a user defined minimum number of total PSMs and decoy matches (default 10 decoy hits from at least 1000 total PSMs), discriminant scores were used to filter PSMs to a user-defined rtFDR.20 The initial set of 1000 PSMs enabled better modeling of early local FDR. These values can be adjusted by the user depending on sample requirements. The linear discriminant analysis was carried out using the LinearDiscriminantAnalysis class in Accord.Net.19 The LDA score calculation allowed the use of either the absolute, adjusted ppm error based on previous PSMs (default) or the absolute ppm error alone. Subsequent steps were carried out in C# using in-house built FDR methods. Briefly, LDA scores were calculated by multiplying the coefficient of each input parameter by each predictor variable and summing these values. The resulting scores were sorted and cumulative FDR was calculated for this sorted array based on the target-decoy annotations in the initial search. To avoid local-FDR peaks that could result in premature LDA score thresholding, Orbiter performed monotonic regression on the resulting FDRs using the pooled-adjacent-violators algorithm which was rebuilt from the original R implementation for C#.21 Any LDA score with an associated FDR below the user defined threshold was considered for RTS-MS3 quantitation. Receiver operator curves were generated using the R package ROCR.22
Software Availability
The main classes and methods that make up Orbiter wrap open-source, freely available libraries (i.e., Accord.Net, PAVA, and Comet). Instrument connection and operation through the Thermo Fusion iAPI is only available via a license agreement with Thermo Scientific. However, Orbiter’s core search functionality is available as a part of the Orbitrap Eclipse Tribrid instruments and we are working with the vendor as we continue to optimize the RTS platform. Currently, the distribution of Orbiter is governed by the Thermo Fusion iAPI license: https://github.com/thermofisherlsms/iapi/
Western Blotting and Quantification
Triplicate lysates (in 8 M urea) from the above proteomic cell line comparison were mixed with NuPAGE loading buffer (Invitrogen) and loaded onto a 4–12% Bis-Tris (NuPAGE, Invitrogen). Gels were washed and proteins were transferred to nitrocellulose (iBlot 2, default 7 min method). Membranes were washed and stained with Ponceau S (in 5% acetic acid) for 10 min to measure total protein. Excess stain was removed by washing in water. Membranes were incubated in 5% fat-free milk in TBST for 30 min at room temperature to remove the Ponceau S stain and block the membrane. Membranes were incubated in primary antibody (anti-ALPK2 (Abcam) or anti-ENG (Cell Signaling Technologies)) overnight at 4 °C. After primary antibody incubation, membranes were washed in TBST and water prior to incubation with secondary antibodies (1 h, room temperature). Blots were developed (SuperSignal West Pico PLUS Chemiluminescent Substrate) and analyzed using an Amersham 600 RGB Imager (GE). Captured images were processed using ImageJ for quantitative comparison of total protein abundance across cell lines.23 Correlation analysis was done using R.16
Comet Database Indexing
Databases were indexed as follows. First, Comet extracted all modified and unmodified peptides within specified peptide length and mass ranges. Second, a mass-sorted list of unique peptides was determined. Third, a header was written to a binary index file; the header was written in plain text while all subsequent information was written in binary. The header included information such as the input FASTA file, enzyme specificity, modifications considered, and the digest mass range applied. Fourth, a list of all protein description lines was written to the index file and the file pointer location of each protein description line was tracked, followed by writing the peptide sequence entries. Each peptide entry included the plain peptide sequence, preceding/trailing amino acid residues, variable modification encoding, a protein file pointer, and the peptide mass. Each peptide structure was followed by a list of file pointer locations to every protein that contained the peptide sequence. The index file is then completed with a footer composed of the mass range, peptide count, a 0.1 Da resolution mass index array, and a file pointer to the start of the footer. The mass index array in the footer contained file pointers to the first peptide of that mass. As searches were performed against the index file, the program jumped to the end of the index file and the footer file offset was read. This facilitates rapid access to the footer information including the mass index which was used to directly access peptides of the appropriate mass. The list of file pointers, to the protein descriptions, following each peptide entry allows for direct retrieval of all protein descriptions for each peptide.
■ RESULTS AND DISCUSSION
During mass spectrometric analyses, stochastic precursor selection and fragmentation results in large numbers of nonpeptide matching spectra.4 In standard SPS-MS3 methods, these nonmatching spectra generate wasteful, time-consuming MS3 scans. We reasoned that elimination of these extraneous SPS-MS3 scans would enhance SPS-MS3 acquisition speed while maintaining quantitative accuracy.3,24 Therefore, performing RTS prior to SPS-MS3 acquisition and only triggering SPS-MS3 scans when a PSM was observed could significantly reduce the number of spurious SPS-MS3 scans generated.4 This process would free instrument time to acquire more peptide matching MS2 scans to increase proteome coverage which would in turn trigger useful SPS-MS3 scans (Supporting Information (SI) Figure S1). We built the Orbiter platform to perform this RTS decision making. Orbiter encompassed a full-featured analytical proteomics pipeline operating fast enough to seamlessly integrate concurrently with instrument scan acquisition and inform future scan decisions (i.e., when to trigger SPS-MS3).
The Orbiter platform was built in C# (.NET 4.6.5+) to perform spectral preprocessing, RTS using the Comet search engine, SPS ion selection, and real-time false discovery rate filtering within milliseconds of the MS2 scan acquisition (Figure 1). Three central components enabled fast, adaptive database searching. First, the processing of precursor MS1 scans prior to database searching facilitated monoisotopic precursor mass assignment and correction on the fly. Second, a newly developed revision of the Comet database searching algorithm enabled rapid single spectrum searching. Third, real-time false discovery rate (FDR) filtering was built using linear discriminant analysis to filter PSMs using user-defined FDR settings.
Figure 1.
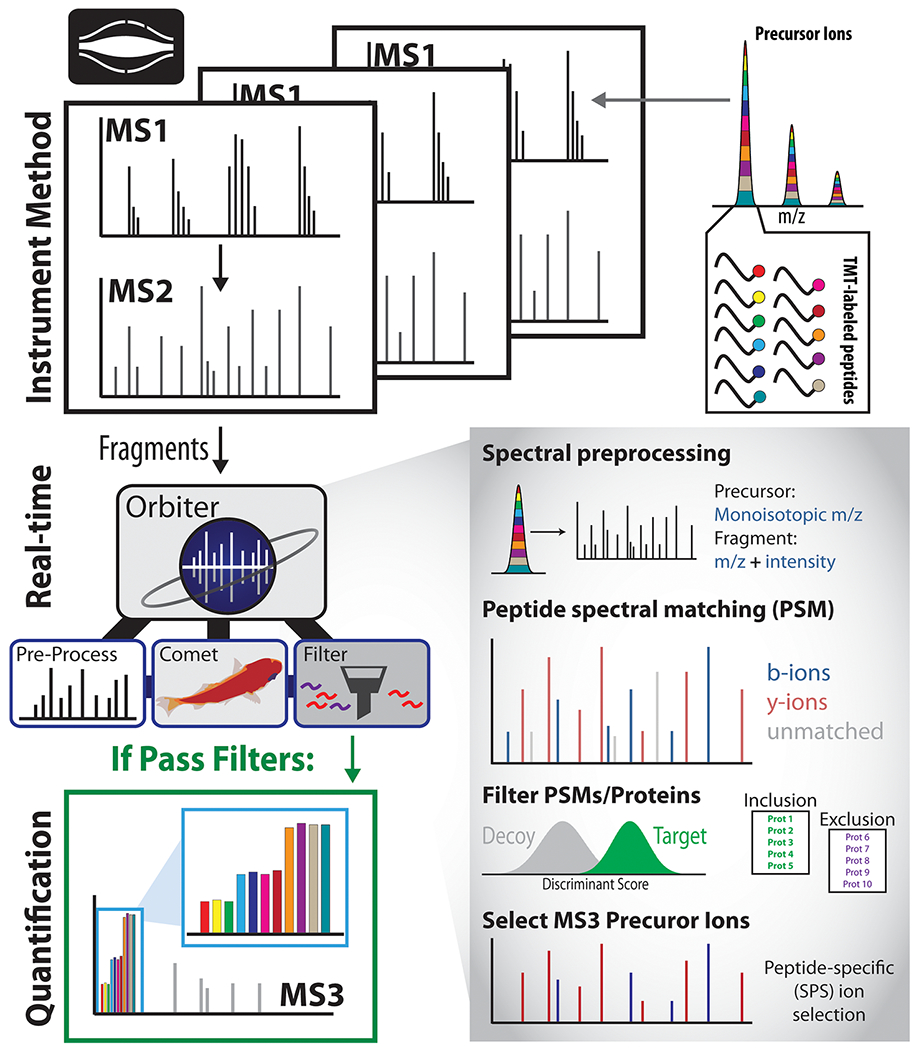
Architecture of the Orbiter platform. DDA MS2 scans are searched by Orbiter’s real-time database search. Peptide spectral matches are identified using Comet and filtered using a real-time FDR filter. For multiplexed analyses, SPS ions based on b- and y-ions from the identified peptide sequence. If and only if a peptide spectral match passes all assigned filters, will Orbiter trigger a new SPS-MS3 scan.
To run an RTS analytical method, a user queues a canonical DDA MS2 acquisition method (MS1 precursors trigger MS2 fragmentation scans for ion trap or Orbitrap analysis) based on user specified filters (e.g., dynamic exclusion, intensity thresholds). Running on the instrument’s external data system, Orbiter listens for the beginning of each new instrument method. Orbiter then matches the scan description of the first MS1 to previously constructed Orbiter parameters specific to each method (e.g., database to search, SPS ion parameters, etc.). Orbiter then searches the instrument scans in real-time with data acquisition using the pre-established database and parameters. Users can override the Orbiter scan description matching by inputting a specific indexed database and parameters. Instrument listening and control was accomplished using Thermo Scientific’s Tribrid instrument application programming interface (iAPI).
Refinement of monoisotopic peak detection has been shown previously to improve peptide identification rates.17,25,26 To ensure fidelity to the actual monoisotopic peak mass (often corrected offline) and to offline search workflows, we developed a fast monoisotopic peak assignment algorithm to correct instrument assignments based on an averaged precursor monoisotopic mass.17 We employed this monoisotopic peak correction for three reasons: (1) the instrument’s assigned precursor m/z has previously been shown to be inaccurate (SI Figure S2),18 (2) upfront monoisotopic peak correction reduced the number of Comet “isotope error” windows that Orbiter was required to use when searching the data, thereby improving search speeds, and (3) monoisotopic masses can be refined by averaging over multiple MS1 scans to improve accuracy prior to searching. Here, Orbiter collects the centroids for every MS1 scan in real-time and generates a library of all potential precursors that may be targeted for fragmentation by the instrument. Peaks that could potentially be part of the isotopic envelope were extracted using the averagine mass offset.17 Peaks were then compared using Pearson correlation against a theoretical distribution calculated from the estimated number of carbons and the natural abundance of 13C. The resulting peak with the highest correlation was assigned as the monoisotopic peak. Finally, the monoisotopic peak detection averages the monoisotopic mass for the triggering precursor across the preceding n MS1 scans. This procedure enables accurate monoisotopic peak detection for use in subsequent searching of potential peptide fragments.
Comet was chosen as the database searching algorithm as it was built under an open source framework with active revisions and maintenance, allowing for rapid prototyping and adaptation to the challenges of real-time search.10,11 Additionally, Comet has an extensive suite of multiapplication search features,10 including well documented and validated search and scoring functions; for example, XCorr and deltaCorr.10,11 The primary challenge for integrating Comet into an RTS engine was to efficiently index the sequence database for fast peptide retrieval, streamline the scoring functions, and properly manage memory to ensure Comet searching could be run efficiently over extended periods of time (weeks to months).10
Databases were indexed using a new method built for Comet RTS (see Experimental Methods). Indexed databases stored peptide data (plain peptide sequence, preceding and trailing amino acids, variable modification encoding, and a protein file pointer) in binary. This enabled fast querying of peptides from large databases (e.g. human proteome with variable modifications). To streamline the RTS scoring within Comet we removed the postsearch E-value calculations.11 The E-value calculation made up greater than 80% (mean = 125 ms of a total of 156 ms for a yeast database search) of the Comet processing time. With the E-value calculation, the mean rate of searching was limited to 6 Hz. By eliminating these calculations, search speeds increased 5-fold (mean rate = 59 Hz), but required a new FDR estimation strategy (see below). With these changes, Orbiter was able to rapidly search each new MS2 spectra against an entire organismal database in milliseconds with high fidelity to the Comet run offline (Figure 2A). When comparing to offline searching using Thermo’s high-throughput SEQUEST, we observed highly correlated scores similar to previous comparisons of the two search engines (Figure 2A).10,14 We tested the speed of Orbiter’s RTS using the Hyper two-proteome interference standard.4,6,27 Searching a full yeast database (6757 protein entries, Uniprot) with a 50 ppm precursor tolerance across three isotopes (precursor mass –1/+0/+1), methionine oxidation as a variable modification, and reversed decoy proteins resulted in median search times of 5 ms. We next tested Orbiter search times for the significantly more complex full human database with common isoforms (42 113 protein entries, Uniprot). When searched with the same parameters as the yeast database, this test resulted in median search times of only 17 ms. As noted in the above searches, the RTS revision of Comet (SourceForge revision r1350+) retains the flexible database searching available offline allowing the use of user-defined variable modifications, including common post-translational modifications such as methionine oxidation and phosphorylation (Figure 2b). At the upper extreme of the search space, we observed median search times for a full human database considering variable modifications of methionine oxidation and serine/threonine/tyrosine phosphorylation could be accomplished at 15—20 Hz which was faster than the maximum SPS-MS3 acquisition rate (R = 50 000, 96 ms Orbitrap transients enable scan speeds of 10.4 Hz).
Figure 2.
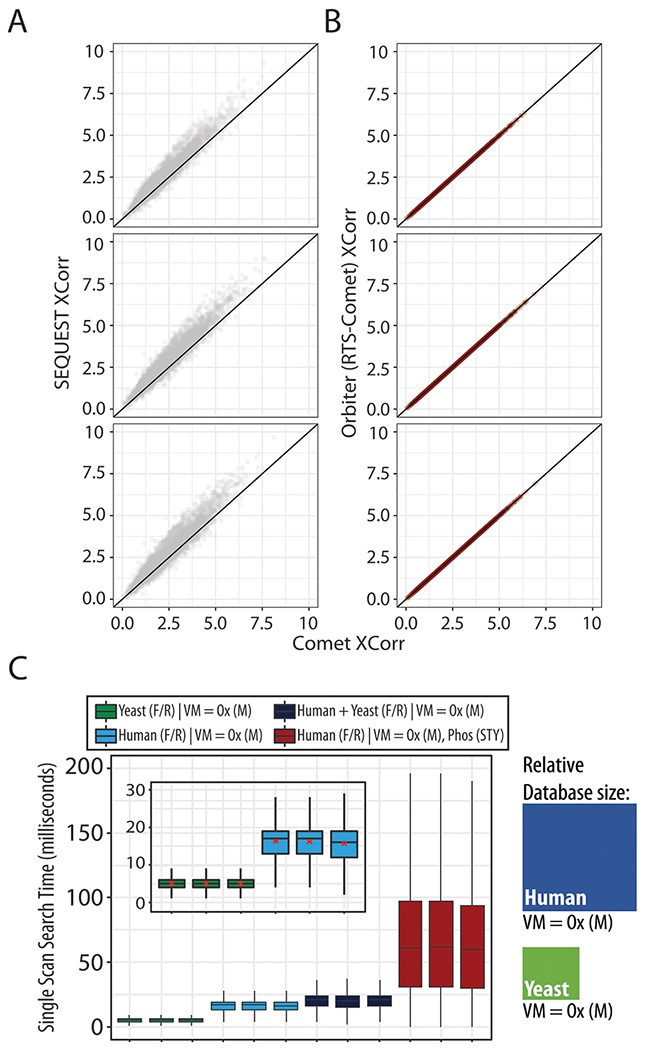
Real-time searching with Comet. Comet online and offline search scores (XCorr) match exactly, whereas the Comet and SEQUEST search scores deviate similar to previous reports1 (A) whereas Comet online (Orbiter) and offline search scores (XCorr) match exactly (B). TMT sample was the TKO interference standard, injected as technical triplicates. C, Search times for yeast, human, concatenated human-yeast, and human with STY phosphorylation. Inset: Search times for human (blue) and yeast (green) databases. Relative database sizes are depicted as rectangles for human and yeast searches. Search parameters: forward (F) target peptide and reversed (R) decoy peptides, 50 ppm precursor tolerance, default low resolution Comet search, three isotopic windows, methionine oxidation [Ox(M)]. Variable modification (VM). The runs were technical replicates of Hyper standard.
In lieu of the E-value calculation (removed to improve search speeds), Orbiter performs a multifeature linear discriminant analysis (LDA) to distinguish high quality PSMs from low quality PSMs (Figure 3, SI Figure S2).9,28 Orbiter’s LDA uses seven PSM score parameters derived from the output of Comet’s database search: XCorr, deltaCorr, number of missed cleavages, charge state, absolute ppm error, peptide length, and the fraction of ions matched.15 For the ppm error, Orbiter search results were employed to simultaneously track and adjust the ppm error on the fly based on instrument performance (e.g., temperature changes causing Orbitrap mass accuracy drift). The LDA resulted in a final discriminant score that efficiently separated target from decoy PSMs (SI Figure S3A).
Figure 3.
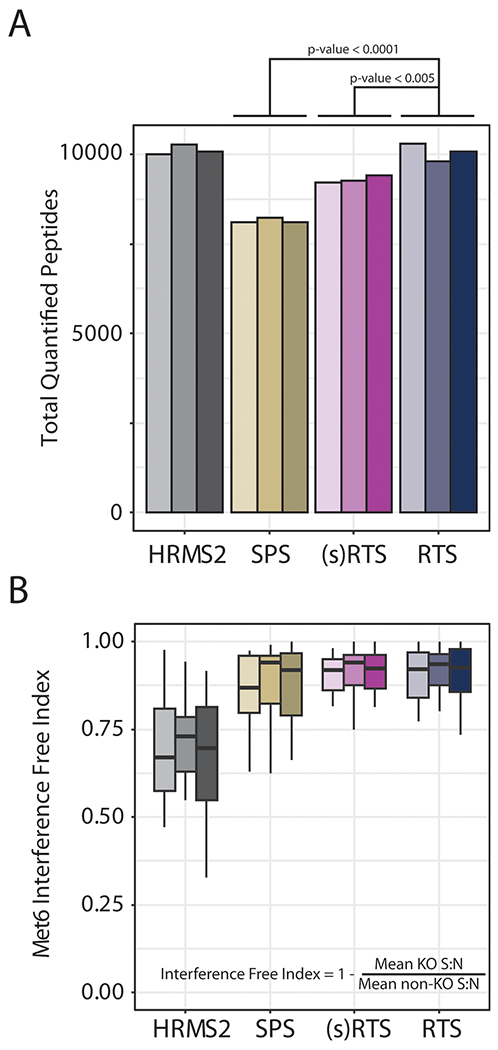
Real-time search improved total quantified peptide identifications and quantitative accuracy. Data from three technical replicates. A, Total peptide identifications for HRMS2, SPS-MS3, simple filter RTS (no rtFDR), RTS with rtFDR. Statistically significant differences compared to RTS are shown. B, Interference free index calculation (Met6 channels) for each of the methods in A.
The training data for Orbiter’s LDA was derived from all previous PSMs observed within the single run with and XCorr greater than 1. Therefore, to ensure that this LDA was not biased compared to offline discriminant analysis using all PSMs from the run, we compared online versus offline LDA on the same run (SI Figure S3). While reduced training set did have an effect on the LDA coefficients, this result was minor as noted by the highly correlated LDA coefficients (SI Figure S3B). To account for the possibility of LDA score threshold convergence over the course of a run we set the required FDR to be less than 20% for triggering to minimize the effect of peptide elution on RTS-triggering (SI Figure S4). The resulting discriminant scores across all PSMs were highly similar. When enabled, the PSMs that passed the user-defined FDR filter and did not originate from decoy peptides trigger SPS-MS3 scans. Filtering of low confidence and decoy peptides greatly reduces the number of SPS-MS3 scans triggered, and the FDR filter can be combined with protein inclusion/ exclusion filters to enable Orbiter to target subproteomes, for example, kinases.4
By eliminating SPS-MS3 scans downstream of MS2 scans that matched to low scoring or decoy peptides, Orbiter can improve instrument acquisition efficiency for multiplexed analyses. To assess this, we analyzed (1) a whole cell lysate yeast standard (TKO standard 29), (2) the Hyper standard (human yeast interference standard),6 and (3) a deep proteome analysis of three divergent cell lines from multiple tissues of origin (i.e., mammary gland, colon, embryonic kidney). In the first experiment, replicate injections (n = 3) of TKO were analyzed by either HRMS2, SPS-MS3, or RTS using a 2 h LC gradient. Additionally, we compared RTS without rtFDR filtering—simple filter or (s)RTS, to improve acquisition performance (Figure 3). HRMS2 quantified the largest number of peptides (mean = 10117; SD = 136) closely followed by RTS (mean = 10060; SD = 245). RTS significantly outperformed both (s)RTS (mean = 8150; SD = 74.8; p-value <0.005, ANOVA/Tukey) and SPS-MS3 methods (mean = 9298; SD = 109; p-value <0.0001, ANOVA/Tukey).
The Hyper standard consists of yeast peptides diluted at three different concentrations (1X, 1.5X, 3x) into a background of human peptides (SI Figure S5). This standard enables assessment of isobaric interference and quantitative accuracy in a complex proteomic sample. Using the Hyper standard we observed a small (median RTS “3-fold” ratio = 2.87; median SPS-MS3 “3-fold” ratio = 2.69; median HRMS2 “3-fold” ratio = 2.02), significant improvement in the quantitative accuracy of Orbiter’s RTS method compared to both HRMS2 and SPS-MS3 methods (SI Figure S5).
For the deep proteomic analysis of divergent cell lines, biological replicates for each of three cell lines (HEK293T, HCT116, and MCF7) were labeled with TMT reagents and mixed in equal proportion (Figure 4A). The cell line panel was then processed as described previously and pooled into 12 high-pH reversed phase fractions.13 Each of these fractions was analyzed either with an SPS-MS3 method running 180 min gradients—the current standard30 for SPS-MS3 multiplexed methods—or an Orbiter method running 90 min gradients using the previously described protein close-out (Figure 4B).4 Thus, we tested if Orbiter could reach the same quantitative accuracy and proteome coverage of SPS-MS3 in half the gradient time. After offline filtering to a peptide and protein FDR less than 1%, the SPS-MS3 method quantified 8455 proteins in 36 h. In just 18 h, the Orbiter RTS method quantified 8166 (97% of the SPS-MS3 method). These data emphasized a near doubling of the instrument acquisition speed from 234 proteins quantified per hour with SPS-MS3 to 454 proteins quantified per hour with Orbiter RTS. The resulting SPS-MS3 and Orbiter ratios were highly correlated (Pearson’s rHCT116/HEK293T = 0.943; rMCF7/HEK293T = 0.949; rMCF7/HCT116 = 0.946) (Figure 4C, SI Figure S6).
Figure 4.
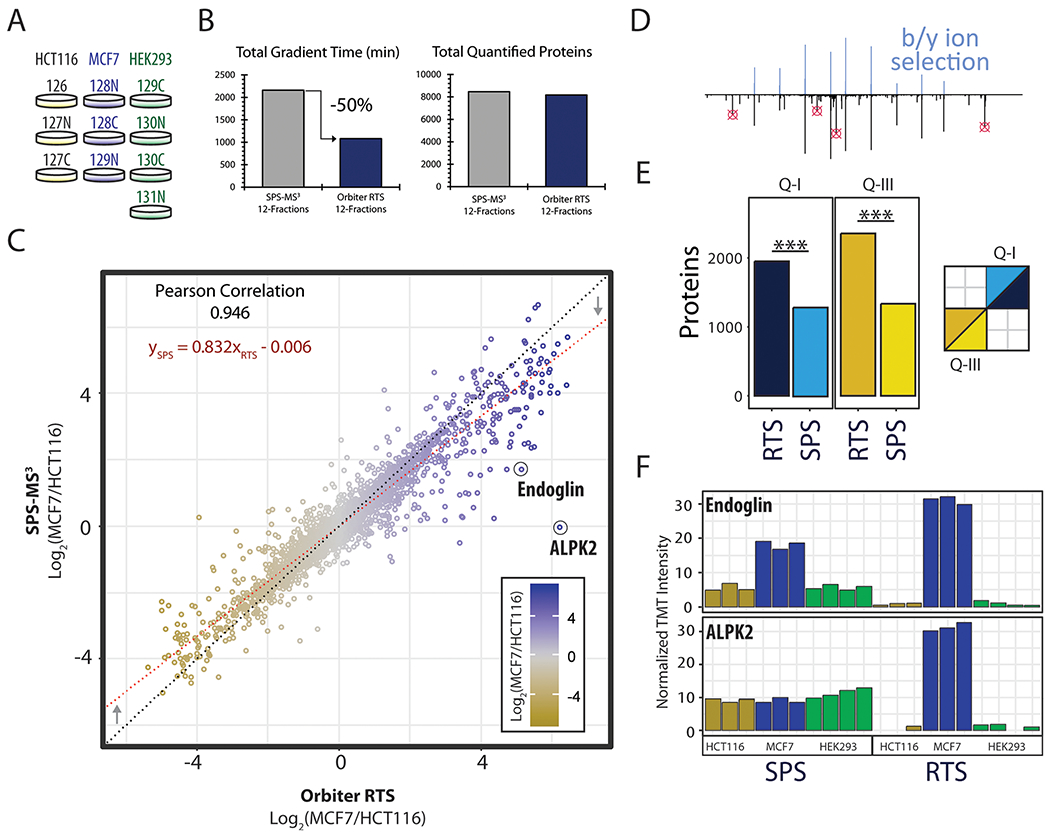
Quantitative comparison of Orbiter’s RTS and canonical SPS-MS3 method. A, Cell line panel. B, Comparison of total gradient time used and the total number of quantified proteins for each experiment. Orbiter quantified more than 8000 proteins in 50% of the gradient time. C, Ratio comparison of Orbiter results and SPS-MS3. The two methods were highly correlated. Formula for the linear model (red dotted line) with coefficients shown in red. D, the skew seen in B was likely due in part to improved quantitation using b/y-ion selection for SPS ions. E, Orbiter’s RTS quantified proteins were significantly enriched for higher larger quantitative ratios. Quadrants: Q-I (SPS ratio >0, Orbiter ratio >0) and Q-III (SPS ratio <0 and Orbiter ratio <0). Asterisks (***) denote Fisher’s Exact test p-value <0.0001. Inset: regions of plot in C tested for enrichment. F, Example proteins with improved quantitation using Orbiter’s RTS: ALPK2, and Endoglin.
Although the ratios were highly correlated, we observed a skew with Orbiter ratios having, in general, greater absolute values resulting in a slope of 0.83 for the linear regression (Figure 4C). We built Orbiter’s RTS to select MS3 precursors only from b-ions for arginine terminated peptides or b- and y-ions for lysine terminated peptides (Figure 4D). In contrast, standard SPS-MS3 precursors were selected based on the top-n most intense ions in the preceding MS2 scan. Standard SPS-MS3 ions, therefore, may not originate from the matched peptide.3 To estimate the extent of the improved RTS accuracy we compared quadrants I and III of the ratio scatter plot to determine if the Orbiter quantification was enriched for larger relative ratios compared to SPS-MS3. The null hypothesis for these tests was that an equal number of protein ratios were higher using Orbiter compared to SPS-MS3 as were higher using SPS-MS3 compared to Orbiter. Strikingly, by Fisher’s Exact test we observed a significant enrichment of larger quantitative measurements using Orbiter, suggesting that RTS with Comet improved quantitative accuracy (Figure 4E). We highlight two examples of this for the proteins Endoglin (CD105) and ALPK2 (Figure 4F). In each case, Orbiter greatly reduced the quantitative isobaric interference revealing large, cell line specific ratios (Figure 4E). Quantitation was verified by Western blotting using the same cell line lysates used for proteome comparison (SI Figure S7and Figure S8). For both ALPK2 and Endoglin, the RTS results more accurately reflected the true protein abundance of these proteins. For example, the Western blotting results for ALPK2 had high correlation to the RTS quantitation but were anticorrelated to the SPS-MS3 results (with RTS: Pearson’s rALPK2 = 0.964; without RTS: rALPK2 = −0.451, Figure 4F, S8B).
The Orbiter platform was built as a flexible RTS pipeline to enable rapid deployment of new search-based acquistion methods. While the initial use case aimed to improve accuracy and acquisition efficiency for multiplex-based SPS-MS3 scans, the RTS via Comet could rapidly be extended to diverse applications, such as selection of fragmentation schemes for complex sample types based on identifying a specific peptide/post-translational modification (e.g., ETD/HCD for glycopeptide analysis) or real-time filtering for cross-linked peptide analysis. With respect to the analysis of post-translational modifications further work will be needed to optimize and validate the effects of larger database sizes on search speeds and the efficacy of the current FDR filtering pipeline. Finally, based on the success of RTS for improving instrument acquisition efficiency, the core search functionality developed here has been implemented as a feature for the newest generation of Thermo Tribrid instruments, the Orbitrap Eclipse.
Supplementary Material
Figure S1. Duty cycle for RTS-MS3 and SPS-MS3 workflows. Figure S2. Histograms comparing mass error of the theoretical matched peptide MH+ versus instrument reported precursor mass or the Orbiter-corrected monoisotopic MH+. Figure S3. Real-time false discovery rate (rtFDR) to separate target and decoy matches and calculate false discovery rates (FDRs) in real-time. Figure S4. Convergence of the LDA Score threshold. Figure S5. Hyper standard quantitative comparison. Figure S6. Scatter plots for the three cell line binary comparisons. Figure S7. Western blotting analysis of Endoglin (ENG). Figure S8. Western blotting analysis of ALPK2(PDF)
■ ACKNOWLEDGMENTS
We thank Jiaming Li, Julian Mintseris, David Nusinow, Miljan Kuljanin, Dylan Mitchell, Mark Jedrychowski, and Marian Kalocsay for advice and assistance during method development and implementation. We also thank Jesse Canterbury, Graeme McAlister, and Phil Remes for technical assistance and advice. We acknowledge the following sources of funding: GM132129 to J.A.P. and GM067945 to S.P.G.
Footnotes
Supporting Information
The Supporting Information is available free of charge at https://pubs.acs.org/doi/10.1021/acs.jproteome.9b00860.
The authors declare no competing financial interest.
Complete contact information is available at: https://pubs.acs.org/10.1021/acs.jproteome.9b00860
Contributor Information
Devin K. Schweppe, Harvard Medical School, Department of Cell Biology, Cambridge, Massachusetts 02155, United States.
Jimmy K. Eng, University of Washington Proteomics Resource, Seattle, Washington 98109, United States.
Qing Yu, Harvard Medical School, Department of Cell Biology, Cambridge, Massachusetts 02155, United States.
Derek Bailey, Thermo Scientific LSMS, San Jose, California 95134, United States.
Ramin Rad, Harvard Medical School, Department of Cell Biology, Cambridge, Massachusetts 02155, United States.
Jose Navarrete-Perea, Harvard Medical School, Department of Cell Biology, Cambridge, Massachusetts 02155, United States.
Edward L. Huttlin, Harvard Medical School, Department of Cell Biology, Cambridge, Massachusetts 02155, United States.
Brian K. Erickson, Harvard Medical School, Department of Cell Biology, Cambridge, Massachusetts 02155, United States.
Joao A. Paulo, Harvard Medical School, Department of Cell Biology, Cambridge, Massachusetts 02155, United States
Steven P. Gygi, Harvard Medical School, Department of Cell Biology, Cambridge, Massachusetts 02155, United States.
■ REFERENCES
- (1).Thompson A; et al. Tandem mass tags: a novel quantification strategy for comparative analysis of complex protein mixtures by MS/MS. Anal. Chem 2003, 75, 1895–1904. [DOI] [PubMed] [Google Scholar]
- (2).Ting L; Rad R; Gygi SP; Haas W MS3 eliminates ratio distortion in isobaric multiplexed quantitative proteomics. Nat. Methods 2011, 8, 937–940. [DOI] [PMC free article] [PubMed] [Google Scholar]
- (3).McAlister GC; et al. MultiNotch MS3 enables accurate, sensitive, and multiplexed detection of differential expression across cancer cell line proteomes. Anal. Chem 2014, 86, 7150–7158. [DOI] [PMC free article] [PubMed] [Google Scholar]
- (4).Erickson BK; et al. Active Instrument Engagement Combined with a Real-Time Database Search for Improved Performance of Sample Multiplexing Workflows. J. Proteome Res 2019, 18, 1299–1306. [DOI] [PMC free article] [PubMed] [Google Scholar]
- (5).Pfammatter S; Bonneil E; Thibault P Improvement of Quantitative Measurements in Multiplex Proteomics Using High-Field Asymmetric Waveform Spectrometry. J. Proteome Res 2016, 15, 4653–4665. [DOI] [PubMed] [Google Scholar]
- (6).Schweppe DK; et al. Characterization and Optimization of Multiplexed Quantitative Analyses Using High-Field Asymmetric-Waveform Ion Mobility Mass Spectrometry. Anal. Chem 2019, 91, 4010–4016. [DOI] [PMC free article] [PubMed] [Google Scholar]
- (7).Bailey DJ; McDevitt MT; Westphall MS; Pagliarini DJ; Coon JJ Intelligent data acquisition blends targeted and discovery methods. J. Proteome Res 2014, 13, 2152–2161. [DOI] [PMC free article] [PubMed] [Google Scholar]
- (8).Graumann J; Scheltema RA; Zhang Y; Cox J; Mann M A framework for intelligent data acquisition and real-time database searching for shotgun proteomics. Mol. Cell. Proteomics 2012, 11, M111 013185. [DOI] [PMC free article] [PubMed] [Google Scholar]
- (9).Zhang J; Li J; Xie H; Zhu Y; He F A new strategy to filter out false positive identifications of peptides in SEQUEST database search results. Proteomics 2007, 7, 4036–4044. [DOI] [PubMed] [Google Scholar]
- (10).Eng JK; et al. A deeper look into Comet-implementation and features. J. Am. Soc. Mass Spectrom 2015, 26, 1865–1874. [DOI] [PMC free article] [PubMed] [Google Scholar]
- (11).Eng JK; Jahan TA; Hoopmann MR Comet: an open-source MS/MS sequence database search tool. Proteomics 2013, 13, 22–24. [DOI] [PubMed] [Google Scholar]
- (12).Keller A; Eng J; Zhang N; Li XJ; Aebersold R A uniform proteomics MS/MS analysis platform utilizing open XML file formats. Mol. Syst. Biol 2005, 1 (2005), 0017. [DOI] [PMC free article] [PubMed] [Google Scholar]
- (13).Navarrete-Perea J; Yu Q; Gygi SP; Paulo JA Streamlined Tandem Mass Tag (SL-TMT) Protocol: An Efficient Strategy for Quantitative (Phospho)proteome Profiling Using Tandem Mass Tag-Synchronous Precursor Selection-MS3. J. Proteome Res 2018, 17, 2226–2236. [DOI] [PMC free article] [PubMed] [Google Scholar]
- (14).Eng JK; McCormack AL; Yates JR An approach to correlate tandem mass spectral data of peptides with amino acid sequences in a protein database. J. Am. Soc. Mass Spectrom 1994, 5, 976–989. [DOI] [PubMed] [Google Scholar]
- (15).Huttlin EL; et al. A tissue-specific atlas of mouse protein phosphorylation and expression. Cell 2010, 143, 1174–1189. [DOI] [PMC free article] [PubMed] [Google Scholar]
- (16).R Core Team. R A Language and Environment for Statistical Computing, https://www.R-project.org (2018).
- (17).Senko MW; Beu SC; McLaffertycor FW Determination of monoisotopic masses and ion populations for large biomolecules from resolved isotopic distributions. J. Am. Soc. Mass Spectrom 1995, 6, 229–233. [DOI] [PubMed] [Google Scholar]
- (18).He L; Diedrich J; Chu YY; Yates JR 3rd Extracting Accurate Precursor Information for Tandem Mass Spectra by RawConverter. Anal. Chem 2015, 87, 11361–11367. [DOI] [PMC free article] [PubMed] [Google Scholar]
- (19).de Souza CR (2009). [Google Scholar]
- (20).Huttlin EL; Hegeman AD; Harms AC; Sussman MR Prediction of error associated with false-positive rate determination for peptide identification in large-scale proteomics experiments using a combined reverse and forward peptide sequence database strategy. J. Proteome Res 2007, 6, 392–398. [DOI] [PMC free article] [PubMed] [Google Scholar]
- (21).de Leeuw J; Hornik K; Mair P Isotone Optimization in R: Pool-Adjacent-Violators Algorithm (PAVA) and Active Set Methods. J. Stat. Software 2009, 32, 24 (2009). [Google Scholar]
- (22).Sing T; Sander O; Beerenwinkel N; Lengauer T ROCR: visualizing classifier performance in R. Bioinformatics 2005, 21, 3940–3941. [DOI] [PubMed] [Google Scholar]
- (23).Rueden CT; et al. ImageJ2: ImageJ for the next generation of scientific image data. BMC Bioinf. 2017, 18, 529. [DOI] [PMC free article] [PubMed] [Google Scholar]
- (24).Hogrebe A; et al. Benchmarking common quantification strategies for large-scale phosphoproteomics. Nat. Commun 2018, 9, 1045. [DOI] [PMC free article] [PubMed] [Google Scholar]
- (25).Madar IH; et al. Multiplexed Post-Experimental Monoisotopic Mass Refinement (mPE-MMR) to Increase Sensitivity and Accuracy in Peptide Identifications from Tandem Mass Spectra of Cofragmentation. Anal. Chem 2017, 89, 1244–1253. [DOI] [PMC free article] [PubMed] [Google Scholar]
- (26).Shin B; et al. Postexperiment monoisotopic mass filtering and refinement (PE-MMR) of tandem mass spectrometric data increases accuracy of peptide identification in LC/MS/MS. Mol. Cell. Proteomics 2008, 7, 1124–1134. [DOI] [PubMed] [Google Scholar]
- (27).O’Connell JD; Paulo JA; O’Brien JJ; Gygi SP Proteome-Wide Evaluation of Two Common Protein Quantification Methods. J. Proteome Res 2018, 17, 1934–1942. [DOI] [PMC free article] [PubMed] [Google Scholar]
- (28).Du X; et al. Linear discriminant analysis-based estimation of the false discovery rate for phosphopeptide identifications. J. Proteome Res 2008, 7, 2195–2203. [DOI] [PMC free article] [PubMed] [Google Scholar]
- (29).Paulo JA; O’Connell JD; Gygi SP A Triple Knockout (TKO) Proteomics Standard for Diagnosing Ion Interference in Isobaric Labeling Experiments. J. Am. Soc. Mass Spectrom 2016, 27, 1620–1625. [DOI] [PMC free article] [PubMed] [Google Scholar]
- (30).Chick JM; et al. Defining the consequences of genetic variation on a proteome-wide scale. Nature 2016, 534, 500–505. [DOI] [PMC free article] [PubMed] [Google Scholar]
Associated Data
This section collects any data citations, data availability statements, or supplementary materials included in this article.
Supplementary Materials
Figure S1. Duty cycle for RTS-MS3 and SPS-MS3 workflows. Figure S2. Histograms comparing mass error of the theoretical matched peptide MH+ versus instrument reported precursor mass or the Orbiter-corrected monoisotopic MH+. Figure S3. Real-time false discovery rate (rtFDR) to separate target and decoy matches and calculate false discovery rates (FDRs) in real-time. Figure S4. Convergence of the LDA Score threshold. Figure S5. Hyper standard quantitative comparison. Figure S6. Scatter plots for the three cell line binary comparisons. Figure S7. Western blotting analysis of Endoglin (ENG). Figure S8. Western blotting analysis of ALPK2(PDF)