Abstract
The Interstate Highway System (IHS) used to be a symbol of American growth and its economic machine, but the IHS has not been expanded much since its inception. Recently there are both executive and legislative desires to restore and upgrade the IHS to its role as a premier system that can meet the growing and changing demands of the twenty-first century. Demographic forecasting is a precursor to rational transportation planning and decision activities. This paper provides population projections into 2060 at the county level for the entire US using cohort-component methods. We found that the US is projected to experience population growth across all age groups over the next 50 years. The projected growth, however, varies across the entire US. Population growth areas are in the west/south/east border states and the Atlanta-NC-Nashville triangle. Population decline areas include many counties from the northeast corner to the Appalachian region, counties bordering the five Great Lakes, counties along the Mississippi River, the Deep South states, and Alaska. We also identified the counties that may need additional or less transport capacity based on projected population change and proximities to IHS. We further identified the counties with high population density but without the IHS network that are projected to experience rapid population growth. IHS demands will be affected by the aging population, the young population, baby boomers, millennials, immigrants, telecommuting, and autonomous vehicles. This study provides the necessary demographic forecasting for decision and policy makers in better deciding whether and where to expand or invest in the IHS when the resources become available.
Keywords: Interstate Highway System, demographic forecasting, population projection, population change, cohort component method, spatial overlay
1. Introduction
Highways have, since their creation, played an important role in transforming society and impacting population change (Baum-Snow 2007; Vandenbroucke 2008). The Interstate Highway system was funded in 1956, and thus began the development of Interstate Highway infrastructure in the United States. As of 2017, the Interstate Highway System (IHS) has a total length of 48,489 miles. The average number of daily vehicles per lane for urban and rural interstates are 5,586 and 13,646, respectively (Federal Highway Administration 2017). Today, the IHS handles nearly 25 percent of the total vehicle travel and 40 percent of total truck traffic, with only 1.2 percent roadway line-miles of the US’s public road system (TRB 2017).
Although the IHS used to be a symbol of American growth and its economic machine, the IHS network has rarely been expanded since its inception. IHS activities of today mainly upgrade already existing highways rather than construct new ones. In 2002 it was stated by the Executive Director of the National Academies’ Transportation Research Board that a majority of the existing highway systems, especially the interstates and principal highways, would need to be revamped in the near future (Skinner 2002). In 2009 the Obama Administration planned to heavily invest in the transportation infrastructure with the American Recovery and Reinvestment Act. Furthermore, in 2017 the Trump Administration proposed to revitalize the transportation infrastructure. Also, Section 6021 of the Fixing America’s Surface Transportation Act of 2015 demands a study of actions needed to restoring and upgrading the IHS to its role as a premier system that can meet the growing and changing demands of the twenty-first century.
The future is a mystery, especially with rapid technological innovations. With many unknowns about the future, how to plan for future IHS investment and where and how much to allocate the investment? Among the many elements of transportation planning, population forecasting is a must. It is well established that population change and highway expansions are closely related (Voss and Chi 2006). Transportation planning almost always starts with demographic forecasting (Moore and Thorsnes 1994).
The objectives of this study are to (1) produce population projections into 2060 at the county level; and (2) develop a method to identify counties that are projected to need additional (or less) IHS capacity. We also discuss the implications of the many unknowns, including the aging population and baby boomers, the young population and millennials, immigrants, telecommuting, and autonomous vehicles that could impact travel demands.
2. Population growth and Interstate Highway System
2.1. Prior research
The relationship between population growth and highway investment has been studied in a vast literature that spans multiple disciplines, from sociology and geography to planning and economics. This diverse study base has resulted in a complex amalgam of empirical and theoretical approaches. While it is reasonable to assume that population-highway dynamics is two-directional, there is disproportionally more research on highway effects on growth than the other way around (e.g., in Garrison et al. [1959]’s Studies of Highway Development and Geographic Change). The relationship between population change (or economic growth) and highway improvement1 (or travel demand) has been found to be bi-directional and has feedback effects (Hobbs and Campbell 1967). Better highways or higher travel demand stimulate economic growth while the economic growth simultaneously increases demand for higher-quality highway access (Aschauer 1990; Mikelbank 1996). Highways cause population change and economic growth because the investment in highways alters the status quo of the social and economic balance. This, then, affects population growth or decline, depending on the locational advantage or disadvantage. Conversely, population change and economic growth affect travel demand and highways in that they have an influence on decisions about highway expansions—growth in the population and economy causes demand for reliable and high-quality transportation networks.
Although much literature examines and several theories explain the impact that highways have on population change and economic growth, very few studies examine the impact of population growth on decisions to build new or expand existing highways—despite the fact that criteria for highway expansion decisions do exist at the federal and state planning levels (US Department of Transportation, Federal Highway Administration, and Wisconsin Department of Transportation 1998; Wisconsin Department of Transportation 1983, 2003). These criteria include public concerns, safety and congestion, economic benefit and cost, roadway deficiencies, forecasts of future demand, and environmental impacts. A key indicator of safety and congestion is traffic flow. Traffic flow can increase slowly through natural regional growth, or it can increase abruptly from large in-migration. Public concern is a criterion because citizens are generally involved in the planning and decision process of constructing or expanding a highway through formal petitions and public hearings (Wisconsin Department of Transportation 2003).
Lichter and Fuguitt (1980) also studied nonmetropolitan counties, comparing dates of highway completion to mean populations at the time. They found that Interstate Highways were constructed in counties with previous high net in-migration. Voss and Chi (2006) found that the dominant causal influence between population growth and highway construction appears to flow from highway construction to population growth. It should be noted that population and economic growth leads to higher travel demand, but do not necessarily lead to highway investments. The US has seen little highway investments over the past four decades although it experienced continual population and economic growth (Giuliano and Dargay 2006).
Overall, population growth and highway construction are closely related. In the transportation planning process, often a region is predicted to experience significant population growth so that highway construction or investment will follow. For the rest of this paper, we focus on the causal direction from population growth to highway investment to predict population and identify areas that could need more (or less) transport capacity.
2.2. Population and Interstate Highway system in 2010
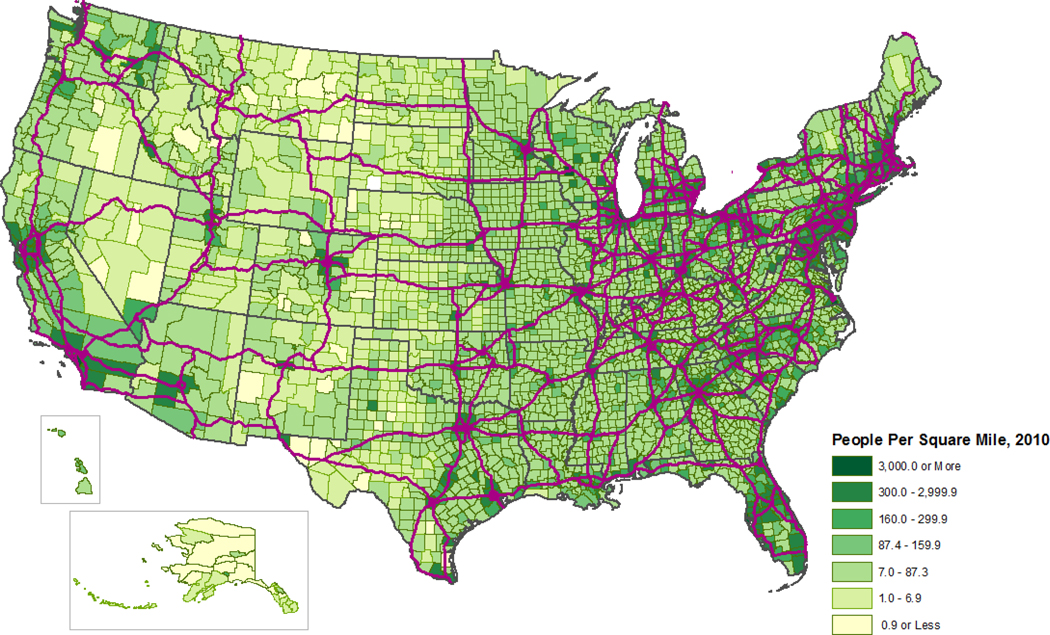
Figure 1 shows population density in 2010 at the county level using the Decennial Census of the US Census Bureau and the IHS network. Populations are concentrated in the Northwest corner of Washington and Oregon; California; lower Florida; the belt from Boston to Washington D.C.; the belt from Minneapolis, MN, to Pittsburgh, PA, along I-90 and I-94; from Atlanta, GA, to the Triangle of North Carolina; and the Southeastern Texas.
Figure 1.
Population Density in 2010 and the Interstate Highway System Network
The IHS network is correlated with population distribution. The nodes of the IHS network are often located in high-density counties. This echoes the initial purpose of the IHS network, which was to connect principal cities and metropolitan areas and to serve the national defense (US Department of Transportation 1970).
How does population distribution relate to the IHS network? In 2010, the 1,444 counties with IHS have 178,412 people on average (Table 1). In contrast, the 1,698 counties without IHS have 29,941 people on average. The IHS network serves a larger population beyond those in the counties where the IHS falls. Voss and Chi (2005) found that the IHS network has an influence over 20 miles of flight distance. In total there are 2,477 counties that fall within 20 miles of the IHS network. These counties have an average of 119,080 people in 2010, compared to an average of 20,312 people in the 665 counties that fall beyond 20 miles of the IHS network.
Table 1.
Descriptive Statistics of Population and Proximity to IHS in 2010
| N | Mean | Std Dev | Min | Max | |
|---|---|---|---|---|---|
| Counties with IHS | 1,444 | 178,412 | 440,712 | 415 | 9,825,473 |
| Counties without IHS | 1,698 | 29,941 | 78,950 | 83 | 2,510,240 |
| Counties within 20 miles of IHS | 2,477 | 119,080 | 349,453 | 83 | 9,825,473 |
| Counties beyond 20 miles of IHS | 665 | 20,312 | 29,348 | 90 | 293,415 |
3. Population projections into 2060 at the county level
3.1. Projection methodology, procedure, and assumptions
Cohort Component Methods.
There are many methods for population forecasting, including extrapolation projections and time-series models, postcensal population estimation models, knowledge-based regression models and structural models, conditional probabilistic models, integrated land use models, population forecasting by grid cells, and cohort component methods (Chi 2009; Smith et al. 2013; Wilson and Rees 2005). In this study, cohort component methods are selected to produce population projections into the future.
A study evaluating the projection accuracy of US population projections from 1953 to 1999 (Mulder 2002) found that for a 10-year projection the mean percentage errors range from –18% to 30% and the mean absolute percentage errors range from 6% to 30% at the national level; and from –14% to 45% and from 12% to 45% respectively for a 20-year projection. Despite of the large projection errors, cohort component methods provide the best projection accuracy (Smith et al. 2013). Cohort component methods are the default methods for population projections at the country, state, and county levels by the US Census Bureau, state agencies that are in charge of their population projections, and commercial companies.
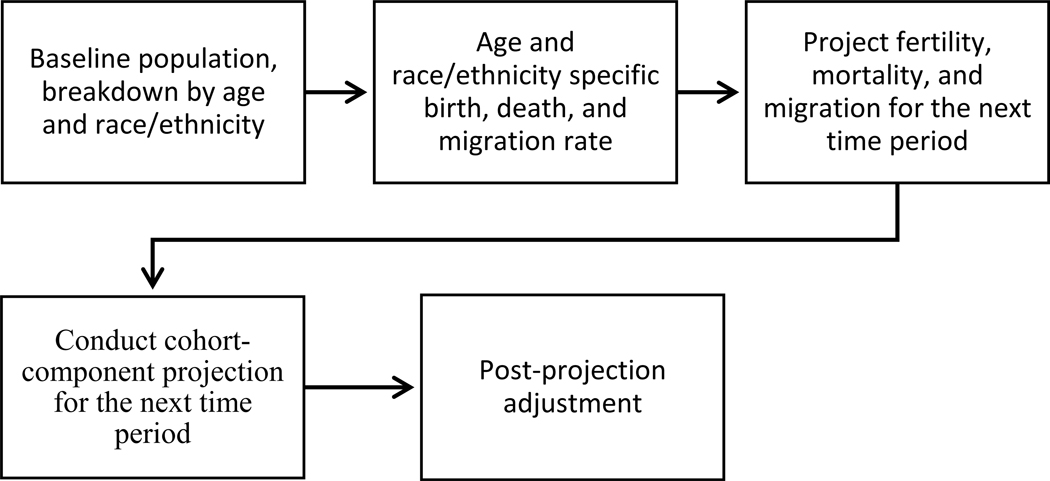
Cohort component methods project the three components of population change—births, deaths, and net migrants—separately for each birth cohort (i.e., persons born in a given year). The base population (by age, gender, and race/ethnicity) as of the projection launch year is projected each year by the projected survival rates and net migration rate. The births are projected and added to the population by applying the projected fertility rates to the female population. Cohort component methods produce population projection by age and gender for each year, and the projections are typically more accurate than what are produced by other methods at the county level and above (Smith et al. 2013). Population projections used in this paper are produced by the US Census Bureau and ProximityOne (a population projection consulting firm) using cohort component methods. The projection produced by the US Census Bureau is at the national level, while the projection produced by the ProximityOne is at the county level. Projection accuracy is higher at the national level than that at the state level, and the latter is higher than that at the county level. This is because at finer levels the migration, which is the most difficult to predict among the three components of population change, can affect population change greatly, but the variation of net migration across space could cancel out each other at coarser (or aggregated) levels. The equations and models of the cohort component projection method can be found in Appendix A. A simplified flow chart is provided to illustrate the population projection procedure (Figure 2).
Figure 2.
A Simplified Flow Chart Illustrating the Population Projection Procedure
Population estimates, projections, and forecasting.
Population estimates, population projections, and population forecasting are often used in demographic forecasting work, but they refer to different things. Population estimates are estimates of a population on or before the current date. Population projections are predictions of a population into the future. For example, at the time of writing it is 2017. The Census Bureau has already released its population estimates for years 2011, 2012, 2013, 2014, 2015, and 2016. Projections are for 2017 and after. Both population estimates and projections are produced using methods based on some assumptions. Population estimates and projections are not observed facts—they reflect best efforts to accurately determine these values at specific points in time.
The difference between projections and forecasting is less obvious. A projection embodies one or more assumptions, and a forecast is a projection that is most likely to occur based on judgment. Nevertheless, “projection” and “forecast” are often used interchangeably.
Estimation/projection methodology.
The population in year t as of July 1 for a county is estimated or projected as:
where
t refers to year t, on July 1;
Pt is resident population as of July 1, year t;
P[t−1] is resident population as of July 1, year [t−1];
B[t−1],t refers to births during period ([t−1]−6−30) to (t−7−1);
D[t−1],t refers to deaths during period ([t−1]−6−30) to (t−7−1);
M[t−1],t refers to net migrants during period ([t−1]−6−30) to (t−7−1).
The baseline launch year is 2010, as it is the latest decennial year in which the Census Bureau conducted population counting and it provides the most complete population data. For each subsequent year, the people are aged/advanced one year of age. The population estimates or projections are a product of population in the previous year, plus births that occur during the one-year period, minus deaths that occur during the one-year period, and plus net migration that occurs during the one-year period (Smith 2013; Preston et al. 2000). That is:
Population estimates and projections are developed for each individual county. This is done for each age (0–84 and 85+ years) by gender and race/ethnicity. The race/ethnicity is categorized by non-Hispanic White, non-Hispanic Black, Hispanics, and others. It should be noted that age-gender-race/ethnicity specific rates are used for births, deaths, and migration. The rates are discussed in the sections following. Totally the projection work produces:
These elemental projections are then aggregated to each county for each year to produce total population projections for each county in each year.
Establish baseline (launch point) population data.
2010 is the launch year because that is the latest decennial year when the Census Bureau conducted population counting and it provides the most complete population data. The decennial census is based on April 1, 2010. However, it makes more sense to use the mid-year as the point of reporting population. Plus, the ACS estimates are based on July 1. Therefore, before we begin we need to adjust the decennial census data from April 1, 2010, to July 1, 2010.The baseline population data estimated as of July 1, 2010, will be partitioned by 86 age groups by 2 genders by 4 race/ethnicity groups for each county.
Project births.
A new birth cohort is formed each year to be added to the population. For example, the cohort that is born between July 1, 2016, and June 30, 2017, is added to the population in 2017. Births are projected in three steps: (1) projecting age-race/ethnicity specific fertility rates using a linear extrapolation method; (2) applying the rates to the corresponding racial/ethnic female population aged 15 to 54 years (Preston et al. 2000); and (3) splitting the births into boys and girls based on a boy-girl ratio. Overall, the age-race/ethnicity specific fertility rates decline over time. To avoid extreme change in the fertility rates, the decline in the crude birth rate for any county from 2010–2060 is limited to −0.05. If a county’s crude birth rate is projected to decline more than 0.05 from 2010 to 2060, the decline is adjusted to 0.05. The choice of 0.05 and −0.05 is more of a practice of population projections (Smith et al. 2013).
Project deaths.
Deaths are subtracted from the population each year. For example, deaths that occurred between July 1, 2016, and June 30, 2017, are subtracted from the population in 2017. Deaths are projected in two steps: (1) projecting age-gender-race/ethnicity specific death rates for each county using a linear extrapolation method and (2) applying the rates to corresponding age-gender-race/ethnicity people. Overall, the age-gender-race/ethnicity specific death increase over time. To avoid extreme change in the death rates, the increase in the crude death rate for any county from 2010–2060 is limited to 0.05. If a county’s crude death rate is projected to increase more than 0.05 from 2010 to 2060, the increase is adjusted to 0.05.
Project net migration.
Net migration is added to the population each year. For example, net migration between July 1, 2016, and June 30, 2017, is added to the population in 2017. Net migration is projected in two steps: (1) projecting age-gender-race/ethnicity specific net migration rates for each county and (2) applying the rates to corresponding age-gender-race/ethnicity people. The migration rates are projected by following the migration patterns exhibited from 2010 to 2016.
Produce total population projections.
The total populations are projected for each county in each year by adding projected population in the previous year, births from the previous year, and net migration from the previous year and then subtracting deaths from the previous year.
In practice, population projections are often adjusted for the purpose of improving forecasting accuracy. Adjusting population projections can involve many steps. Two major considerations are (1) modifications to rein in severely abnormal change rates and (2) adjustment (or control) to national projections (WIDOA, 2004; Voss and Kale, 1986). Modification of abnormal change (growth or decline) rates is used to soften the occasional high population change rates that emerge when making population projections. If the population change rate in a county is unusually high, the projected rate is softened under the assumption that rapid population change cannot be sustained for long periods. If a county is projected to have a population of fewer than 100 people or even negative population in any given year, the projected population is set at 100 people.
The projected populations for each county after adjustment are aggregated to the national level and compared and adjusted to the national population projections as prepared by the US Census Bureau. The latter is seen as the golden standard for population projections in the US However, the Census Bureau does not produce population projections for states or counties.
It should be noted that the projections are made under the assumption that no major local or national disasters will occur between now and 2060. Unfortunately, this assumption becomes less valid as time passes. This is probably partly the reason the Census Bureau does not produce population projections for any subnational levels. This paper uses projections that reflect the most likely (or mid-level) demographic trends; alternative assumptions could be used to develop different projections.
3.2. Population projection results
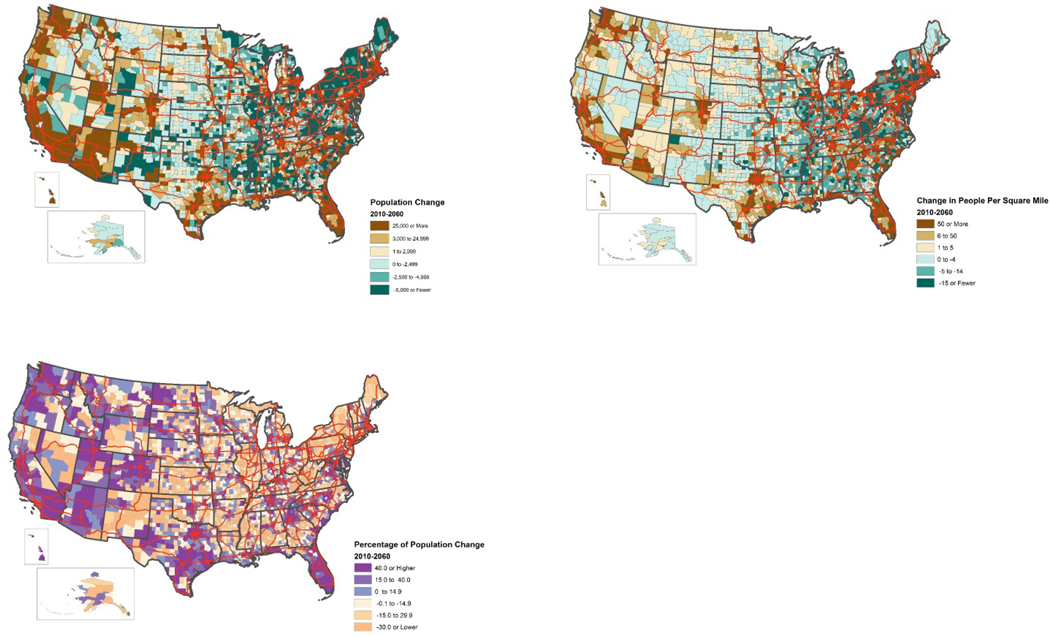
Following the methodology and procedure as described in the previous section, populations at the county level are projected into 2060. Figure 3 shows the change in population size, the percentage change in population size, and the change in population density from 2010–2060. Population growth areas seem to be concentrated in the border states of the west, south, and east, including Washington, Oregon, California, Arizona, Utah, Colorado, Southeast Texas, the Gulf Coast counties, Florida, counties on the east coast from Florida to Massachusetts, Hawaii, as well as the triangle between Atlanta, GA, the Triangle of North Carolina, and Nashville, TN.
Figure 3.
Population Change, Percentage Population Change, and Population Density Change, 2010–2060, and the IHS Network
There seem to be more counties that will experience population decline. This includes many counties from the northeast corner to the Appalachian region, counties bordering the five Great Lakes except Lake Michigan, counties along the Mississippi River, the Deep South states, and Alaska.
4. Counties that may need additional or less Interstate Highway System capacity
4.1. Population change from 2010–2060 and proximity to the IHS network
As discussed previously, there is generally a positive relationship between population change and highway needs. To identify counties that may need additional or less IHS capacity based on the projected population change and proximities to IHS, we use spatial overlay methods and proximity analysis. One assumption here is that the capacity utilization of existing highways will not change. Another assumption is that population in each county, regardless age, gender, and race/ethnicity, behaves the same in terms of driving over the next 50 years. The potential implications of different demographic groups are discussed in the next section.
There are 1,444 counties with IHS; these counties are projected to have an average of 247,207 people in 2060 (Table 2). In contrast, there are 1,698 counties without IHS; these counties are projected to have an average of 34,203 people in 2060. When we include counties that fall within 20 miles of the IHS network, there are 2,477 counties with an average of 161,821 people in 2060. There are 665 counties that are beyond 20 miles of the IHS network, with a projected average of 21,372 people in 2060.
Table 2.
Descriptive Statistics of Population and Proximity to IHS in 2060
| N | Mean | Std Dev | Min | Max | |
|---|---|---|---|---|---|
| Counties with IHS | 1,444 | 247,207 | 637,467 | 104 | 12,099,604 |
| Counties without IHS | 1,698 | 34,203 | 110,294 | 100 | 3,263,590 |
| Counties within 20 miles of IHS | 2,477 | 161,821 | 504,828 | 104 | 12,099,604 |
| Counties beyond 20 miles of IHS | 665 | 21,372 | 40,346 | 100 | 477,731 |
In Figure 3, the IHS network passes through both growing counties and declining counties. Counties with the IHS network are compared to those without by population change from 2010–2060. The former is projected to gain an average of 68,795 people over the 50 years, while the latter is projected to gain an average of only 4,262 people in the same time period. The overall percentage population change 2010–2060 in the United States is 38.56% for counties with IHS and 14.23% for counties without IHS.
4.2. Counties along or close to the IHS network that may need additional or fewer IHS capacity
The counties that are projected to gain or lose population along the IHS network are highlighted in Figure 4. The left map shows the counties that are projected to gain population from 2010–2060. These are the counties that may need additional IHS capacity based on their population projections. The needs are particularly strong in counties along I-5 from Washington to San Diego, CA; counties from Los Angeles, CA, to Phoenix, AZ, along I-10; counties from Los Angeles, CA, to Albuquerque, NM, along I-40; counties from Los Angeles, CA, to Utah along I-15; counties along I-20, I-35, and I-45 spreading from Dallas, TX; counties along I-20 from San Antonio, TX, to Pensacola, FL; the lower Florida counties; counties in the big triangle of Atlanta, GA, the Triangle of North Carolina, and Nashville, TN; counties along I-95 from Washington, D.C., to Boston, MA; and counties from Minneapolis, MN, to Detroit, MI, along I-90 and I-94.
Figure 4.
Projected Growing or Declining Counties Along the IHS Network
The right map of Figure 4 shows the counties that are projected to lose population from 2010–2060. These are the counties that could need less IHS capacity based on their population projections. These counties include those from Cleveland, OH, to Boston, MA, along I-90; those from Rockford, IL, to Memphis, TN, along I-39 and I-55; and those along I-25 in New Mexico.
Counties that fall within 20 miles of the IHS system are projected to gain an average of 42,742 people over the 50 years. Counties that fall beyond 20 miles of the IHS system are projected to gain an average of merely 1,060 people. The overall percentage population change 2010–2060 in the United States is 35.89% for counties within 20 miles of IHS and 5.22% for counties beyond 20 miles of IHS.
The counties that are projected to potentially need additional IHS capacity based on the 20-mile criterion are highlighted in the left map of Figure 5. Based on their decreased populations, the counties that are projected to potentially need less IHS capacity based on the 20-mile criterion are highlighted in the right map of Figure 5. Overall, the results are similar to those based on the with or without the IHS network results, but the former includes more surrounding counties.
Figure 5.
Counties Neighboring the IHS with Projected Increasing or Decreasing Populations
4.3. Counties without the IHS network but projected to experience rapid growth
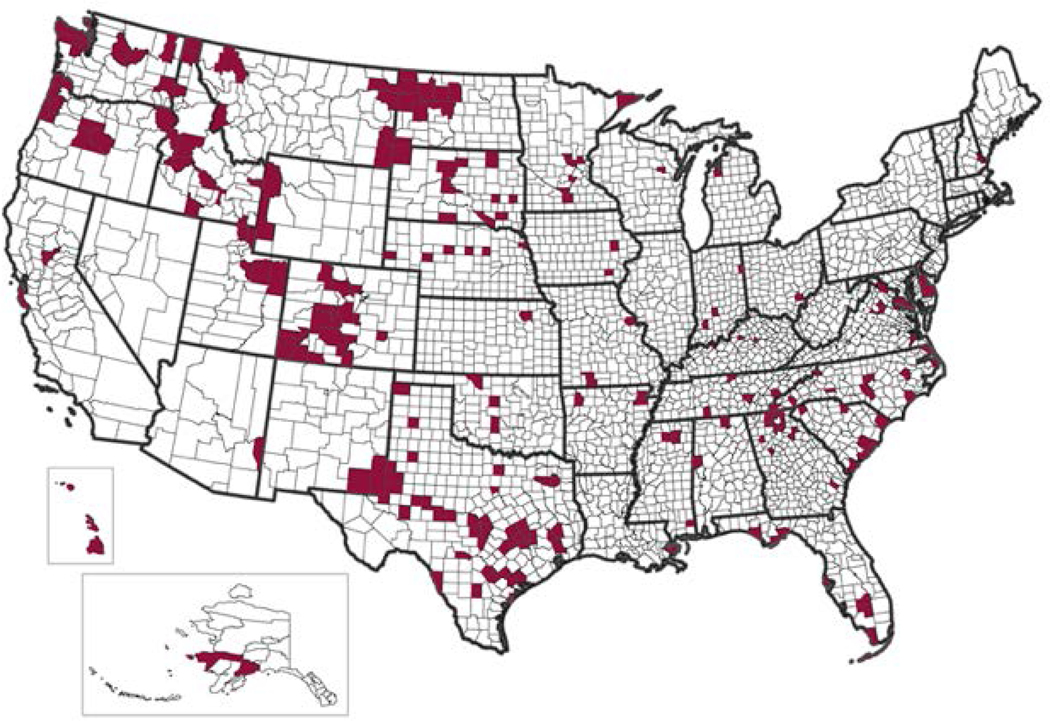
The counties identified in the previous section either have the IHS network or are within 20 miles of the IHS network. The remaining counties of the US could still have a potential to be invested with a new IHS network (or segments), if they have high population density and are predicted to experience rapid population growth. To identify these possible counties, two criteria are used. One, they should rank the top 50% among all growing counties as measured by population growth rate. Two, they should rank the top 50% among all growing counties as measured by population density increase. Figure 6 highlights such counties that do not have an IHS network. These counties scatter from the northwest corner of Washington to the west of Colorado; from the southeast corner of New Mexico to Houston, TX; the tristate counties of Montana and Dakotas; northwest of ND; and Hawaii.
Figure 6.
Growing Counties That Do Not Have the IHS Network
Note: The highlighted counties are selected based on both the top 50% population growth rate and the top 50% population density increase (the difference of population density between 2060 and 2010).
5. Implications of aging population, millennials, immigrants, telecommuting, and autonomous vehicles
Population projection is produced on the basis of many assumptions as addressed previously. In addition, there are further unknowns that could affect IHS demands. In the United States the number of vehicle miles traveled (VMT) per person grew until 2007, declined to 2014 (Sivak 2013), and has been rising since then but is still below the 2007 level. The overall long-term growth in miles traveled may be attributed to changing demographics, an improving economy, and cheaper fuel prices (Chi et al. 2010; Zmud et al. 2014). In this section, we discuss the implications of foreseeable demographic changes (e.g., population aging and baby boomers’ life courses), as well as changes that are difficult to predict their magnitude (e.g., immigrants and telecommuting) or impacts (e.g., autonomous vehicles).
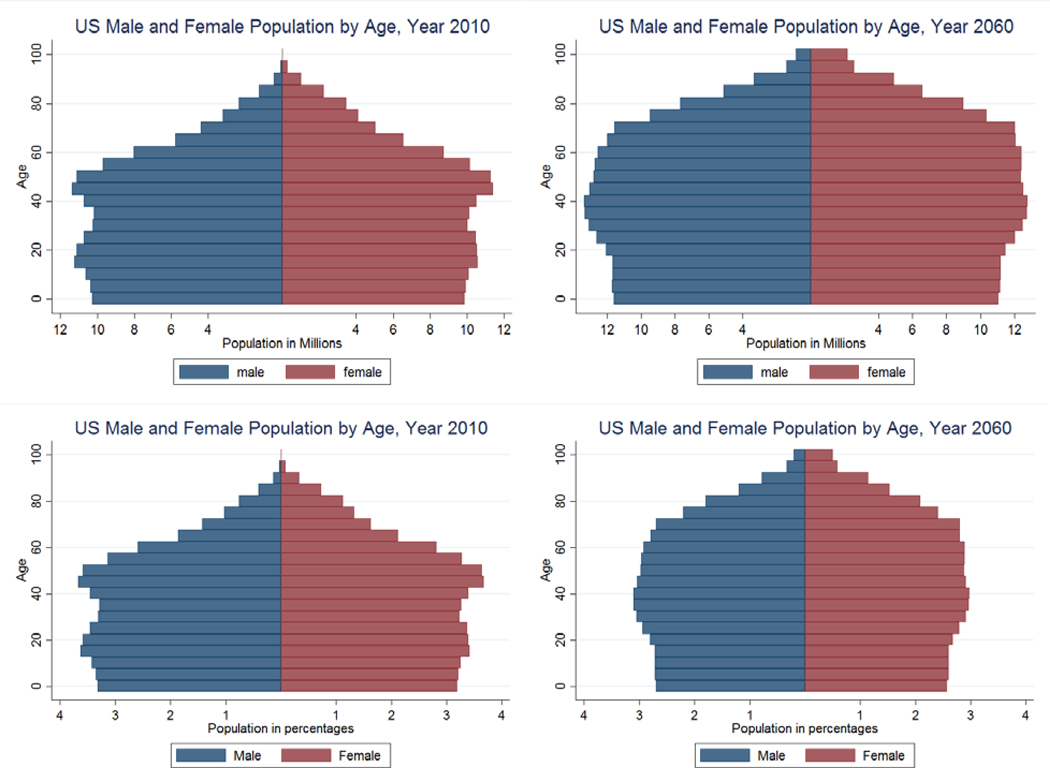
In order to understand the age variations of the IHS usages, it is helpful to understand the population pyramids of the United States. In 2010, the US population is approximately equally distributed from age 0 to age 60 but declines quickly after that (Figure 7). This suggests that the US population is still relatively a “mature” population. While all age groups are projected to increase in the 50 years old, the elderly (age 65+) increase more.
Figure 7.
Population Pyramids in 2010 and 2060
5.1. The aging population
Studies have shown that increasing numbers of older people continue to have driver’s licenses and to drive (Sivak and Schoettle 2011; Stokes 2012). They take fewer daily trips, travel shorter distances, and have shorter travel times than people under age 64 (Collia et al. 2003). Older people drive at different times than younger people, with much of the older population’s driving occurring between the hours of 9:00 am and 4:00 pm. However, they prefer to drive (rather than fly or take a train) when going on long-distance trips, and they drive more miles on these trips than younger people (Collia et al. 2003).
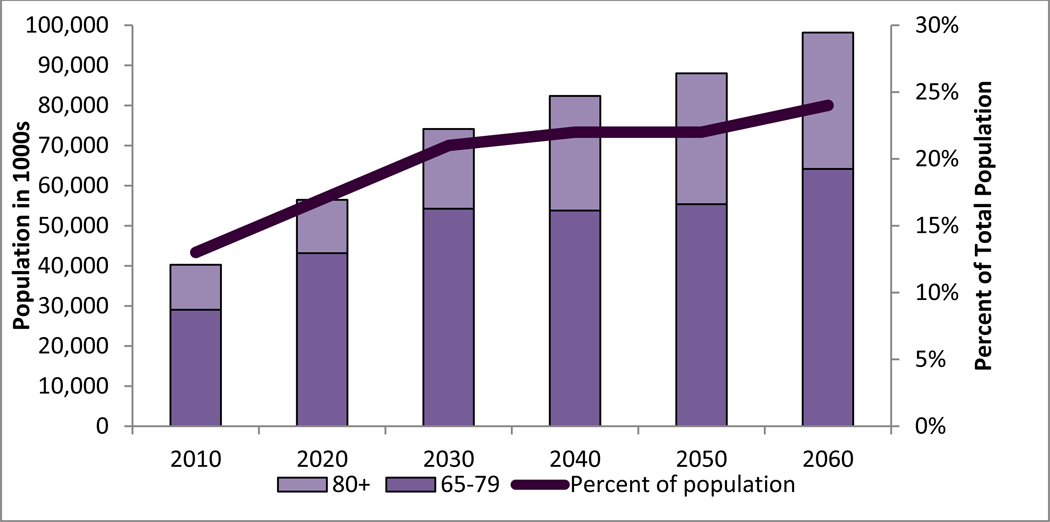
As we look to the future, the population of older people (age 65+) will begin to rapidly increase (Figure B1). Based on our population projection, we expect that between 2010 and 2060 the share of people in this age group will jump from 13 percent of the population to over 23 percent. In raw numbers, the aging population will double from just over 40 million people to over 98 million. Most notably, the share of the oldest older population, those over 80 years old, will greatly increase. While in 2010 the 80+ population was 11 million people, by 2060 it is projected that there will be almost 40 million of them.
5.2. The young population
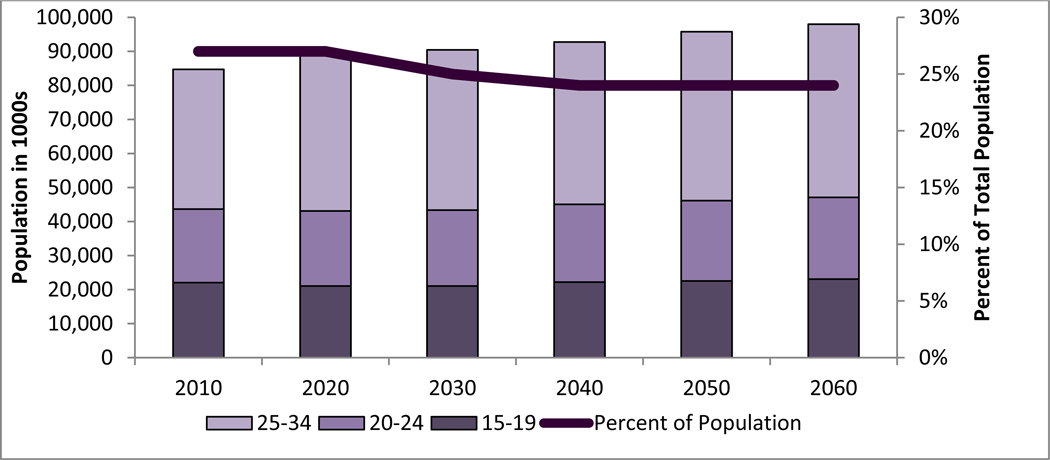
Interestingly, fewer young people are obtaining their driver’s licenses than in previous generations. While 77 percent of 18-year-olds in 1990 had a driver’s license, a study in 2013 found that only 54 percent of 18-year-olds did (Tefft et al. 2013; RTI 1991). The population of young people, those between ages 15 and 34, will remain fairly stable over time (Figure B2). While the number of young people is expected to increase from 84 million people in 2010 to almost 98 million in 2060, the share of young people in the overall population will decrease from 27 percent to 23 percent. The shares of young people by different age categories, such as 15–19, 20–24, and 25–34, are expected to remain fairly consistent across decades.
5.3. Baby Boomers and Millennials
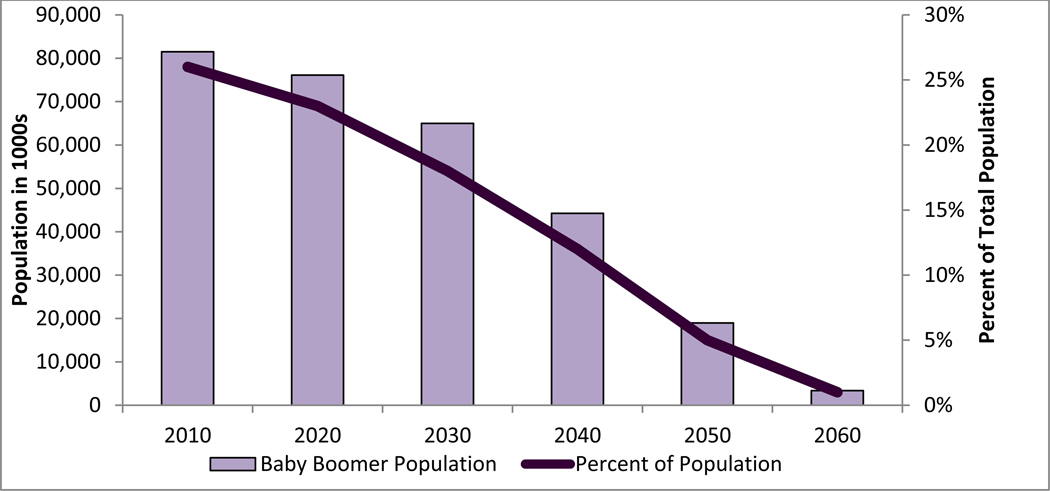
Baby boomers, the cohort of babies born after World War II, is a generation of adults now entering retirement age. For this analysis we examine “boomers” as those born between 1946 and 1964 (Zmud et al. 2014). Unlike previous cohorts, many baby boomers are choosing to retire in the same place where they lived during their working years and do not plan to give up their driving habits (Alsnih and Heshner 2011). In 2010, the 81 million boomers make up 26 percent of the population (Figure B3). In the coming decades, as they age and eventually die, the population of boomers is expected to decrease, as will the boomer share of the population. By 2060, all boomers are expected to be over 95 years old and will make up less than 1 percent of the total population.
Millennials, the generation of younger adults born in the 1980s and 1990s (Zmud et al. 2014), may weigh the benefits of cost, convenience, and the environment when making driving decisions. Millennials are more likely to want to live in cities and to use public transportation for their commutes than older adults (BRS 2013; Zmud et al. 2014). Millennials may demand less from the IHS due to their mix of different modes of transportation, their urban living, and their environmental concerns (Sakaria and Stehfest 2016). Cost is the primary driver behind millennial transportation choices.
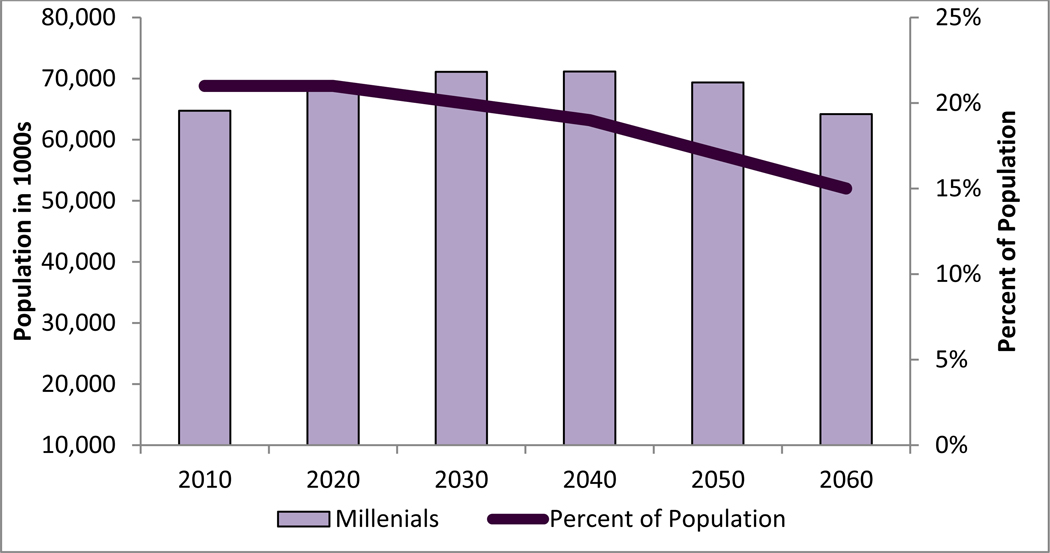
We also identify the millennial cohort as those born between 1982 and 1996 (Pew Research Center 2013). Millennials in 2010 made up almost 21 percent of the total population, when they were between the ages of 15–29. While the number of millennials remains fairly stable over time, the share of the population occupied by millennials is expected to decrease over time. By 2060, when millennials are between the ages of 65 and 79, they are expected to make up 15 percent of the total population (Figure B4).
5.4. Immigrants
About 12.6 percent of the US population is foreign born (Chatman and Klein 2009). Overall, it appears that immigrants are less likely than native-born Americans to drive in private cars and are more likely to use forms of public transportation available in cities (Zmud et al. 2014; Chatman and Klein 2009). Even when traveling between cities, private shared transportation such as Greyhound buses, are used by immigrants at higher rates (Chatman and Klein 2009). It is possible that with the emergence of new immigrant destinations in smaller cities and rural communities, immigrant use of private cars for transportation and use of IHS for both daily and long-distance trips may increase.
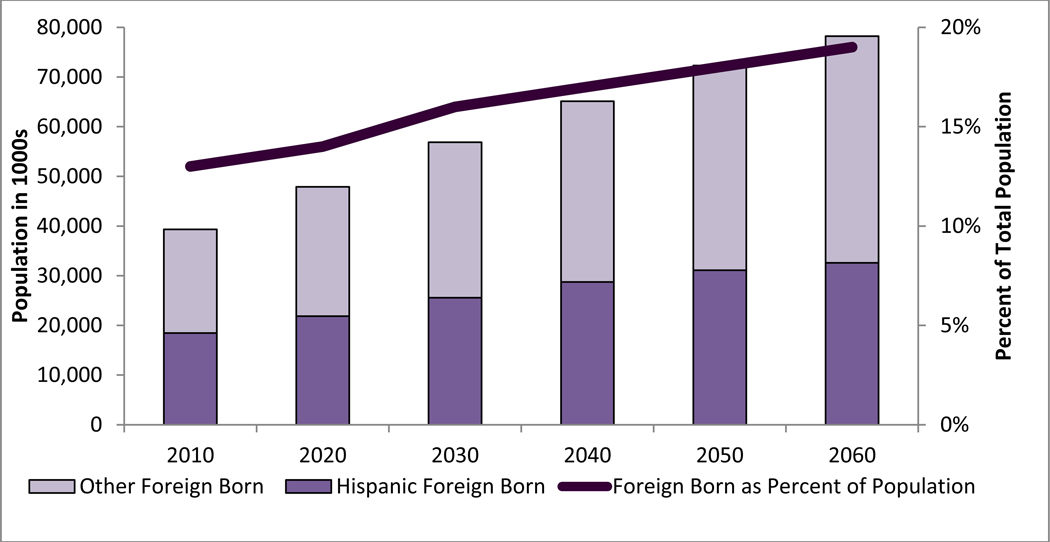
The population of those born outside the United States is projected to increase steadily between 2010 and 2060 (Figure B5). Additionally, the percentage of the population comprised of those born outside the country is projected to increase from 13 to 19 percent. Among the foreign-born population, Hispanics make up the largest racial/ethnic category. In 2010, almost half the foreign-born population was Hispanic. However, the portion of the foreign-born population comprised of people who are not Hispanic is projected to increase over time.
5.5. Telecommuting
Adults, young and old, are now more connected to technology than ever. Telecommuting is the act of doing work at home. Jobs that formally incorporate telecommuting may allow employees to work from home one day a week or may allow workers to complete all work remotely. While some believed that technology might decrease the need for travel, particularly reducing work commutes through the development of telecommuting technology, the impact has been mixed (Zmud et al. 2014). Issues of broadband access may still necessitate in-person working. However, expansion of new forms of technology may change the needs for interstate and highway transportation in the future for both the commutes of people and the delivery of goods.
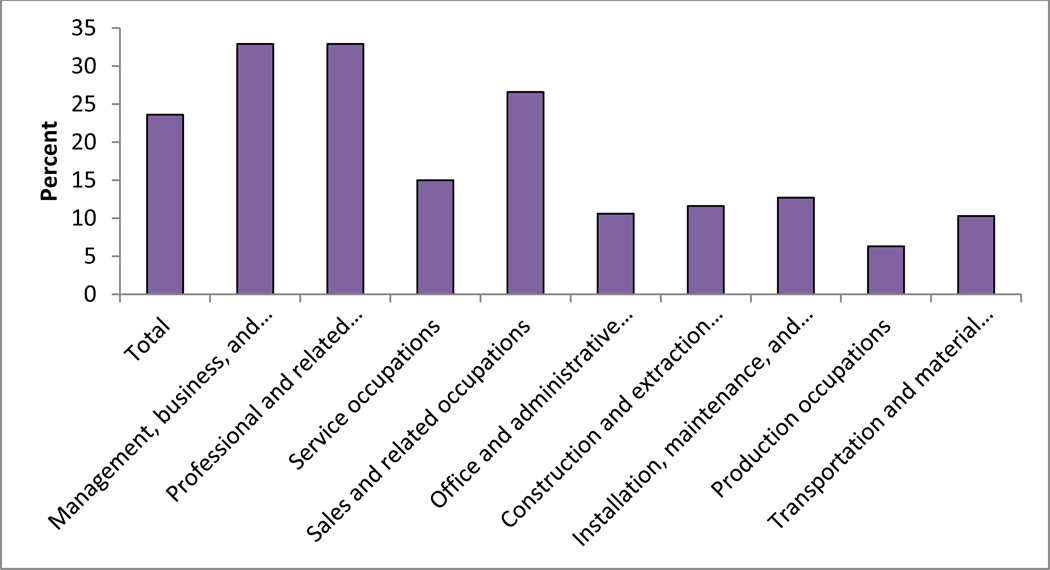
In 2010, management, business, financial, professional, and related occupations had the largest percentage of their workforce engaging in some amount of telecommuting, with almost 33 percent (Figure B6). Unsurprisingly, those who worked in production occupations had the smallest portion of their workforce working from home, and other occupations that require hands-on or face-to-face service also had small portions of their workforces engaging in remote work. Certain occupations may be able to greatly increase their telecommuting workforce in the future, other occupations will not.
5.6. Autonomous vehicles
Changes to automobile technology have increased efforts towards the creation of autonomous vehicles. Predictions of the effect of autonomous vehicles are mixed. Some voice concerns about reliability, safety, and increased congestion from zero-occupant vehicles. Others hail the increased mobility for the elderly or impaired, and the potential for commutes to more rural locations (Kyriakidis et al 2015). Several recent studies have suggested that autonomous vehicle technology could potentially alter people’s travel behaviors (e.g., Zmud and Sener 2016; Becker and Axhausen 2017). For example, if autonomous vehicle can serve as a means to alleviate elders’ barriers to drive, it is expected that highway travel demand would increase, putting additional challenges to the existing highway infrastructure. While the impacts may not be seen for many decades, the magnitude and timing of this change towards driverless cars may affect IHS systems of the future.
6. Conclusions
Demographic forecasting is a precursor to rational transportation planning and decision activities. This paper provides population projections into 2060 at the county level for the entire US using cohort-component methods. The US is projected to experience population growth across all age groups over the next 50 years. The projected growth, however, varies across the entire US. Population growth areas seem to be concentrated in the border states of the west, south, and east, as well as the triangle between Atlanta, GA, the Triangle of North Carolina, and Nashville, TN. Population decline areas include many counties from the northeast corner to the Appalachian region, counties bordering the five Big Lakes except Lake Michigan, counties along the Mississippi River, the Deep South states, and Alaska.
This paper also identifies the counties that may need additional or less IHS capacity based on the projected population change and proximities to IHS by using spatial overlay methods and proximity analysis. Only the counties that fall within 20 miles of existing IHS are included in the analysis. The areas that may need additional IHS capacity, based on their population projections, are particularly strong in counties along I-5 from Washington to San Diego, CA; counties from Los Angeles, CA, to Phoenix, AZ, along I-10; counties from Los Angeles, CA, to Albuquerque, NM, along I-40; counties from Los Angeles, CA, to Utah along I-15; counties along I-20, I-35, and I-45 spreading from Dallas, TX; counties along I-20 from San Antonio, TX, to Pensacola, FL; the lower Florida counties; counties in the big triangle of Atlanta, GA, the Triangle of North Carolina, and Nashville, TN; counties along I-95 from Washington, D.C., to Boston, MA; and counties from Minneapolis, MN, to Detroit, MI, along I-90 and I-94. The counties that may need less IHS capacity based off of their population projections include those from Cleveland, OH, to Boston, MA, along I-90; those from Rockford, IL, to Memphis, TN, along I-39 and I-55; and those along I-25 in New Mexico.
This paper also identifies the counties with high population density but without the IHS network that are predicted to experience rapid population growth because these counties could still have a potential to be invested with a new IHS network (or segments). These counties scatter from the northwest corner of Washington to the west of Colorado; from the southeast corner of New Mexico to Houston, TX; the tristate counties of Montana and Dakotas; northwest of ND; and Hawaii.
It should be noted that the IHS demands also vary by demographic groups. The US population is aging quickly and the percentage of the aging population is rising, from 13 percent of the total population in 2010 to 23 percent in 2060. Both the baby boomers and the millennials will have a declining share of the total population. Immigrants are projected to increase from about 13 percent in 2010 to 20 percent in 2060. Telecommuting and autonomous vehicles could affect the usage of the IHS as well. Also, it should be emphasized that population is only one factor associated with VMT and IHS demands. VMT is also related to employment growth, GDP, and GDP per capita. These factors should be considered when predicting future IHS demands.
That said, future work could provide population projections for these specific demographic groups and for finer geographic scales. For example, population projections by age and projections of immigrants at the county level could provide useful information for the local decision makers. Population projection at subcounty levels could be particularly useful for metropolitan areas, where the IHS needs could vary greatly. For example, the IHS is seen as a disamenity to immediate neighborhoods but as an amenity (because of accessibility) to neighborhoods just a few blocks away. Producing rigorous population projections by different demographic groups and at finer scales could provide more useful information for decision makers and policy makers in better deciding where to expand or invest in the IHS.
Appendices
Appendix A. The cohort-component projection method
The cohort component projection method requires the population size of males and females to be projected separately, since males and females have different age-specific survival rates and birth rates. In what follows we outline the projection of female population. The projection of male population can be projected in the same manner. The only difference is to use the male life table and the ratio of male to female birth when projecting male population.
Following the notations of Preston et al. (2000), the projection of an open population (considering migration) can be expressed as:
where and denote the number of females aged x to x+10 at the beginning and the end of the ten-year projection interval. is the net flow of migrants during the projection period for the age interval x to x+10. In the actual projection procedure,half of the migration increment are added at the beginning of the interval, and survive forward from age x to x+t; the other half of the increment are added at the end of the interval. is the proportion of the female aged x−10 to x that will be alive 10 years later in a stationary population. Considering newborns need to be added to the population, the equation for the first age group (0–10) then becomes
where is the total number of female births. It is obtained through summing births across age groups of the mothers.
Figure B1.
Projected Aging Population (Age 65+) in the US, 2010–2060
Figure B2.
Projected Young Population (Ages 15–34) in the US, 2010–2060
Figure B3.
Projected Population of Baby Boomers (Born 1945–1964) in the US, 2010–2060
Figure B4.
Projected Population of Millennials (Born 1982–1996) in the US, 2010–2060
Figure B5.
Projected Population of Immigrants in the US, 2010–2060
Figure B6.
Percentage of Workers Doing Some or All of their Work from Home in the US, 2010 (BLS 2015)
Footnotes
Highway improvement, highway investment, and highway construction are used interchangeably in this paper.
Contributor Information
Guangqing Chi, Department of Agricultural Economics, Sociology, and Education, Population Research Institute, and Social Science Research Institute, The Pennsylvania State University, 112E Armsby, University Park, PA 16802, USA.
Donghui Wang, Institute for International and Regional Studies, Paul and Marcia Wythes Center on Contemporary China, Princeton University, 359 Wallace Hall, Princeton, NJ 08544, USA.
Annelise DeJong Hagedorn, Blue Ridge Community College, 180 West Campus Drive, Flat Rock, NC 28731-4728, USA.
References
- Alsnih R. and Hensher DA 2003. “The mobility and accessibility expectations of seniors in an aging population.” Transportation Research Part a-Policy and Practice 37(10):903–916. [Google Scholar]
- Aschauer DA 1990. “Highway Capacity and Economic Growth.” Economic Perspectives 14(5):14–24. [Google Scholar]
- Baum-Snow N. 2007. “Did Highways Cause Suburbanization?” The Quarterly Journal of Economics 122(2):775–805. [Google Scholar]
- Becker F. and Axhausen KW, 2017. “Literature Review On Surveys Investigating The Acceptance Of Automated Vehicles.” Transportation 44(6):1293–1306. [Google Scholar]
- B.R.S. 2013. “Americans’ Views on Their Communities, Housing, and Transportation: Analysis of a National Survey of 1,202 Adults” Washington, DC: Urban Land Institute. [Google Scholar]
- Bureau of Labor Statistics, US Department of Labor, The Economics Daily, 24 percent of employed people did some or all of their work at home in 2015 on the Internet. https://www.bls.gov/opub/ted/2016/24-percent-of-employed-people-did-some-or-all-of-their-work-at-home-in-2015.htm (Visited October 09, 2017)
- Chatman DG and Klein N. 2009. “Immigrants and Travel Demand in the United States: Implications for Transportation Policy and Future Research.” Public Works Management & Policy 13(4):312–327. [Google Scholar]
- Chi G. 2009. “Can Knowledge Improve Population Forecasts at Subcounty Levels?” Demography 46(2):405–427. [DOI] [PMC free article] [PubMed] [Google Scholar]
- Chi G, Cosby AG, Quddus MA, Gilbert PA, and Levinson D. 2010. “Gasoline Prices and Traffic Safety in Mississippi.” Journal of Safety Research 41(6): 493–500. [DOI] [PubMed] [Google Scholar]
- Collia DV, Sharp J, and Giesbrecht L. 2003. “The 2001 national household travel survey: A look into the travel patterns of older Americans.” Journal of Safety Research 34(4):461–470. [DOI] [PubMed] [Google Scholar]
- Federal Highway Administration. 2017. “Highway Statistics 2017 Report.” https://www.fhwa.dot.gov/policyinformation/statistics/2017/ Accessed on January 10, 2019
- Fixing America’s Surface Transportation Act of 2015. Pub L. No. 114–94.
- Garrison WL, Berry BJL, Marble DF, Nystuen JD, and Morrill RL 1959. Studies of Highway Development and Geographic Change. Seattle, WA: University of Washington Press. [Google Scholar]
- Giuliano G, and Dargay J. 2006. ”Car Ownership, Travel and Land Use: The US and Great Britain. “ Transportation Research Part A 40: 106–124. [Google Scholar]
- Hobbs DJ and Campbell RR 1967. “Traffic Flow and Population Change.” Business and Government Review 8(3):5–11. [Google Scholar]
- Kyriakidis M, Happee R, and JCF de Winter. 2015. “Public Opinion on Automated Driving: Results of an International Questionnaire Among 5000 Respondents.” Transportation Research Part F 32: 127–140. [Google Scholar]
- Lichter DT and Fuguitt GV 1980. “Demographic Response to Transportation Innovation: The Case of the Interstate Highway.” Social Forces 59(2):492–512. [Google Scholar]
- Mikelbank BA 1996. “The Distribution and Direct Employment Impacts of Public Infrastructure Investment in Ohio.” Presented at the 27th Annual Midcontinent Regional Science Association Meeting, June 7, 1996, Madison, WI. [Google Scholar]
- Moore T, & Thorsnes P. 1994. The transportation/land use connection. Washington, DC: The American Planning Association. [Google Scholar]
- Mulder TJ 2002. “Accuracy of the US Census Bureau National Population Projections and Their Respective Components of Change.” Working Paper Series No. 50, US Census Bureau, Population Division. https://www.census.gov/population/www/documentation/twps0050/twps0050.html#C1
- Pew Research Center. 2013. “Adult Gadget Ownership over Time.” Washington, DC. [Google Scholar]
- Preston S, Heuveline P, and Guillot M. 2000. Demography: Measuring and Modeling Population Processes. Malden, MA: Blackwell Publishers. [Google Scholar]
- Research Triangle Institute. 1991. “1990 Nationwide Personal Transportation Survey, User’s Guide for the Public Use Tapes.” Washington, DC: US Department of Transportation, Federal Highway Administration. [Google Scholar]
- Sakaria N. and Stehfest N. 2016. “Millennials and Mobility: Understanding the Millennial Mindset and New Opportunities for Transit Providers.” National Academies Press. [Google Scholar]
- Sivak M. 2013. “Part 2: Use of Light-Duty Vehicles.” Ann Arbor, MI: Transportation Research Institute, University of Michigan. [Google Scholar]
- Sivak M. and Schoettle B. 2011. “Recent Changes in the Age Composition of US Drivers: Implications for the Extent, Safety, and Environmental Consequences of Personal Transportation.” Traffic Injury Prevention 12(6):588–592. [DOI] [PubMed] [Google Scholar]
- Skinner RE 2002. “Highway Research for the 21st Century.” Issues in Science and Technology 19(2):31–35. [Google Scholar]
- Smith SK, Tayman J, and Swanson DA 2013. A Practitioner’s Guide to State and Local Population Projections. New York: Springer. [Google Scholar]
- Stokes G. 2012. “Has Car Use per Person Peaked? Age, Gender, and Car Use” Oxford, UK: Transport Studies Unit, School of Geography and the Environment, University of Oxford. [Google Scholar]
- Tefft BC, Williams AF, and Grabowski JG 2013. “Timing of Driver’s License Acquisition and Reasons for Delay among Young People in the United States, 2012.” Washington, DC: AAA Foundation for Traffic Safety. [Google Scholar]
- Transportation Research Board (TRB). 2017. Future Interstate Study. National Academies of Science, Engineering, Medicine. Retrieved from http://www.trb.org/FutureInterstate/FutureInterstateStudy.aspx
- US Department of Transportation, Federal Highway Administration, and Wisconsin Department of Transportation 1998. “United States Highway 12: Final Environmental Impact Statement.” Madison, WI: Federal Highway Administration. [Google Scholar]
- US Department of Transportation. 1970. “Stewardship Report: On Administration of the Federal-Aid Highway Program, 1956–1970.” Washington, DC: Federal Highway Administration. [Google Scholar]
- Vandenbroucke G. 2008. “The US Westward Expansion.” International Economic Review 49(1):81–110. [Google Scholar]
- Voss PR and Chi G. 2006. “Highways and Population Change.” Rural Sociology 71(1):33–58. [Google Scholar]
- Voss PR, Kale BD. 1986. Wisconsin Small-Area Baseline Population Projections. Working report. Applied Population Laboratory, and Demographic Services Center: Madison, WI. [Google Scholar]
- Wilson T. and Rees P. 2005. “Recent Developments in Population Projection Methodology: A Review.” Population, Space and Place 11:337–360. [Google Scholar]
- Wisconsin Department of Administration. 2004. Methodology for Developing Minor Civil Division Projections. Available at http://www.doa.state.wi.us/docview.asp?docid=1688.
- Wisconsin Department of Transportation. 1983. “Six Year Highway Improvement Program.” http://www.dot.state.wi.us/projects/state/sixyear/major.htm.
- Wisconsin Department of Transportation. 2003. “Life of a Highway Project.” http://www.dot.state.wi.us/projects/life/index.htm.
- Zmud JP, Barabba VP, Bradley M, Kuzmyak JR, Zmud M, and Orrell D. 2014. “Strategic Issues Facing Transportation, Volume 6: The Effects of Socio-Demographics on Future Travel Demand.” National Academy of Sciences. [Google Scholar]
- Zmud JP and Sener IN 2017. “Towards an understanding of the travel behavior impact of autonomous vehicles.” Transportation Research Procedia, 25, 2500–2519. [Google Scholar]


