

Abstract
Background:
E2F1 protein, a major effector of the Rb/E2F pathway plays a central role in regulating cell-fate decisions involved in proliferation, apoptosis, and differentiation. Its expression is highly dynamic and tightly modulated through a combination of transcriptional, translational and posttranslational controls. However, the mechanisms by which its expression and activity can promote different cellular outcomes remain to be fully elucidated. To better document E2F1 expression in live cells, we have engineered a series of fluorescent E2F1 protein reporters that quantitatively capture E2F1 protein dynamics.
Methods:
Reporter constructs, under the control of the mouse or human E2F1 proximal promoter, were designed to express an E2F1-Venus fusion protein incapable of binding DNA. In addition, constructs either included or excluded the 3′ untranslated region (3′UTR) of the E2F1 gene. These constructs were introduced into fibroblasts and epithelial cells, and expression of the fusion reporter protein was validated and quantified in single cells using live imaging.
Results:
In all cases, expression of the reporter protein effectively recapitulated the behavior of E2F1 under various conditions, including cell cycle progression and genotoxic stress. No or little fluorescent signal of the reporter was detected in G0, but as the cycle progressed, expression of the reporter protein steadily increased in the nucleus, peaking a few hours before cell division, but declining to baseline 2–3 h prior to the onset of mitosis. The absence of the E2F1 3′UTR in the constructs led to considerably higher steady-state levels of the fusion protein, which although normally regulated, exhibited a slightly less complex dynamic profile during the cell cycle or genotoxic stress. Lastly, the presence or absence of Rb failed to impact the overall detection and levels of the reporter proteins.
Conclusions:
Our validated E2F1 protein reporters complement nicely other reporters of the Rb/E2F pathway and provide a unique tool to follow the complex dynamics of E2F1 expression in real time in single cells.
Keywords: protein, E2F1 reporter, cell cycle
Author summary:
Cell proliferation in response to growth signals is regulated through the action of the Rb/E2F circuit, which includes the E2F1 protein as one of its effectors. E2F1 expression is highly dynamic and changes in E2F1 protein can promote different decisions based on a complex balance with other effectors. To document how E2F1 levels change in single cells under different experimental conditions, we have engineered fluorescent protein reporters that serve as proxies for endogenous E2F1expression. Here we report the design of these reporters and show by live imaging and quantitative analysis in single cells that they faithfully recapitulate E2F1 behavior.
INTRODUCTION
E2Fs are a family of transcription factors that orchestrate the traverse of the G1/S and G2/M phases of the cell cycle by regulating the expression of critical genes promoting proper cell cycle progression [1–3]. This family of transcription factors has been subdivided into both activators (E2F1-E2F3a) and repressors (E2F3b, E2F4-E2F8) [4]. Rb, a member of the pocket protein family negatively regulates the function of E2F activators by directly binding to them in a cell cycle-dependent manner [5]. Its inhibition is specifically relieved during the G1 phase through hyper-phosphorylation by G1 cyclins/CDK complexes [5,6]. Loss of Rb or deregulation of targets of E2F transcription factors have been associated with numerous human malignancies, highlighting the importance of this pathway in cell cycle regulation and disease [7].
To better understand how the dynamics of activation of the Rb/E2F pathway correlate with quiescence and proliferation of cells exposed to growth stimuli, we had developed two reporters that captured the transcriptional activation of the E2F1 gene and free E2F activity respectively. The two reporters displayed very similar dynamic profile in cells that had been released into the cell cycle after addition of serum, with the exception of a slight delay in the activation of the E2F activity reporter compared to the transcriptional reporter [8,9]. However, E2Fs are further regulated at the post-translational level, resulting in dynamically regulated amounts of proteins during the cell cycle. Although this aspect had to be partly reflected in the behavior of the two reporters, they could not provide in real time a direct picture of the dynamic changes in E2F1 protein per se in single cells. As the overall balance of E2F repressors to activators can affect cellular outcomes (e.g., proliferation, differentiation, senescence, or apoptosis [10–12]), there was a need to complement our existing reporters with a third reporter construct which would serve as a proxy for the expression of the E2F1 protein under various conditions.
RESUTLTS
Design rationale of the E2F1 protein reporter constructs
Building on our experience with our two previous reporters (Fig. 1A), we defined a set of criteria for the E2F1 protein reporter: (1) it should be subject to the same transcriptional regulation as the endogenous E2F1 gene, as was the case for our earlier reporters [8,9]; (2) the influence of the E2F1 3′UTR on the expression of the reporter protein should be evaluated, as this region is targeted by miRNAs shown to regulate the levels of E2F1 protein [13,14]; (3) ectopic expression of the reporter protein should not perturb the overall E2F activity in a cell to avoid altering the balance between EF2 activators and repressors that dictate different cell fate decisions [12,15,16] and (4) the reporter protein should be fluorescent for the purpose of live detection and contain all E2F1 residues known to be subject to post-translational modification, to maximize our ability to capture the dynamic expression of E2F1 under different experimental conditions [16].
Figure 1. E2F1 protein reporter constructs.
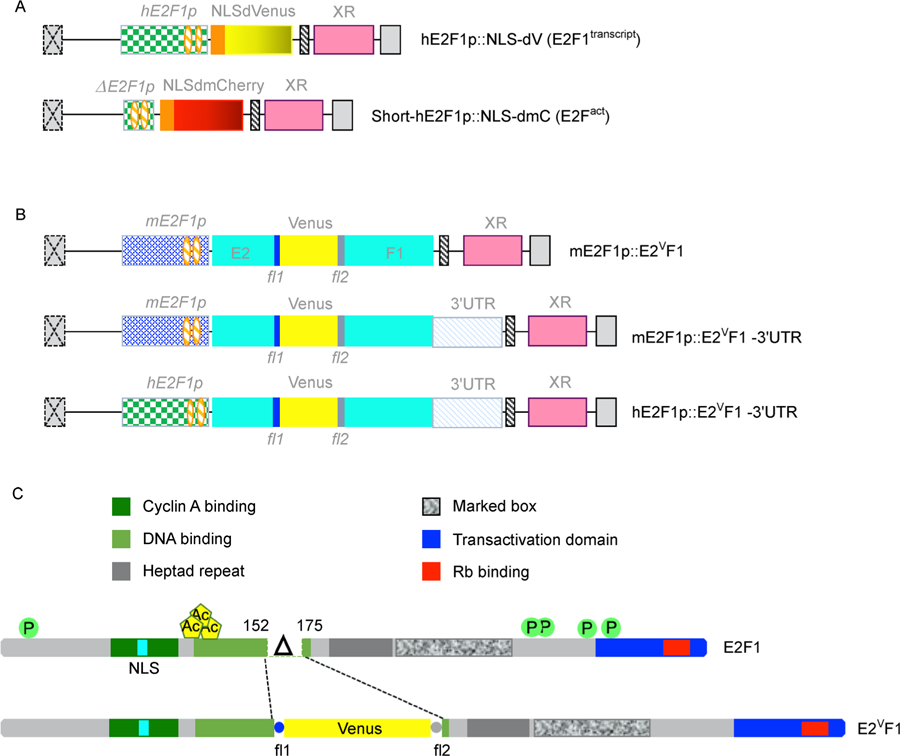
(A) Schematics of the E2F1 transcriptional and E2F activity reporters previously published [8,9]. hE2F1p: human E2F1 promoter; E2F1p: short human E2F1 promoter; NLS: SV40 nuclear localization domain; dVenus: destabilized Venus; dmCherry: destabilized monomeric Cherry; XR: drug resistance gene (puromycin or neomycin); orange hatched ovals: E2F consensus binding sites. (B) Schematic of E2F1 protein reporters generated in the pQCXIP (or pQCXIN) expression construct (Takara Bio/Clontech). mE2F1p and hE2F1p: E2F1 mouse and human promoter, respectively [8]; E2: sequence encoding a.a. 1–152 of hE2F1; Venus: sequence coding for the Venus fluorescent protein; F1: sequence encoding a.a. 175–437 of hE2F1; 3′UTR: 3′ untranslated region of hE2F1 gene. (C) Schematics of human E2F1 and E2VF1 proteins. Main functional domains are highlighted. P: phosphorylation sites; Ac: acetylation sites; NLS: nuclear localization domain; Δ: amino acids 153–174 deletion corresponding to leucine zipper in DNA binding domain (LNWAAEVLKVQKRRIYDITNVL); fl1: flexible linker 1; fl2: flexible linker 2.
To satisfy these criteria, we decided to use the previously validated mouse or human E2F1 promoter [8,9] and include or omit the E2F1 3′UTR region in our constructs (Fig. 1B). In addition, the E2F1 protein reporter constructs were designed to encode a fusion protein (E2VF1) of 686 amino acids (a.a.) (Fig. 1C), consisting of the N-terminal region of human E2F1 (a.a. 1–152) fused to the fluorescent protein Venus flanked at either end with a flexible peptide linker, and followed by the rest of the E2F1 C-terminal region (a.a. 175–437). In the process, a small region of E2F1 corresponding to the winged-helix DNA binding domain was deleted (a.a. 152–174). This deletion prevents the E2VF1 protein to be transcriptionally active as it removes an essential residue shown to make contact with DNA, resulting in its inability to bind DNA [17]). Other than the deleted residues, which have not been described to be targeted by post-translational modifications, E2VF1 retains all E2F1 residues reported targeted for post-translational regulation during the cell cycle or in response to stress conditions (Fig. 1C) [18].
Expression of the E2VF1 fusion protein
Viral stocks corresponding to our constructs were used to infect rat and human fibroblasts (Fig. 2A and 2B, respectively) or human mammary epithelial cells (Fig. 2C). After selection in puromycin, polyclonal populations were either used directly or subjected to limiting dilution to isolate single cell clones. In all cases, expression of the reporter protein was detected in the form of two bands, which were absent in uninfected cells (Fig. 2). The top band corresponds to the expected size of the fusion protein (686 a.a., ~73 kDa). As the observed difference in migration (~19 kDa) is too large to be caused by post-translational modifications, the lower band likely represents a truncation product of the mature form. However, we cannot rule out that it corresponds to the translation product of E2VF1 at an internal start site, perhaps at the initiating methionine codon of Venus which, together with the surrounding nucleotides, conforms to a strong Kozak consensus sequence [19]. The steady-state levels of E2VF1 expression appear to be higher than that of endogenous E2F1 in all cell types tested (Supplementary Fig. S1A). Furthermore, there was a 4–8 fold increase in the steady-state amount of E2VF1 protein in REF52E2VF1 clone 8 cells compared to the levels observed in REF52 clones transduced with the same construct but containing the E2F1 3′UTR (Fig. 2A, lane d vs. lane b or c). This increase was not unique to clone 8 cells but was also observed in the REF52 parental polyclonal population of cells transduced with the E2VF1 construct and other single cell clones isolated from that population (data not shown). In contrast, all cells transduced with versions of the E2VF1–3′UTR construct expressed the fusion protein at similar or lower levels to that detected in REF52E2VF1–3′UTR clone B or D cells (Fig. 2B and Supplementary Fig. S1). As such, the presence or absence of the 3′UTR in our protein reporter constructs appears to influence the amount of the fusion protein expressed in cells (Fig. 2).
Figure 2. Characterization of the E2VF1 fusion protein.
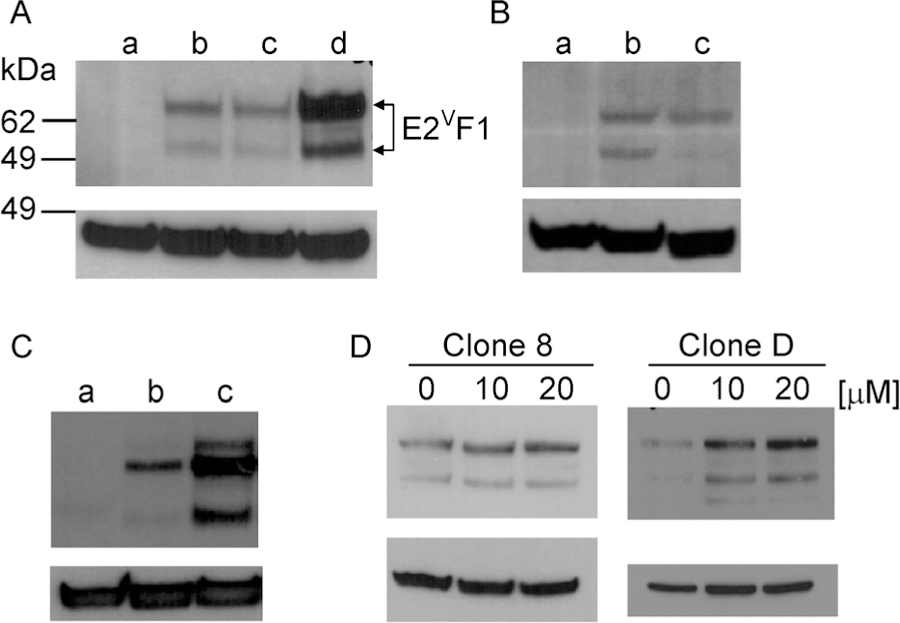
(A–D) Cell extracts were prepared from cells grown under normal or experimental conditions (as indicated) and used for detection of E2VF1 protein. Top panel: α -E2F1 antibody. Bottom panel: β –actin antibody. (A) a: REF52 (uninfected); b: REF52E2VF1–3′UTR (clone B); c: REF52E2VF1–3′UTR (clone D); d: REF52E2VF1 (clone 8). (B) a: Wi-38 (uninfected); b: WI-38E2VF1–3′UTR (polyclonal); c: REF52E2VF1–3′UTR (clone D). (C) a: HMEE2Fact (clone 1) cells grown in full medium. b: HMEE2Fact Rb+, E2VF1–3′UTR (clone R15) cells were incubated sequentially in starvation medium #1 and #2 for a total of 48 h (see Material and Methods). c: HMEE2Fact Rb+, E2VF1–3′UTR (clone R15), starved for 48 h and grown again with full medium for 24 h (Top panel: α -E2F1 antibody. Bottom panel: β-actin antibody). (D) Extracts from REF52E2VF1 (clone 8) or REF52E2VF1–3′UTR (clone D) grown in the absence or in the presence of increasing amount of cisplatin [μM]. Fold increase in E2vF1 protein levels was determined after normalization against β-actin levels.
To further validate our E2F1 protein reporter, we tested whether expression of E2VF1 protein responded in a similar fashion to various experimental conditions known to affect the steady-state level of the endogenous E2F1 protein. It is well established that expression levels of E2F1 protein and mRNA dramatically decrease in response to serum starvation [20]. Cultures of HMEE2Fact Rb+, E2VF1–3′UTR (clone R15) cells were grown in minimal medium lacking growth supplement additives (see Material and Methods). Cells were either lysed after 48 h or released back into the cell cycle by adding fresh full medium for 24 h. Cell extracts from both conditions were analyzed for the expression of E2VF1. We observed very little expression of E2VF1 protein in cells arrested in G0, whereas cultures released into the cell cycle for about 24 h expressed similar amounts of the fusion protein as compared to cultures grown continuously in full medium (Fig. 2C). As genotoxic stress results in E2F1 protein stabilization [21], we tested the effect of cisplatin on E2VF1 protein expression. Cell extracts from REF52E2VF1 (clone 8) and REF52E2VF1–3′UTR (clone D) cells treated with cisplatin contained increased amount of E2VF1 in a dose-dependent manner compared to control treated cells (Fig. 2D). The effect after treatment with 10 or 20 µM cisplatin was more prominent in clone D cells (a 3.6- and 5.9-fold-increase respectively) compared to that observed in clone 8 cells (a 1.6- and 2-fold increase). This difference is likely due to the fact that clone D cells express a lower basal level of E2VF1(Fig. 2A, lane c) under normal conditions.
Having established that the fusion protein E2VF1 recapitulated the behavior of endogenous E2F1 protein under different experimental conditions, we next characterized its localization. All cells transduced with the reporter protein constructs exhibited detectable fluorescent signals (Fig. 3). A stronger signal was observed in cells transduced with the construct lacking the 3′UTR (Supplementary Fig. S2), consistent with the higher steady-state amounts of E2VF1 associated with this construct (Fig. 2A). As is the case for E2F1 [22–24], localization of the fluorescent signal corresponding to E2VF1 is largely restricted to the nucleus (Fig. 3). The cell-to-cell variability in the E2VF1 signal in unsynchronized clone 8 cells reflects the dynamic modulation of protein expression during the cell cycle (Fig. 3A).
Figure 3. Live detection and nuclear localization of E2VF1.
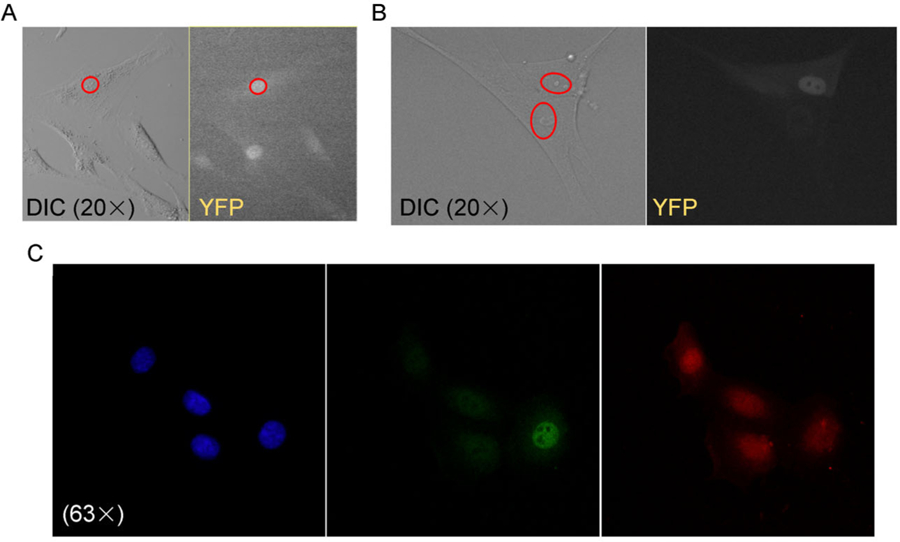
Rat or human fibroblasts were grown in 35 mm Mattek optic plates (A and B) for live imaging, and HME cells were grown on glass coverslips (C) placed in regular 35 mm tissue culture dishes before being fixed and permeabilized for immunofluorescence detection. (A) Live REF52E2VF1 (clone 8) cells imaged under DIC and YFP illumination respectively (Olympus VivaView FL microscope, 20×). Red oval highlights nucleus in top cell in DIC panel. (B) Live WI-38E2VF1–3′UTR (polyclonal) cells imaged as in A. Red ovals highlight nuclei in the two cells shown in DIC panel. (C) Confocal images of fixed HMEE2Fact Rb−, E2VF1–3′UTR (polyclonal) cells, taken in the DAPI, EYFP and mcherry channels respectively (Zeiss 780 inverted confocal microscope, 63×/1.4 NA Oil Plan-Apochromat DIC).
Dynamic expression of E2VF1 after release into the cell cycle
To quantify the temporal dynamics of E2VF1 during cell cycle re-entry, we initially focused on REF52E2VF1 clone 8 cells as they expressed the strongest signal (Fig. 3 and Supplementary Fig. S2). Clone 8 cells were serum starved for 48 h and then released back into the cell cycle after addition of full medium containing 10% serum. Live images were taken every 30 min over 36 h and the signal intensity was quantified for each time point up to the time of the first cell division, and occasionally a bit longer in one of the daughter cells. Although there is significant heterogeneity in E2VF1 fluorescence intensity among different single cells at any given time (Supplementary Fig. S3), it remained low in each cell over a few hours after serum addition before sharply increasing to a maximum and then decreasing to low or background levels shortly before or at the time of mitosis (Fig. 4). The dynamic behavior of the reporter protein observed in single cells agree with population measurements of endogenous E2F1 protein we had previously observed in REF52 cell extracts (see [8] Supplementary Figs. S1B and Fig. S4).
Figure 4. Time course of E2VF1 protein expression in REF52E2VF1 (clone 8) cells.
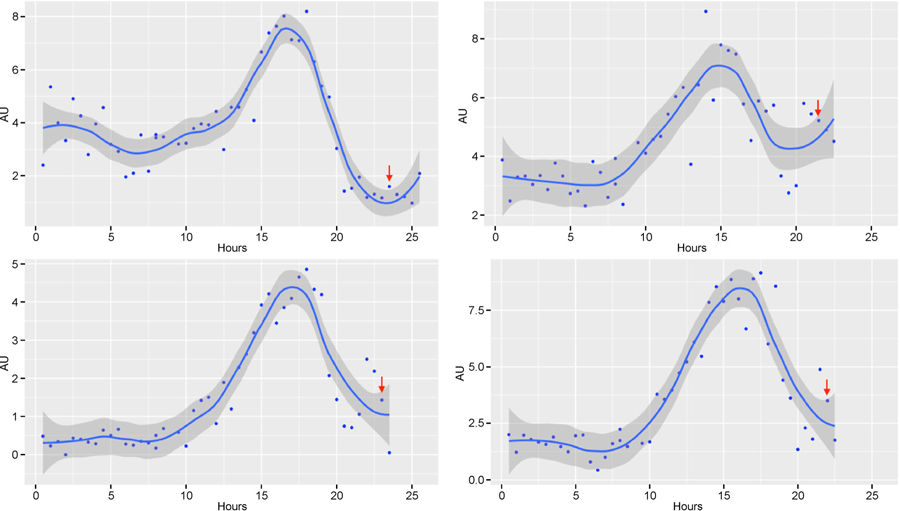
Quiescent REF52E2VF1 (clone 8) cells, starved of serum for 48 h, were released back into the cell cycle after addition of 10% serum. Cells were placed into the Vivaview incubator microscope and once the focus was fully stabilized (about 90 min) (t = 0), images were recorded every 30 min in the DIC and YFP modes (20× objective) for 36 h. E2VF1 fluorescent tracings for 4 representative cells are presented. AU: Arbitrary units of fluorescence. Red arrow: time of mitosis. Blue dots: values for each time point. Solid line: fitted curve (ggplot2: geom_point(), stat_smooth(method =“loess”, span = 0.4). Darker grey area: 95% confidence range for the fitted curve.
As the version of the protein reporter in clone 8 cells lacked the 3′UTR of the E2F1 gene and expressed a higher level of E2VF1 protein (Fig. 2A), it was possible that some aspect(s) of E2F1 protein regulation might not be properly represented with this reporter. In addition, there was the potential that ectopic expression of E2VF1 might alter the balance of complex formation between Rb and E2F1 in a cell and thereby affect our measurements [25,26]. To examine these possibilities, and also calibrate our protein reporter against an E2F activity reporter (E2Fact) that we had recently characterized [9], we took advantage of a human mammary epithelial cell clone (h-Tert HMEE2Fact, clone P1) that we had generated [9]. We obtained an Rb− population of cells after CRISPR-Cas9 editing (HMEE2Fact, Rb−) of the clone, and selected a single cell clone for the rest of our experiments (clone 0). We then introduced the E2VF1–3′UTR reporter construct, driven by the human E2F1 promoter (Fig. 1B) into HMEE2Fact Rb+ (clone P1) or HMEE2Fact Rb− (clone 0) cells and selected single cell clones from the respective transduced populations. To quantify fluorescent signals in live cultures, we chose one representative each from the Rb+ and Rb− clones, namely clone R15 (HMEE2Fact, Rb+, E2VF1–3′UTR) and clone H4 (HMEE2Fact, Rb−, E2VF1–3′ UTR). Both clones expressed comparable amounts of E2VF1 protein to that found in REF52E2VF1–3′UTR clone D cells (Fig. 5 and Supplementary Fig. S1). Live imaging of R15 and H4 cells, which had been starved of growth supplements for 48 h and then switched to full medium was performed over a 40 h period. We plotted the respective fluorescence intensities every 30 minutes (Fig. 6 and Supplementary Fig. S4) as described earlier for REF52 clone 8 cells. In both HME H4 and R15 cells, the E2VF1 signal dynamics followed roughly the same kinetics as that observed in REF52 cells expressing the E2VF1 reporter lacking the 3′UTR (Fig. 4 and Supplementary Fig. S4). However, in several cases, we noticed a slightly more complex dynamic behavior as revealed by a bi-phasic or non-monotonic increase of E2VF1 intensity before reaching its maximum amplitude. Furthermore, the signal returned to basal levels a bit sooner before cell division in cells expressing the reporter containing the 3′UTR, consistent with the idea that miRNAs, specifically induced by the activity of c-myc and E2F1 transcription factors, bind the 3′UTR of the E2F1 gene to help sharpen the reduction of E2F1 protein before cell division [13]. Although there were no drastic differences in the kinetics of E2VF1 expression in HME H4 cells that lacked Rb, the overall intensity of the signal was reduced in these cells compared to single Rb+ R15 cells, despite the fact that unsynchronized and proliferating cells in the two clones express similar steady-state amount of E2VF1 protein as detected by immunoblotting (Fig. 5).
Figure 5. Rb+ and Rb‒ HME cells clones expressing both E2 F activity and protein reporters.
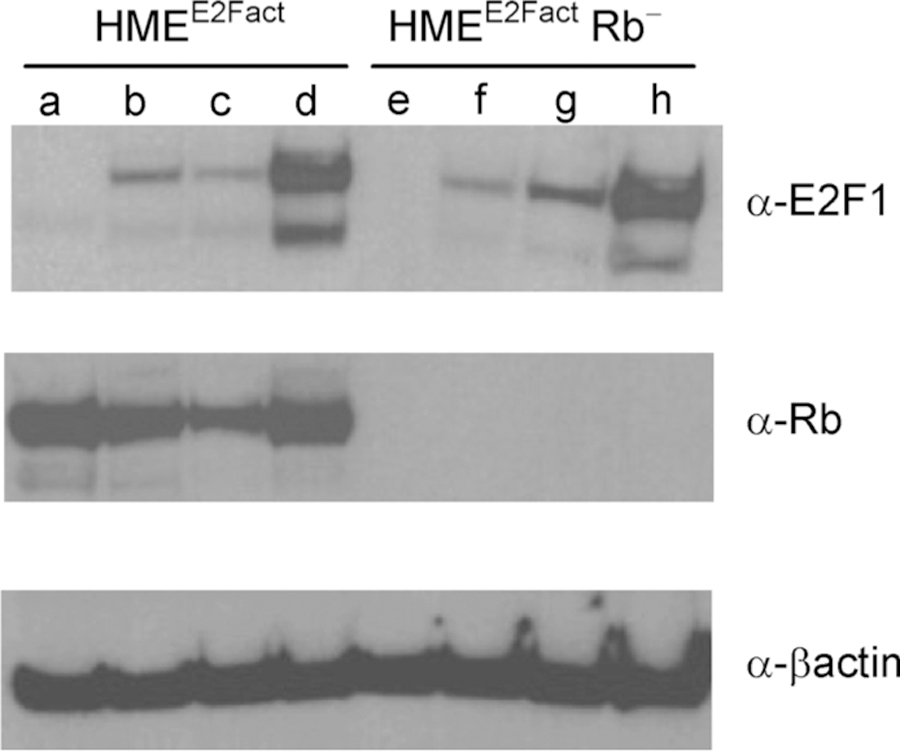
Viral stocks of the E2VF1–3′UTR construct were used to infect a human mammary epithelial cell clone expressing the E2F activity reporter (HMEE2Fact) [9] or a CRISPR-derived subclone harboring an Rb deletion (HMEE2Fact Rb−, clone 0). After selection, single cell clones were derived, and cell extracts were probed for expression of E2VF1, Rb and β-actin respectively. (a) HMEE2Fact Rb+; (b) HMEE2Fact Rb+, E2VF1–3′UTR (polyclonal); (c) HMEE2Fact Rb+, E2VF1–3′UTR (clone R11); (d) HMEE2Fact Rb+, E2VF1–3′ UTR (clone R15); (e) HMEE2Fact Rb− (clone 0); (f) HMEE2Fact Rb−, E2VF1–3′UTR (polyclonal); (g) HMEE2Fact Rb−, E2VF1–3′ UTR (clone H1); (h) HMEE2Fact Rb−, E2VF1–3′UTR (clone H4).
Figure 6. Time course of E2VF1 protein expression in HME cells.
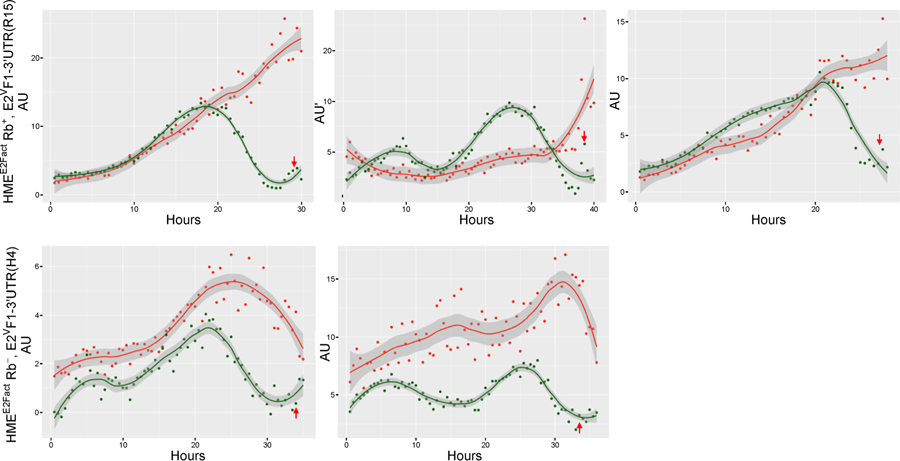
HMEE2Fact Rb+, E2VF1–3′UTR (clone R15) or HMEE2Fact Rb−, E2VF1–3′ UTR (clone H4) cells (top 3 and bottom 2 panels respectively) were driven to quiescence by culturing them in minimum medium for 48 h. Cells were then released back into the cell cycle after addition of full growth medium. Cells were imaged under DIC, RFP and YFP modes every 30 min for 40 h with the Vivaview incubator microscope (20× objective) as described under Fig. 5. Representative time course tracings of E2F activity and E2VF1 protein reporters in singles cells. AU: Arbitrary units of fluorescence. Red arrow: time of mitosis. Solid lines: fitted curves for activity (red dots) and E2VF1 (green dots) reporters (ggplot2: geom_point(), stat_smooth(method =“loess”, span = 0.4). Darker grey area: 95% confidence range for fitted curves.
The overall kinetics of the E2Fact and E2VF1 reporters appear to track well during the cell cycle, although there are some differences. As we had noticed in our previous study [9], a strong signal from the E2Fact reporter can persist in cells at the time of cell division (Fig. 6, and data not shown), although its amplitude eventually decreases in daughter cells before it rises again. In contrast, the E2VF1 signal always returns to basal or low levels before cells undergo mitosis. Interestingly, the protein reporter performs better at that late time point than either the E2F transcriptional or activity reporters, and is in excellent agreement with what we had observed in a time course of endogenous E2F1 protein in REF52 cells released into the cell cycle after starvation (as shown in Supplementary Fig. S1B of [8]). Lastly, there is no strict correlation between the maximum amplitude values observed for the E2Fact and the E2VF1 reporters. This is likely due to the fact that the E2Fact reporter informs on the net activity of all E2F activators in the cell, whereas the E2VF1–3′UTR reporter is specific to E2F1 protein expression.
DISCUSSION
Over the last few years, we have assembled a versatile tool-set of reporters that inform on the kinetics of activation of E2F1 at the level of transcription, functional activity and, in this study, protein expression in live cells. These reporters can be followed in tandem (Venus vs. mCherry), which gives a unique opportunity to uncover more complex rules of regulation that cannot be captured by one reporter alone. So far, we have characterized and validated them in the context of cell proliferation, but they could be equally informative in studying the behavior and role of E2F1 in apoptosis, differentiation, and metabolism [15,27,28].
Our most recent E2F1 reporters, which capture the dynamic expression of E2F1 protein, has proven to be a very good proxy for E2F1 levels in cells. The reporter constructs are under the control of the mouse or human E2F1 proximal promoter [8], and also differ in including or excluding the E2F1 3′UTR. They encode a fluorescent fusion protein (E2VF1) (Fig. 2), consisting of Venus embedded within the coding region of E2F1, which is detected as a doublet, with the top band corresponding to the expected size for the fusion protein. To avoid disrupting the balance between functional E2F activators and repressors in cells that ectopically expressed E2VF1, the winged-helix DNA binding domain of E2F1 was deleted and replaced with Venus. The fact that this domain is equivalent to a region in E2F4 shown to make critical contacts with DNA [17], and that the E2F1 R166H mutation, which resides in the corresponding region of E2F1 abrogate DNA binding by mutant E2F1 [29], strongly suggests that E2VF1 has no DNA binding activity. Although we have not tested DNA binding directly, ectopic expression of E2VF1 from the constructs containing the E2F1 3′-UTR has no discernable effect on normal cell behavior. We failed to see any changes in the rate of proliferation, viability or susceptibility to genotoxic treatment, when we compared parental cells with clones ectopically expressing E2VF1. Furthermore, both wild-type WI-38 cells and a derived population ectopically expressing E2VF1 showed signs of senescence around the same time (passage 32). However, we did note that REF52E2VF1 clone 8 cells, which express a high amount of the fusion were more sensitive to trypsinization and freezing conditions. These cells needed to be on a strict passaging schedule to avoid crisis in recovery or slow growth with signs of senescence after passaging. Whether this behavior is due to a slight dominant negative effect of the over-expression of E2VF1 has not been investigated.
Detection of the E2VF1 fluorescent signal is largely restricted to the nucleus, mirroring the localization of endogenous E2F1 protein [22]. The biggest difference between the two reporter versions is that the reporter lacking the 3′UTR expresses a much higher amount of E2VF1 than the reporter containing the 3′UTR sequence. This differential expression was observed both in polyclonal populations and single cell clones of REF52 cells transduced with the reporters, indicating that the presence of the 3′UTR selectively reduces the overall transcription of the reporter construct, or more likely, the translation/accumulation of the fusion protein. It has been reported that the E2F1 3′UTR contains functional miRNA sites that bind miRs from the miR-20a and miR-17–92 cluster leading to a sharp decrease in E2F1 protein during the cell cycle as part of a delayed negative feedback loop [13,14]. Consistent with this explanation, reduction of E2VF1 signal to baseline level at the single cell level happens sooner and/or more often before the time of mitosis when the reporter contains the 3′UTR.
Time course trajectories of the E2VF1 fluorescent signal obtained from single cells freshly released into the cell cycle follow closely the pattern observed for endogenous E2F1 protein levels, and track well with the tracings obtained for the E2F1 transcriptional and activity reporters [8]. Signals from both of our previous reporters had been carefully calibrated against markers of cell cycle progression, using EdU, GFP-PCNA, FUCCI reporters and phospho-Rb [8,9]. Given the similar activation profiles that we detect for the E2VF1 protein and the E2F activity reporters, we believe that our new reporter is a good proxy for the levels of the E2F1 protein during the cycle. In that regard, it will be interesting to evaluate whether aspects of E2VF1 dynamics alone (in the absence of one of our other reporters) can be predictive of the decision for cells to divide, in light of the fact that other activators such as E2F2 and E2F3 also contribute to E2F activity.
We did observe slightly more complex shapes for the activation kinetics tracings of the E2VF1–3′UTR reporter compared to those from the construct lacking the 3′UTR. However, before more cells are analyzed, we cannot rule out that the observed differences arise from measurement fluctuations inherent to the lower fluorescent intensity of the E2VF1–3′UTR reporter and/or from intrinsic differences in activation between the different cell types in which the measurements were performed.
Given that the Rb binding site in E2F1 [30] is preserved in E2VF1, we wondered whether Rb might impact the behavior or level of E2VF1 signal during the cell cycle. At the population level and in unsynchronized cells, the amount of steady-state E2VF1 protein did not appear to be specifically sensitive to the presence or absence of Rb (data not shown), nor was there a consistent connection between E2VF1 and Rb protein levels in cells expressing both proteins (Fig. 5). Similarly, there were no dramatic changes when tracings of the E2VF1 signal from single cells containing or lacking Rb were compared (Fig. 6). The lack of obvious differences in the E2VF1 trajectories in Rb+ or Rb− clones was somewhat surprising given that the Rb− cells grew at higher density, which could have been the result of an accelerated cell cycle progression. However, we found no clear evidence for that, an observation consistent with the lack of over-proliferation observed for Rb− cells populating mice chimeric for Rb status [31]. Interestingly, we noticed that cells in our Rb− polyclonal or single-cell clones were smaller and more motile than their Rb+ counterparts. In addition, Rb− cells were more sensitive to depletion of growth supplements normally present in the medium and adopted a stereotypical cobblestone morphology when arrested (Supplementary Fig. S5).
Many aspects of E2F1 function(s) and or stability are regulated by post-translational modifications [16]. In particular, it is well established that DNA damaging agents induce E2F1 phosphorylation, resulting in stabilization and accumulation of E2F1 [21]. E2VF1 was similarly stabilized in cells treated with cisplatin. Although the effect was fairly modest in clone 8 cells, which already express a high level of E2VF1, there was a dose-dependent stabilization of the reporter protein in REF52 clone D cells which express a more physiological level of E2VF1. Interestingly, stabilization of the top band of E2VF1 was more pronounced, as the lower band likely lacks serine 31, the residue targeted by ATM in response to DNA damage [21].
MATERIALS AND METHODS
E2F1 protein reporters
(E2VF1 DNA): The coding sequence of Venus flanked in frame by two short DNA sequences encoding flexible linkers fl1(N-GGSGGSGGSGGST-C) and fl2(N-SGGGGSGGGGSGGGGSGS-C) was inserted within the coding region of human E2F1 in place of the sequence encoding amino acid 153 to 174 of E2F1. (pQCXIPmE2F1p::E2VF1): The E2VF1 DNA was fused downstream of the proximal promoter (–1,165 to + 123) of mouse E2F1 gene and the resultant fragment was ligated between the BamH1 and Xba1 sites of the pQXCIP vector (Clontech). (pQCXIP/N-m (or h)E2F1p::pE2VF1–3′ UTR): the 3′UTR from human E2F1 cDNA was ligated downstream of the E2VF1 DNA cassette and the new fragment was either ligated downstream of the mouse or human E2F1 promoter [8]. The new intermediates were inserted between the BamH1 and Xba1 sites of pQXCIP (or pQCXIN) (Fig. 1B). Retroviral stocks corresponding to the various constructs after transfection into ecotropic and amphotropic packaging cell lines (Plat-E or Plat-A cells respectively [32]). The retroviral stocks were used to infect recipient REF52, WI-38 or hTert-HMEE2Fact (clone 1) cells [9]. Puromycin (or neomycin when appropriate) was added to transduced cells for selection of a polyclonal population. Single cell clones were isolated by limiting dilution in the case of REF52 and hTert-HMEE2Fact polyclonal populations.
Rb gene editing
The human Rb gene locus was disrupted using the CRISPR-Cas9 system. Three optimized single-guide RNAs sequences (sgRNAs) were selected to target the region surrounding the start codon of human Rb. These sequences were subcloned into the lentiCRISPRv2 vector [33,34] and lentiviral stocks were generated to independently infect human mammary epithelial HMEE2Fact (clone 1) cells [9]. Bleomycin selection was applied and genomic DNA from polyclonal populations was isolated to screen for disruption of the Rb locus using the Surveyor Mutation Detector kit (IDT). Lack of Rb protein expression in cells targeted by Rb sgRNA (sequence 5’-GCGGTGCCGGGGGTTCCGCGG-3’) was further confirmed by immunoblotting, and a single cell clone (clone 0) was isolated from parental HMEE2Fact Rb− cells.
Cell culture
REF52 cells (an immortal line of post-crisis Fischer rat embryo cells were grown in Minimum Essential Mediumα (MEMα) (Gibco/Invitrogen) supplemented with 10% bovine growth medium (BGS, Hyclone/Thermo Scientific). For time-lapse microscopy and measurements of E2VF1 dynamics, ~1 105 REF52E2VF1 (clone 8) cells were seeded in p35 Mattek optic plates. Cells were synchronized to quiescence (G0) by culturing them in MEMα supplemented with 0.02% BGS (starvation medium) for 36 hours, after which the starvation medium was replaced with fresh medium containing 10% BGS and cells were moved to the Olympus VivaView incubator microscope. For cisplatin-induced DNA damage, ~5 × 10⁵ REF52E2VF1 (clone 8) or REF52E2VF1–3′UTR (clone D) cells were seeded in a 6 well tissue culture dish and grown in full medium overnight after which cisplatin (cis-Diaminedichloroplatimum III, Aldrich 479306) was added at varying concentrations for 24 hours and cell extracts were prepared. WI-38 cells (human fetal lung fibroblasts [35]) (passage 18 through 32) were cultured in Eagle’s Minimum Essential Medium (EMEM) supplemented with 10% BGS. hTert-HMEE2Fact cells expressing the E2Fact reporter [9]) were routinely grown in full medium consisting of Mammary Epithelial Medium 171 (Medium 171; Thermo Fisher M171500) containing Mammary Epithelial Growth Supplement (MEGS; Thermo Fisher S0155). For time-lapse microscopy and measurements of E2VF1 dynamics, trypsinized cells were plated in p35 Mattek optic plates at 30% confluence and incubated overnight in full medium. To synchronize the cultures in G0, the medium was then replaced by 3 mL of Medium 171 lacking any supplement (starvation medium #1). After 24 h, the starvation medium 1 was replaced by 3 mL of Medium 171 supplemented with 30 L of full medium (starvation medium #2). Cells were further incubated in this medium for 24 h, at which point the starvation medium 2 was replaced by 3 mL of full medium and cultures were moved to the Olympus VivaView incubator microscope for live imaging.
Live cell imaging
REF52 WT, REF52E2VF1 (clone 8), REF52 E2VF1–3′UTR (clone D) cells were imaged under brightfield or DIC illumination and YFP illumination (20×) to confirm expression and localization of the fusion protein. For time-lapse microscopy, quiescent cells growing in 35 mm p35 Mattek optic plates were released into the cell cycle and placed into the Olympus VivaView FL incubator microscope. Images were taken every 30 min for 36 h using a 20×0.75 DIC Olympus UPlanSAPO 0.65 mm WD objective lens under DIC illumination and YFP 25% illumination (150 msec). Quiescent HMEE2Fact Rb+, E2VF1–3′UTR (clone R15) and HMEE2Fact Rb−, E2VF1–3′UTR (clone H4) cells were released into the cell cycle and placed into Olympus VivaView FL incubator microscope. Images were taken every 30 min for 40 h using a 20×0.75 DIC Olympus UPlanSAPO 0.65 mm WD objective lens under DIC illumination (30 msec), RFP 25% illumination (300 msec), YFP 25% illumination (1,000 msec) (binning 2). For time course fluorescence quantification, images were analyzed in ImageJ and values were determined as previously described [8].
Fixed cell imaging
HMEE2Fact Rb−, E2VF1–3′UTR cells were plated on 12 mm #1.5 coverslips pre-treated with a 0.1% gelatin solution and placed in single wells of a 6-well plate containing 3 mL of complete growth medium. After 24 h, cells were fixed in 4% PFA (Image-IT™ ThermoFisher) according to the manufacturer’s recommendations and permeabilized in 0.3% Tween 20 for 5 min. The coverslips were then mounted on slides using Prolong Diamond with DAPI (ThermoFisher). Confocal images were obtained on the Zeiss 780 inverted confocal microscope (63×/1.4 NA Oil Plan-Apochromat DIC) in the 405 nm (DAPI), 514 nm (EYFP) and 561 nm (mcherry) channels respectively.
Western blot analysis
Cells of interest were harvested, and protein extracts were obtained after cell lysis in RIPA buffer supplemented with a cocktail of protease inhibitors. Protein concentrations were determined using the Thermo Fisher BCA assay (Pierce). Equal protein amounts were run on Bolt 4%–12% Bis-Tris Plus gels (Invitrogen) and transferred to polyvinylidene membranes by electroblotting. Membranes were blocked with 5% nonfat dried milk/TBST buffer (Blotto) for an hour, incubated for an hour with primary antibody, washed with TBS and 0.05% Tween (TBST), and incubated again with secondary antibody in Blotto solution. Detection was performed via the LumiGLO Peroxidase Chemiluminescent Substrate Kit (Cell Signaling). The same membranes were re-probed after stripping to control for equal loading using β-actin as a control. Antibodies: E2F1: anti-hE2F1 3742S (1:1000, Cell Signaling); Rb: anti-Rb clone G3–245 (1:250, BD Biosciences); β-actin: anti-β-actin 8H10D10 (1:1000, Cell Signaling); Secondary antibodies: anti-Rabbit or anti-Mouse Ig-conjugated with HRP (1:1000, Cell Signaling). When indicated, E2vF1 protein level were quantified and normalized against β-actin levels using the ImageJ gel module.
Supplementary Material
ACKNOWLEDGEMENTS
We thank Y. Gao for his help with time-lapse and confocal microscopy at the Duke Light Microscopy Core Facility. This research was supported by a grant from NIH (1R01-GM106107) (L.Y and B.M-P.), and funds from the School of Medicine at Duke University (B.M-P).
Footnotes
SUPPLEMENTARY MATERIALS
The supplementary materials can be found online with this article at https://doi.org/10.1007/s40484-019-0193-6.
COMPLIANCE WITH ETHICS GUIDELINES
All procedures performed in studies were in accordance with the ethical standards of the institutional and/or national research committee and with the 1964 Helsinki declaration and its later amendments or comparable ethical standards.
The authors Bernard Mathey-Prevot, Bao-Tran Parker, Carolyn Im, Cierra Hong, Peng Dong, Guang Yao and Lingchong You declare that they have no conflict of interests.
REFERENCES
- 1.Fischer M and Müller GA (2017) Cell cycle transcription control: DREAM/MuvB and RB-E2F complexes. Crit. Rev. Biochem. Mol. Biol, 52, 638–662 [DOI] [PubMed] [Google Scholar]
- 2.Bertoli C, Skotheim JM and de Bruin RAM (2013) Control of cell cycle transcription during G1 and S phases. Nat. Rev. Mol. Cell Biol, 14, 518–528 [DOI] [PMC free article] [PubMed] [Google Scholar]
- 3.Ren B, Cam H, Takahashi Y, Volkert T, Terragni J, Young RA and Dynlacht BD (2002) E2F integrates cell cycle progression with DNA repair, replication, and G(2)/M checkpoints. Genes Dev, 16, 245–256 [DOI] [PMC free article] [PubMed] [Google Scholar]
- 4.van den Heuvel S and Dyson NJ (2008) Conserved functions of the pRB and E2F families. Nat. Rev. Mol. Cell Biol, 9, 713–724 [DOI] [PubMed] [Google Scholar]
- 5.Henley SA and Dick FA (2012) The retinoblastoma family of proteins and their regulatory functions in the mammalian cell division cycle. Cell Div, 7, 10. [DOI] [PMC free article] [PubMed] [Google Scholar]
- 6.Sherr CJ and Roberts JM (2004) Living with or without cyclins and cyclin-dependent kinases. Genes Dev, 18, 2699–2711 [DOI] [PubMed] [Google Scholar]
- 7.Chen H-Z, Tsai S-Y and Leone G (2009) Emerging roles of E2Fs in cancer: an exit from cell cycle control. Nat. Rev. Cancer, 9, 785–797 [DOI] [PMC free article] [PubMed] [Google Scholar]
- 8.Dong P, Maddali MV, Srimani JK, Thélot F, Nevins JR, Mathey-Prevot B and You L (2014) Division of labour between Myc and G1 cyclins in cell cycle commitment and pace control. Nat. Commun, 5, 4750. [DOI] [PMC free article] [PubMed] [Google Scholar]
- 9.Dong P, Zhang C, Parker B-T, You L and Mathey-Prevot B (2018) Cyclin D/CDK4/6 activity controls G1 length in mammalian cells. PLoS One, 13, e0185637. [DOI] [PMC free article] [PubMed] [Google Scholar]
- 10.Dimova DK and Dyson NJ (2005) The E2F transcriptional network: old acquaintances with new faces. Oncogene, 24, 2810–2826 [DOI] [PubMed] [Google Scholar]
- 11.Dimri GP, Itahana K and Acosta M (2000). Regulation of a senescence checkpoint response by the E2F1 transcription factor and p14ARF tumor suppressor. Mol. Cell. Biol [DOI] [PMC free article] [PubMed]
- 12.Cuitiño MC, Pécot T, Sun D, Kladney R, Okano-Uchida T, Shinde N, Saeed R, Perez-Castro AJ, Webb A, Liu T, et al. (2019) Two distinct E2F transcriptional modules drive cell cycles and differentiation. Cell Reports, 27, 3547–3560.e5 [DOI] [PMC free article] [PubMed] [Google Scholar]
- 13.O’Donnell KA, Wentzel EA, Zeller KI, Dang CV and Mendell JT (2005) c-Myc-regulated microRNAs modulate E2F1 expression. Nature, 435, 839–843 [DOI] [PubMed] [Google Scholar]
- 14.Pickering MT, Stadler BM and Kowalik TF (2009) miR-17 and miR-20a temper an E2F1-induced G1 checkpoint to regulate cell cycle progression. Oncogene, 28, 140–145 [DOI] [PMC free article] [PubMed] [Google Scholar]
- 15.Iaquinta PJ and Lees JA (2007) Life and death decisions by the E2F transcription factors. Curr. Opin. Cell Biol, 19, 649–657 [DOI] [PMC free article] [PubMed] [Google Scholar]
- 16.Poppy Roworth A, Ghari F and La Thangue NB (2015) To live or let die–complexity within the E2F1 pathway. Mol. Cell. Oncol, 2, e970480. [DOI] [PMC free article] [PubMed] [Google Scholar]
- 17.Zheng N, Fraenkel E, Pabo CO and Pavletich NP (1999) Structural basis of DNA recognition by the heterodimeric cell cycle transcription factor E2F-DP. Genes Dev, 13, 666–674 [DOI] [PMC free article] [PubMed] [Google Scholar]
- 18.Munro S, Carr SM and La Thangue NB (2012) Diversity within the pRb pathway: is there a code of conduct? Oncogene, 31, 4343–4352 [DOI] [PubMed] [Google Scholar]
- 19.Kozak M (1987) An analysis of 5′-noncoding sequences from 699 vertebrate messenger RNAs. Nucleic Acids Res, 15, 8125–8148 [DOI] [PMC free article] [PubMed] [Google Scholar]
- 20.Wong JV, Dong P, Nevins JR, Mathey-Prevot B and You L (2011) Network calisthenics: control of E2F dynamics in cell cycle entry. Cell Cycle, 10, 3086–3094 [DOI] [PMC free article] [PubMed] [Google Scholar]
- 21.Lin WC, Lin FT and Nevins JR (2001) Selective induction of E2F1 in response to DNA damage, mediated by ATM-dependent phosphorylation. Genes Dev, 15, 1833–1844 [PMC free article] [PubMed] [Google Scholar]
- 22.Magae J, Wu CL, Illenye S, Harlow E and Heintz NH (1996) Nuclear localization of DP and E2F transcription factors by heterodimeric partners and retinoblastoma protein family members. J. Cell. Sci, 109, 1717–1726 [DOI] [PubMed] [Google Scholar]
- 23.Allen KE, de la Luna S, Kerkhoven RM, Bernards R and La Thangue NB (1997) Distinct mechanisms of nuclear accumulation regulate the functional consequence of E2F transcription factors. J. Cell. Sci, 110, 2819–2831 [DOI] [PubMed] [Google Scholar]
- 24.Ivanova IA, Vespa A and Dagnino L (2007) A novel mechanism of E2F1 regulation via nucleocytoplasmic shuttling: determinants of nuclear import and export. Cell Cycle, 6, 2186–2195 [DOI] [PubMed] [Google Scholar]
- 25.Hofmann F, Martelli F, Livingston DM and Wang Z (1996) The retinoblastoma gene product protects E2F-1 from degradation by the ubiquitin-proteasome pathway. Genes Dev, 10, 2949–2959 [DOI] [PubMed] [Google Scholar]
- 26.Campanero MR and Flemington EK (1997) Regulation of E2F through ubiquitin-proteasome-dependent degradation: stabilization by the pRB tumor suppressor protein. Proc. Natl. Acad. Sci. USA, 94, 2221–2226 [DOI] [PMC free article] [PubMed] [Google Scholar]
- 27.Blanchet E, Annicotte J-S, Lagarrigue S, Aguilar V, Clapé C, Chavey C, Fritz V, Casas F, Apparailly F, Auwerx J, et al. (2011) E2F transcription factor-1 regulates oxidative metabolism. Nat. Cell Biol, 13, 1146–1152 [DOI] [PMC free article] [PubMed] [Google Scholar]
- 28.Shats I, Deng M, Davidovich A, Zhang C, Kwon JS, Manandhar D, Gordân R, Yao G and You L (2017) Expression level is a key determinant of E2F1-mediated cell fate. Cell Death Differ, 24, 626–637 [DOI] [PMC free article] [PubMed] [Google Scholar]
- 29.Yu W, Chan-On W, Teo M, Ong CK, Cutcutache I, Allen GE, Wong B, Myint SS, Lim KH, Voorhoeve PM, et al. (2011) First somatic mutation of E2F1 in a critical DNA binding residue discovered in well-differentiated papillary mesothelioma of the peritoneum. Genome Biol, 12, R96. [DOI] [PMC free article] [PubMed] [Google Scholar]
- 30.Helin K, Lees JA, Vidal M, Dyson N, Harlow E and Fattaey A (1992) A cDNA encoding a pRB-binding protein with properties of the transcription factor E2F. Cell, 70, 337–350 [DOI] [PubMed] [Google Scholar]
- 31.Hanahan D and Weinberg RA (2011) Hallmarks of cancer: the next generation. Cell, 144, 646–674 [DOI] [PubMed] [Google Scholar]
- 32.Morita S, Kojima T and Kitamura T (2000) Plat-E: an efficient and stable system for transient packaging of retroviruses. Gene Ther, 7, 1063–1066 [DOI] [PubMed] [Google Scholar]
- 33.Sanjana NE, Shalem O and Zhang F (2014) Improved vectors and genome-wide libraries for CRISPR screening. Nat. Methods, 11, 783–784 [DOI] [PMC free article] [PubMed] [Google Scholar]
- 34.Shalem O, Sanjana NE, Hartenian E, Shi X, Scott DA, Mikkelson T, Heckl D, Ebert BL, Root DE, Doench JG, et al. (2014) Genome-scale CRISPR-Cas9 knockout screening in human cells. Science, 343, 84–87 [DOI] [PMC free article] [PubMed] [Google Scholar]
- 35.Hayflick L (1965) The limited in vitro lifetime of human diploid cell strains. Exp. Cell Res, 37, 614–636 [DOI] [PubMed] [Google Scholar]
Associated Data
This section collects any data citations, data availability statements, or supplementary materials included in this article.