

Abstract
Reducing food loss and waste (FLW) is widely recognized as an important lever for lowering the environmental impacts of food systems. The United Nations Sustainable Development Agenda includes a goal to reduce FLW by 50% by 2030. Given differences in resource inputs along the food supply chain (FSC), the environmental benefits of FLW reduction will vary by stage of the FSC. Here, we identify the points along the supply chain where a 50% FLW reduction could yield the largest potential environmental benefits, assuming that decreases in consumption propagate back up the supply chain to reduce production. We use an environmentally extended input-output (EEIO) model combined with data on rates of FLW to calculate the scale of the total environmental impacts of the U.S. food system resulting from lost or wasted food. We evaluate the maximum potential environmental benefit resulting from 50% FLW reduction at all possible combinations of six supply chain stages (agricultural production, food processing, distribution/retail, restaurant foodservice, institutional foodservice, and households).
We find that FLW reduction efforts should target the foodservice (restaurant) sector, food processing sector, and household consumption. Halving FLW in the foodservice sector has the highest potential to reduce greenhouse gas output and energy use. Halving FLW in the food processing sector could reduce the most land use and eutrophication potential, and reducing household consumption waste could avert the most water consumption. In contrast, FLW reduction at the retail, institutional foodservice, and farm level averts less environmental impact. Our findings may help determine optimal investment in FLW reduction strategies.
1. Introduction
1.1. The food waste problem
The global food system, with its complex links between producers, processors, retailers, and consumers, generates vast amounts of waste (Gustavsson et al., 2011). Existing production, distribution, and consumption practices are likely unsustainable given a changing climate and a growing population. Reducing food loss and waste (FLW) along the food supply chain (FSC), thereby increasing efficiency of resource use, can reduce the toll exacted on the environment by the food system (Willett et al., 2019). It is possible that waste reduction would be more politically and logistically tractable than other changes such as large-scale dietary shifts (Smith, 2013). Governments and the United Nations (Rosa, 2017) have set reduction goals, and private companies and NGOs have begun to implement various interventions aiming to reduce FLW (ReFED, 2016). To prioritize specific interventions, it is vital to quantify the potential environmental benefit of interventions that target different stages of the supply chain (Garrone et al., 2014). Only by analyzing effects along the supply chain (Beretta et al., 2017) can we determine the system-wide impact of individual efforts to reduce FLW (Muth et al., 2019).
1.2. Food losses along the food supply chain
FLW occurs for different reasons at different points along the FSC (Fig. 1). For instance, at the agricultural production stage, a portion of the crop may be left unharvested because the potential revenue from selling that crop may be less than the cost of harvesting (Johnson et al., 2018a), or because farmers hedge against uncertainty by intentionally planting more than needed to fill their contracts (Milepost Consulting, 2012). At intermediate stages, food may spoil because of a failure of logistics (Jedermann et al., 2014), or it may be intentionally discarded if it does not meet cosmetic standards (Kantor et al., 1997). Consumers at home and at foodservice establishments may throw out excess uneaten food resulting from poor meal planning or overpurchasing, or discard unspoiled food due to confusion about the expiration date (Wilson et al., 2018), among many other waste drivers (Quested and Johnson, 2009).
Figure 1:
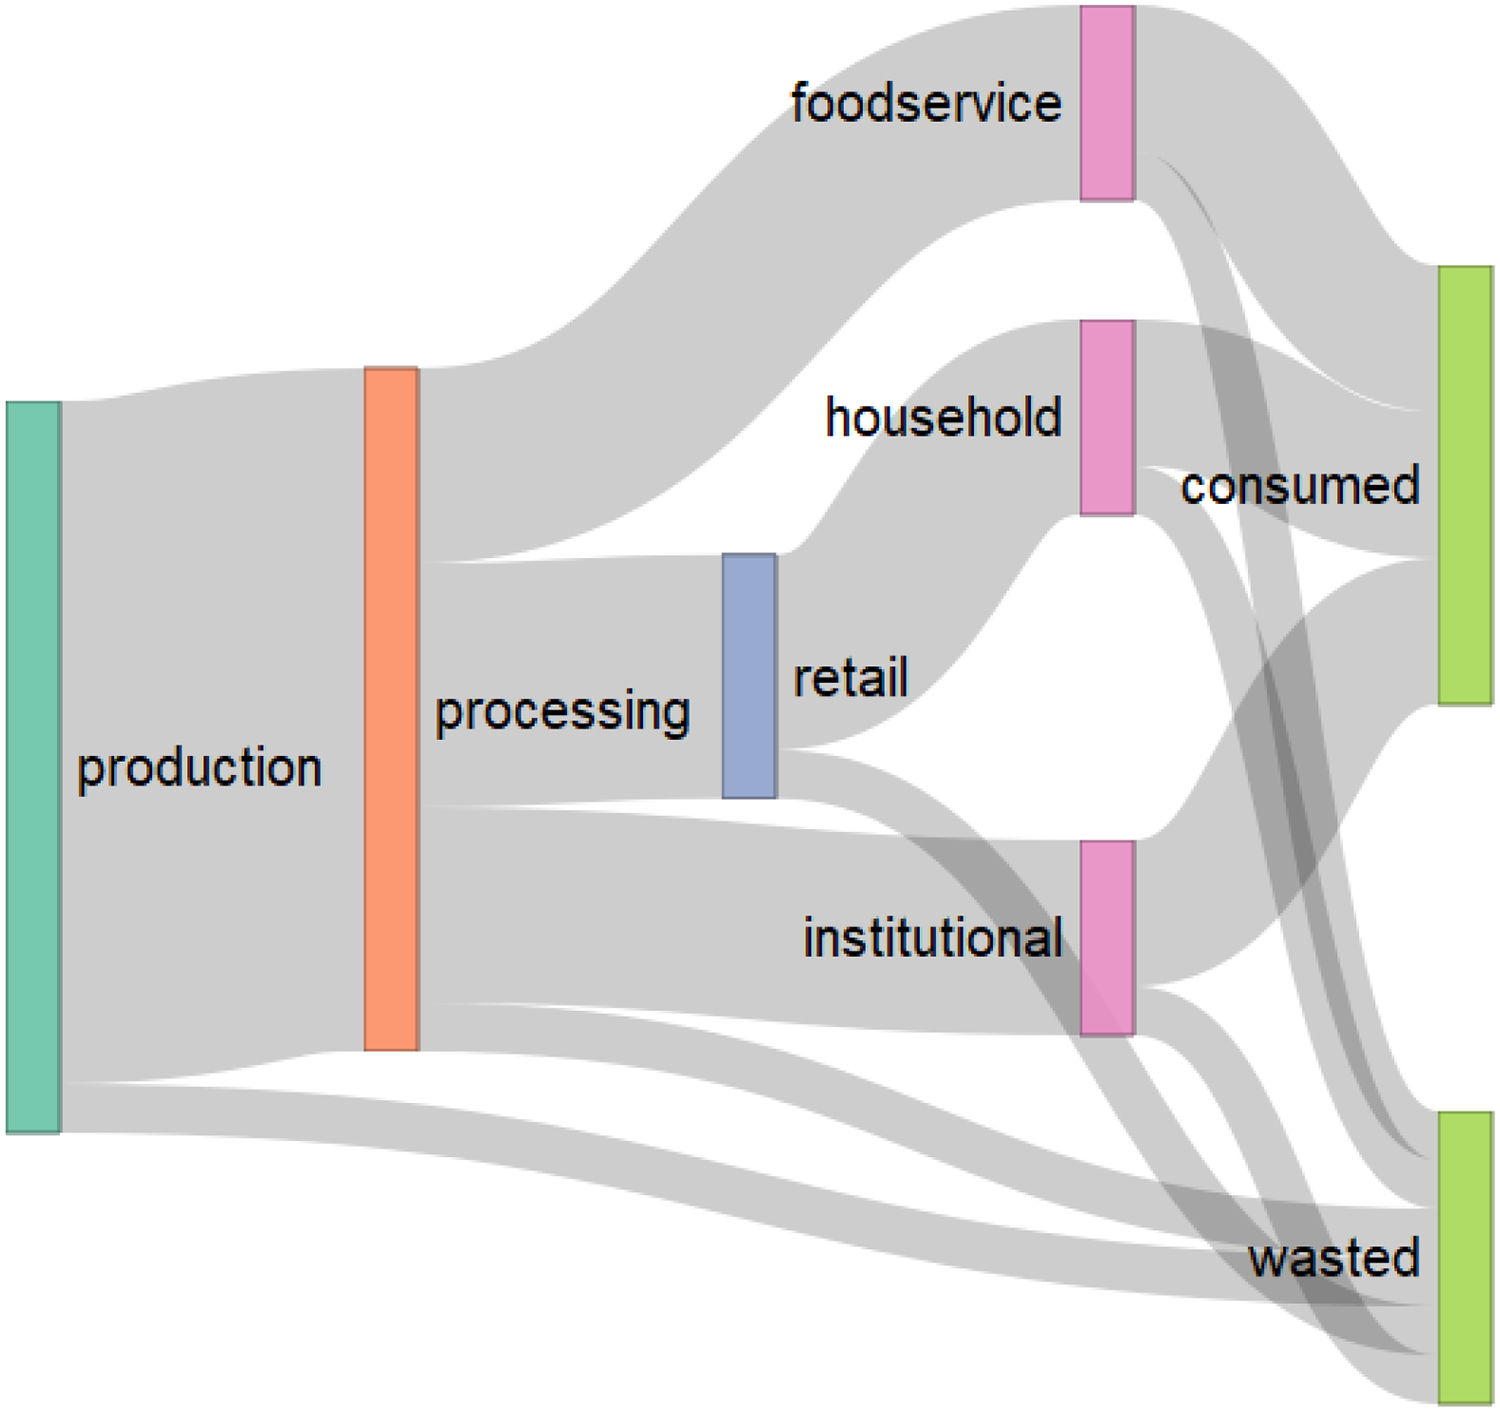
A simplified model of how food flows through the food supply chain, as conceptualized in this study. FLW is generated at all stages: agricultural production, food processing, retail, and consumption. We distinguish between consumption at food service establishments, at institutions such as school or hospital cafeterias, and in households.
The variation in causes of FLW along the supply chain leads to variation in the volume of waste generated at each stage. The U.N. Food and Agriculture Organization (FAO) estimates that worldwide, 413 MT of food is wasted at the agricultural production stage, 293 MT in post-harvest handling and storage, 148 MT in processing, 161 MT in distribution, and 280 MT in consumption (Gustavsson et al., 2013). Furthermore, different types of food are lost or wasted at different rates both within and among stages: the U.S. Department of Agriculture estimates that ~30% of fruits and vegetables are wasted in the retail and consumer stages combined, compared to 26% of meat, poultry and fish, 15% of nuts, and 41% of sugars and sweeteners (Buzby et al., 2014). Because waste occurs for many reasons at each stage, and because each FLW reduction intervention typically addresses only one or two causes, it is necessary to combine multiple interventions at each stage to have an appreciable impact on the total amount of waste.
1.3. Virtually and physically embodied impacts
As food travels along the FSC, various inputs of resources are used to transport, process, store, and preserve it – the consumption of these resources burdens the environment in various ways (Muth et al., 2019). For example, previous work has found the yearly per capita energy footprint of FLW in the United States to be ~6–9 GJ (Birney et al., 2017; Cuéllar and Webber, 2010; Hall et al., 2009), the total blue water (i.e., surface water and groundwater combined) consumed to produce wasted food to be ~40,000–50,000 L (Birney et al., 2017; Kummu et al., 2012), and the land used to be ~500–1100 m2 (Birney et al., 2017; Kummu et al., 2012). At a given point along the supply chain, some materials and resources are physically present in the food. However, most of the resources consumed or emitted to the environment do not remain in the product, but instead are ‘virtually’ embodied in that food item. An accounting of these virtual resources allows for a better representation of the true resource use and environmental impact associated with the production, distribution, and consumption of a food item from farm to fork. If the food ends up lost or wasted, both the physically and virtually embodied resources are lost. If FLW occurs further downstream along the FSC nearer the consumer, the virtual resource loss dwarfs the direct loss (Leach et al., 2012). If reduction in downstream purchases results in any decrease in upstream production, reducing waste in downstream stages will reduce both direct environmental impacts at that stage and, indirectly, the virtual impacts generated at upstream stages.
1.4. The 50% food loss and waste reduction goal
The United Nations Sustainable Development Goals, adopted in 2015, include a FLW reduction objective. The resolution sets the target of 50% FLW reduction at the retail and consumer levels by 2030, along with a nonspecific goal of reducing waste at earlier supply chain stages, including post-harvest losses (Target 12.3; Rosa, 2017). The agreed-upon agenda includes some proposed methods for measuring progress toward the target in terms of quantity of waste reduced. However, it provides no guidelines for quantifying the environmental benefits associated with the waste reduction, nor does it make specific policy recommendations for reaching the 50% goal. Despite this lack of concrete guidance, the goal of halving FLW by 2030 has been adopted in the United States at the federal level by the EPA, FDA, and USDA (US EPA, 2019), as well as by some state and local governments (Association of Washington Cities, 2019). These resolutions do not detail how the governing body plans to achieve the 50% reduction, nor are they accompanied by plans to assess environmental benefits. Non-governmental organizations have also included language about the 50% reduction in their publications, notably ReFED, which lists 50% as the ultimate goal while providing specific recommendations for reducing FLW by 20% in the near future (ReFED, 2016).
The commitment of institutions around the globe to cut FLW in half has led researchers to include it in projections of food system sustainability. A recent study estimates that the 50% FLW reduction goal would reduce the amount of resources used by the food system by a magnitude comparable to the reductions resulting from widespread dietary changes and technological changes in agricultural production (Springmann et al., 2018). The goal of halving FLW has clearly gained momentum as a policy objective. However, setting the 50% target for the entire food system does not lend itself to developing feasible solutions because of the multitude of stakeholders involved. An alternative approach is to assess the potential effects of 50% FLW reduction at individual stages of the FSC, where one or several policy interventions can be implemented to achieve that waste reduction. In this study, we compare the potential environmental benefits from 50% FLW reduction at individual stages of the supply chain to help prioritize FLW reduction efforts. Here, we do not account for variation in the cost of FLW reduction efforts among different stages nor do we prescribe specific intervention methods. Our sole focus is the potential environmental benefit of meeting the 50% target at each stage of the FSC, ignoring any other potential social or health effects.
1.5. Research question
The motivating question for this study is: Using the 50% reduction goal as a benchmark, which stages of the FSC in the United States have the highest potential to reduce resource use and environmental impact? We hypothesize that reducing FLW at downstream stages of the supply chain will avert the most environmental impacts, especially at the consumer level, because more impacts are virtually embodied in that food at later stages and because reduction at downstream stages may reduce demand upstream (Rutten, 2013).
2. Materials and methods
2.1. Outline of approach
We took the following approach to answer our research question. First, we modified an environmentally extended input-output (EEIO) model (Miller and Blair, 2009) to represent the United States FSC within the context of the national economy. We assigned the industries making up the economy to different stages of the FSC. Next, we used FLW rates for each stage of the FSC to estimate the baseline environmental impacts and resource use of the entire food system and the proportion of those impacts virtually embodied in food that is lost or wasted. Finally, we calculated the reductions in intermediate and final demand values that would result from 50% reductions in the FLW rate at each individual stage of the FSC. We used these values to estimate the maximum potential reduction in the food system’s environmental impact and resource use that would result from reducing FLW at one or more stages of the FSC. These estimates are upper bounds because we assumed that reduced demand at downstream stages causes equivalent decreases in production upstream, and that there is no demand for potential surplus created because of reduced waste rates. Finally, for each impact category, we ranked stages by priority of reduction.
2.2. EEIO model
We used an EEIO model (Miller and Blair, 2009), which is an extension of the basic input-output model originally developed by Leontief (1970), to estimate the direct and indirect environmental impacts of the FSC. The model consists of a matrix A of coefficients representing economic flows between industries, a final demand vector f representing the final industry output available to consumers after accounting for intermediate uses of gross industry output by other industrial processes, and a matrix of coefficients B representing the direct environmental impact of producing a given amount of output by each industry. The product m = B(I − A)−1f is the total environmental footprint of satisfying the given final consumer demand across all impact categories.
The primary source of data used to parameterize input-output models in the United States are the Bureau of Economic Analysis’ (BEA’s) input-output accounts. The BEA releases benchmark input-output tables every five years, with 2012 being the most recent available year. These tables show the relationships among 389 industries classified using a scheme based on the North American Industry Classification System (NAICS; https://www.census.gov/eos/www/naics). Many of the BEA industry codes correspond exactly to a single NAICS industry code, but some represent aggregations of multiple NAICS codes.
We use the EPA’s USEEIO model, version 1.1 (Yang et al., 2017) to estimate environmental impacts at each stage of the FSC. The environmental impact coefficients that the EPA compiled include values across 389 industries by 21 environmental impact categories that represent the incremental increase of environmental impact in that category for each additional $1 of output produced by that industry. For example, production of every $1 of output by the bread industry results in a certain amount of GHG emissions, land use, water use, etc. If consumer demand for bread is increased in the model, both the direct impacts incurred by the bread industry and the indirect impacts of bread production (e.g., from the grain farming industry) increase. The various satellite tables in the USEEIO model were compiled from many data sources. The results presented in this manuscript derive from the satellite tables for energy, greenhouse gases, land, nitrogen, and water (see Appendix A.1 for details on the data sources).
The USEEIO model has been applied to the U.S. food system (Boehm et al., 2019; Heller et al., 2018; Ingwersen et al., 2017), but our study represents one of the few applications of the EEIO approach to determining the environmental impacts of wasted food. To our knowledge, similar approaches have only been applied to Australian (Reutter et al., 2017; Reynolds, 2013), and Japanese food systems (Nakamura and Kondo, 2009; Takase et al., 2008).
2.3. Data sources and data processing
2.3.1. Estimating baseline rates of FLW
We used a combination of data sources to estimate the loss rates for different food commodity groups at different stages of the FSC. The FAO (Gustavsson et al., 2013, Gustavsson et al., 2011) estimated the loss rates for eleven food groups at five stages of the FSC. The loss estimates come from disparate data sources documented in the appendix of Gustavsson et al. (2013). Though data for North America and Oceania are pooled, for most food groups U.S. values were used to represent the region.
The five stages in the FAO report are agricultural production, handling & storage, processing & packaging, distribution, and consumption. We combined handling & storage with processing & packaging to represent the processing stage, resulting in four stages (Table 1). The production stage is assigned the agricultural production loss rate, the processing stage is assigned the total loss rate between handling/storage and processing/packaging, and the retail stage is assigned the distribution/retail loss rate. We used the same consumption loss rate for the foodservice industry, institutional consumption, and household consumption. The foodservice industry includes restaurants as well as food sold by the transportation, recreation, and hospitality industries. Institutional foodservice includes food provided at schools, universities, hospitals, residential facilities, community services, and government facilities, typically by contracted foodservice operators.
Table 1.
Food loss and waste rates by food group and stage of the food supply chain.
| Stage of Food Supply Chain | ||||||
|---|---|---|---|---|---|---|
| Food Group | Production | Processing | Retail | Consumption* | Total | |
| cereals | 2.0% | 11.8% | 2.0% | 27.0% | 38.2% | |
| roots and tubers | fresh | 20.0% | 23.5% | 7.0% | 30.0% | 60.2% |
| processed | — | 23.5% | 3.0% | 12.0% | 34.7% | |
| oilseeds and pulses | 12.0% | 5.0% | 1.0% | 4.0% | 20.5% | |
| fruits and vegetables | fresh | 20.0% | 5.9% | 12.0% | 28.0% | 52.3% |
| processed | — | 5.9% | 2.0% | 10.0% | 17.0% | |
| meat | 3.7% | 6.0% | 4.0% | 11.0% | 22.6% | |
| fish and seafood | fresh | 12.0% | 6.5% | 9.0% | 33.0% | 49.8% |
| processed | — | 6.5% | 5.0% | 10.0% | 20.0% | |
| milk | 3.5% | 1.7% | 0.5% | 15.0% | 19.8% | |
| eggs | 4.0% | 0.5% | 2.0% | 15.0% | 20.4% | |
| sugar | 2.0% | 11.8% | 11.0% | 34.0% | 49.2% | |
| beverages | — | 4.5% | 5.0% | 8.0% | 16.5% | |
Modified from Gustavsson et al. 2013; see text.
The consumption stage includes foodservice, institutional foodservice, and household consumption.
The FAO dataset excludes two important categories that together comprise a substantial portion of the food system: sugars/sweeteners and beverages. For sugars and sweeteners, we used the FAO’s loss rates for cereal crops for the production and processing stages, and the weighted mean of all sweetener loss rates from the USDA’s Loss-Adjusted Food Availability data series (Buzby et al., 2014) for the retail and consumption stages. For beverages, we derived an estimate for processing loss from a report produced in the U.K. by the Waste and Resources Action Programme (WRAP, 2012), distribution loss from a report on retail shrink rates (Retail Profit Solutions, 2012), and consumption loss from another WRAP report (Quested and Murphy, 2014).
2.3.2. Weighting each industry by FSC proportion and food group composition
We assigned 76 of the 389 industries in the BEA input-output table to a stage of the FSC, assigning industries to FSC stages based on the first digit of the industry’s BEA code (Table B.1; Appendix A.2). Some of the 76 industries belong entirely to the FSC, while others represent aggregations of multiple smaller industries, only some of which belong to the FSC. In addition, in order to determine the baseline FLW rate for each industry, we determined what food commodity groups it produces. We used multiple data sources to find the proportion of each industry’s output that belongs to the FSC, as well as the proportions of each industry’s output consisting of each food commodity group (Table B.1; Appendix A.3).
2.3.3. Limitations of data sources
There are two reasons why the FLW rates we used may be slightly underestimated, potentially leading to even greater environmental impact estimates than those reported here. First, there may be a high amount of unreported retail loss, or retailers may attribute the loss of product to producers or consumers. For example, retailers may refuse to accept a shipment of imperfect produce, so that the producer is responsible for its loss. Second, on-farm loss may be underestimated; for example, the on-farm loss rate estimate cited by FAO for all fruits and vegetables in North America, Oceania, and Europe is derived from a single study of potatoes in Sweden conducted in 2001, and other FAO on-farm loss rates are derived from assumptions rather than data. Some recent work shows that at least for fruit and vegetable crops, the proportion of unharvested produce may be much higher than previously thought (Johnson et al., 2018b).
The coarseness of the EEIO approach, and the high number of assumptions required, may limit the precision of our results. In particular, the EEIO model is a linear model which assumes that changes in production are perfectly responsive to changes in consumption. In addition, the model represents a single “snapshot” of economic relationships over the course of a single year. Therefore, it assumes that responses to technologically-driven or policy-driven changes in demand or consumption take place instantaneously. Another limitation is the relatively crude treatment of imports and exports. In the model, imports and exports are included as final uses of industry output but their origins and destinations are not differentiated. A full accounting of the impact of FLW on the environment should include the virtual environmental impacts attributable to food imported into the United States. Global multiregional input-output models with each country represented as a region (Lenzen et al., 2013) can be used, for example to model how biodiversity threats are exported among countries (Chaudhary and Kastner, 2016; Lenzen et al., 2012). A more complete accounting of the environmental impacts of FLW in the United States would include the global impacts resulting from U.S. food trade.
2.4. Estimating baseline environmental impacts of the food system
We used the 2012 BEA benchmark input-output tables to build the EEIO model, but we mapped the 2012 BEA industry coding schema back to the 2007 schema for compatibility with the remainder of the model. Three of the 2012 industry codes (of a total of 389) needed to be split, and five needed to be aggregated, to match the 2007 codes. We renormalized the values in the new split or aggregated columns using the ratios of total column values from the 2007 tables where necessary. The resulting input-output table for 2012 was used to construct the A matrix (commodity-by-commodity direct requirements matrix) used in the model. Next, we evaluated the input-output model using a final demand vector in which demand for the output of all non-FSC industries was set to zero. We multiplied the final demand for industries that only partially belong to the FSC by the FSC proportion for those industries. Therefore, the final demand vector represents total personal consumption expenditures on food in the United States in 2012. We evaluated the EEIO model to yield total environmental impact values for the following five categories: energy use, eutrophication potential due to nitrogen (N) release, global warming potential due to greenhouse gas (GHG) emissions, land use, and water use (total blue water withdrawals).
2.5. Altering model structure to simulate 50% FLW reduction
In our analysis, we assume that reducing FLW in FSC industries (the production, processing, retail, foodservice, and institutional industries) reduces the intermediate inputs required for those industries to produce output. Reducing waste on the consumer side (in the foodservice, institutional, and household consumption phases) reduces final demand for food and beverages in the EEIO model. For example, if the retail stage generates 50% less waste but continues to satisfy the same amount of demand, the column of input coefficients to the retail stage would decrease. If the household consumption stage becomes 50% less wasteful, final demand by households for all food-related products would decrease because households need to purchase less food in order to attain the same level of final, non-wasted consumption. If the foodservice or institutional foodservice stages become 50% less wasteful, both intermediate and final demand for those industries would decrease.
The counterfactual final demand value dnew associated with a proportional reduction r in the rate of FLW and an original demand value dbaseline is given by Eq. (1).
| (1) |
In Eq. (1), Wbaseline is the baseline rate of FLW in that industry and pFSC is the proportion of that industry’s output that is associated with the FSC. As mentioned above, pFSC = 1 for many industry sector codes such as “cookie, cracker, and pasta manufacturing,” but pFSC < 1 for industry sector codes such as “warehousing and storage”; the latter is an aggregation of food and non-food industries. Eq. (1) is derived from first principles, assuming that there is a direct linear relationship between the value of inputs and value of outputs for an industry, that there are no additional resources required when implementing waste prevention, that there are no by-products of waste prevention that must be dealt with, and that the proportion of an industry’s output by value that is food is directly proportional to the proportion of its input by value that is food.
We simulate FLW reduction in an industry by reducing all values in the column of the direct requirements coefficients matrix by the proportion given in Eq. (1), representing intermediate demand for inputs by that industry. If households generate less FLW, the appropriate elements of the final demand vector (personal consumption expenditures column), representing consumer purchases of agricultural products, processed food, and food from retail stores, are reduced by the proportion in Eq. (1). If less FLW is generated in one or more foodservice industries, the elements of the final demand vector corresponding to those industries are reduced, as well as the intermediate inputs to those industries. Altering the coefficients exogenously in this way does not require any rescaling of other coefficients (Wiebe et al., 2018). Note that input-output models are both linear and demand-driven, requiring the assumption that the supply curve is infinitely elastic with respect to demand (Miller and Blair, 2009). Furthermore, we made the assumption that reduction in demand at a downstream stage (Eq. (1)) will cause upstream producers to reduce supply by the same amount. After applying the changes to the direct requirements coefficients and personal consumption expenditures values and rebuilding the model, we evaluated the model again.
We evaluated the model for all possible combinations of 50% FLW reduction among the six stages (26 = 64 different scenarios). In each scenario, we reduced FLW by exactly 50% in one or more of the six stages. We also evaluated the model assuming 100% FLW reduction in all six stages. The resulting impact vector from the 100% reduction scenario represents the total environmental impact of the food system excluding impacts due to food that is lost or wasted. Subtracting this vector from the baseline impact vector yields the environmental impact due to FLW in the baseline scenario.
We repeated the above procedure for each of the thirteen food commodity groups separately. To disaggregate downstream FLW volumes (foodservice, retail, and household) to individual commodity groups, we multiplied the FLW rate for each industry by the proportion weight for each food group. This multiplication yields the FLW rate for each food group within each industry, relative to the total volume of demand for that industry. We used these food group-specific rates to calculate the demand reductions associated with 50% reduction in waste of only the target food group. Using these reductions, we created a separate prioritization by stage for waste reduction for each separate food commodity group.
2.6. Characterizing uncertainty in results
2.6.1. Sources of data uncertainty
There are four sources of data uncertainty: the baseline FLW rate data compiled by FAO from various sources, the weighting values used to assign industries to the FSC and to different food groups, the input-output data derived from BEA, and the environmental impact data compiled by EPA from various sources. Because no formal uncertainty values are provided with any of the input data, we conducted a semi-qualitative sensitivity analysis, accounting for uncertainty in the FLW rate data and the weighting values. Treatment of uncertainty in the input-output coefficients and environmental impact coefficients is outside the scope of this study (Yang et al., 2017).
2.6.2. Distributions around parameter values
Both the FAO baseline FLW rate data and the food-nonfood proportion data are proportions bounded between 0 and 1. We modeled error around these proportions with the beta distribution, defined on the interval [0, 1]. The beta distribution has two parameters. We can express the parameters as a function of two values, a and b, as follows: Beta(ab, a(1 − b)). The mode is at b, and a is inversely proportional to the width of the peak. We use the value a = 100 for all distributions (Fig. B.2).
2.6.3. Relative uncertainty of environmental impact values
We ran a Monte Carlo uncertainty analysis to estimate the relative confidence in results among impact categories. We created 100 replicate parameter sets by taking a random draw from the beta distribution for each parameter value, for both the FAO-derived FLW rates and the food-nonfood proportions. We ran the entire analysis for each of the 100 replicates and found the 2.5% and 97.5% quantiles of the total impact values for each category across all replicates.
In addition to showing how much the results vary in magnitude when varying the input values, we also calculated how often the priority ranking swapped orders with each replicate parameter set. We considered the degree of confidence in each ranking to be the proportion of the iterations of the uncertainty analysis in which the relative rank did not change.
3. Results
3.1. Baseline environmental impacts of food loss and waste in the United States
We found that approximately 16–18% of the total environmental impact of the United States food system is associated with food that is ultimately lost or wasted (Fig. 2), across the categories of energy use, eutrophication potential, GHG warming potential, land use, and water use (blue water withdrawals). Our estimates agree reasonably well with previously published estimates (see references in Muth et al., 2019), with only our land use estimate exceeding a twofold difference from any other published estimate. Our estimates of the land use, water use, and greenhouse-warming potential of FLW were slightly higher than previous studies, while our energy use and eutrophication potential estimates were slightly lower. The disagreements could be due either to differing methodology used to estimate the total footprint of the food system, or to different estimates of the rate of FLW. It is likely that the high value we estimated for land use is because the USEEIO methodology includes grazing land and pastureland, while other estimates only include cropland.
Figure 2.
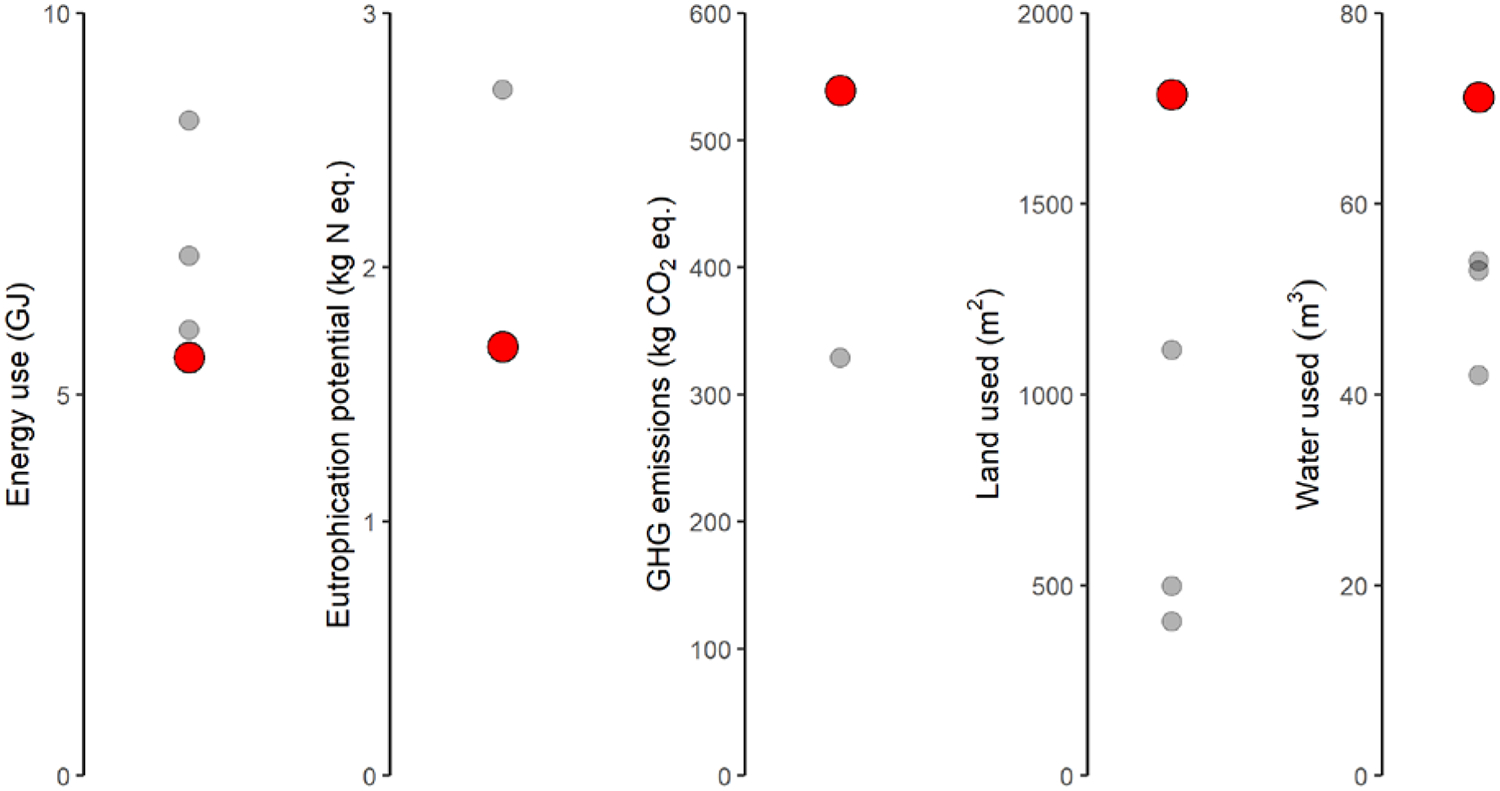
Baseline environmental impact due to lost or wasted food from the study (large red points) compared to values obtained from the literature (small gray points; references in Muth et al., 2019 and section 1.3 of this manuscript).
3.2. Effects of halving food loss and waste at each stage of the food supply chain
Halving FLW in all six stages would reduce the total environmental footprint of the food system by about 8–10% across all five impact categories (Fig. 3) if reductions in demand by the industry sectors or households that halve their rate of FLW result in equivalent decreases in production by the sectors that supply them. The bulk of the environmental impact reduction could be achieved by reducing FLW in the following three stages: food processing, foodservice, and household consumption. For example, halving FLW across those three stages would cut the total greenhouse gas emissions of the food system by 7.8%, with the remaining three stages only bringing the total reduction to 8.5% (Fig. 3). The foodservice industry and food processing industries both have high direct impacts, and the household consumption stage accounts for a large volume of final demand. In addition, both the foodservice industry and household consumption are at the final downstream point of the FSC where food is consumed. Reducing waste in the foodservice industry and in households has the potential to reduce demand for inputs from upstream stages including agricultural production and food processing.
Figure 3:
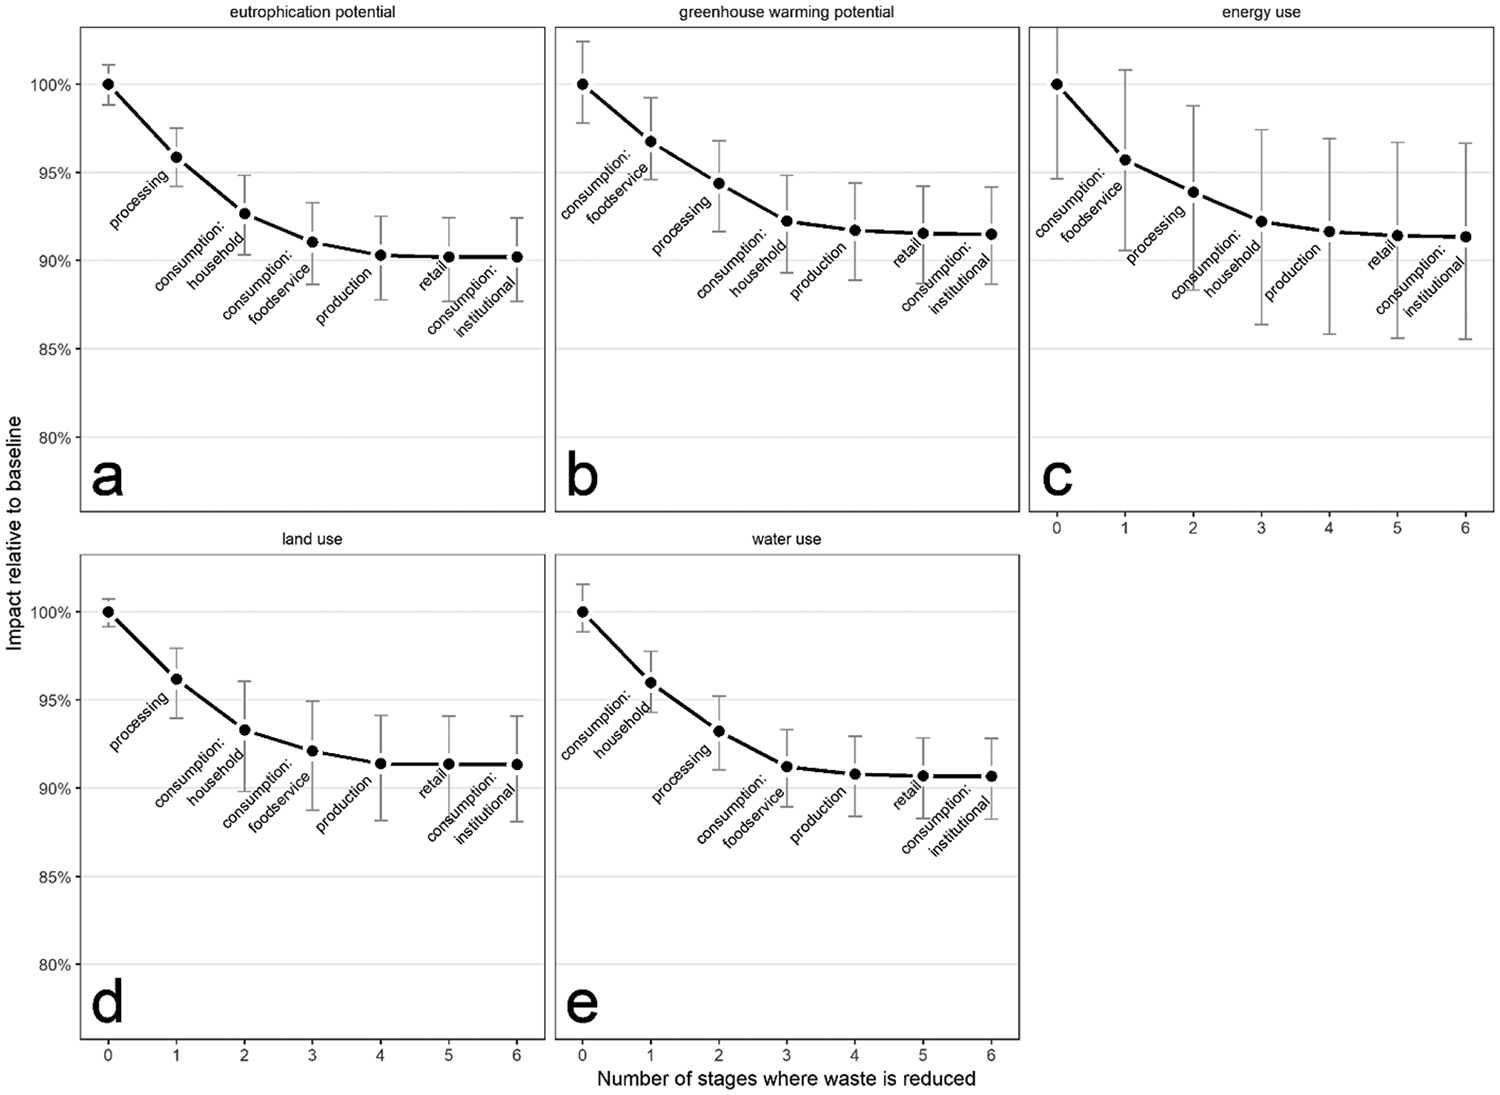
Simulated decrease in environmental impact when reducing food loss and waste rates by 50% in each of six food supply chain stages. In each panel, a different environmental impact category is targeted for minimization: a, eutrophication potential; b, greenhouse warming potential; c, energy use; d, land use; e, water use. The stage that would reduce that environmental impact metric the most is reduced first, then additional stages are reduced in sequentially decreasing order of the size of impact reduction. Each panel shows the impact expressed as a percentage of the baseline impact value. Error bars represent the 2.5 and 97.5 percentiles of impact values from a semi-qualitative sensitivity analysis; the relative width of the error bars can be compared among categories.
Reducing FLW at the remaining three stages (primary agricultural production, retail, and institutional foodservice) has little additional direct effect (Fig. 3) after accounting for the indirect effects on those three stages from reductions at the top three priority stages. The primary agricultural production stage is less influential because it is the furthest upstream. Although reducing losses at the production stage averts the direct impacts of production, reduced demand for agricultural products caused by lower waste at downstream stages has the potential to cause a much greater reduction in the resource use and emissions of agricultural production. Halving the rate of FLW in the retail stage yields a smaller impact reduction because the baseline waste rate is relatively low. Finally, the volume of food consumed in institutional foodservice establishments such as school and hospital cafeterias is much smaller than the volume consumed at households and restaurants, though it has the same baseline FLW rate. Therefore, cutting food waste at institutions has a smaller system-wide effect.
While the absolute uncertainty in the environmental impact values cannot be determined, the relative uncertainty is roughly similar for four of the five impact categories we considered, but is substantially higher for energy use (Fig. 3). Just four industries (unrefined oil and gas, electricity, coal, and refined fuels) provide the bulk (95%) of energy inputs to the FSC industries, and the relative proportions of energy input from those few industries varies highly among the FSC industries. Therefore, the energy use results are relatively more sensitive to changes in the weights assigned to the different industries. Considering the individual environmental impact categories (Fig. 3), reducing FLW in the foodservice industry would be especially important for reducing energy use and GHG warming potential. Reducing FLW in the food processing industry would maximize reduction of land use and eutrophication potential. This is because cereals and meats are wasted at a higher rate in processing than in production or retail (Table 1); livestock has a high land use requirement and cereal requires heavy fertilization (Fig. 4), contributing disproportionately to eutrophication. Household food consumption has an especially high blue water footprint, largely due to the disproportionately high rate of fresh produce waste in the home and the high water requirements of fruit and vegetable crops (Table 1; Fig. 4). When considering each food commodity group separately, the prioritization order tended to be consistent across food groups (Fig. 4; Fig. B.2). Meat and cereal grains had the highest waste-associated impacts across most categories. Household waste of fruits and vegetables represented a disproportionately high embodied water loss, and beverage waste (alcoholic drinks and soft drinks) represents a large waste of embodied GHG and energy. Finally, the relative priority ranking of the stages within each impact category was relatively insensitive to uncertainty in parameter values, with rankings remaining unchanged in at least 84% of Monte Carlo iterations across all categories (Table B.2).
Figure 4 (color figure).
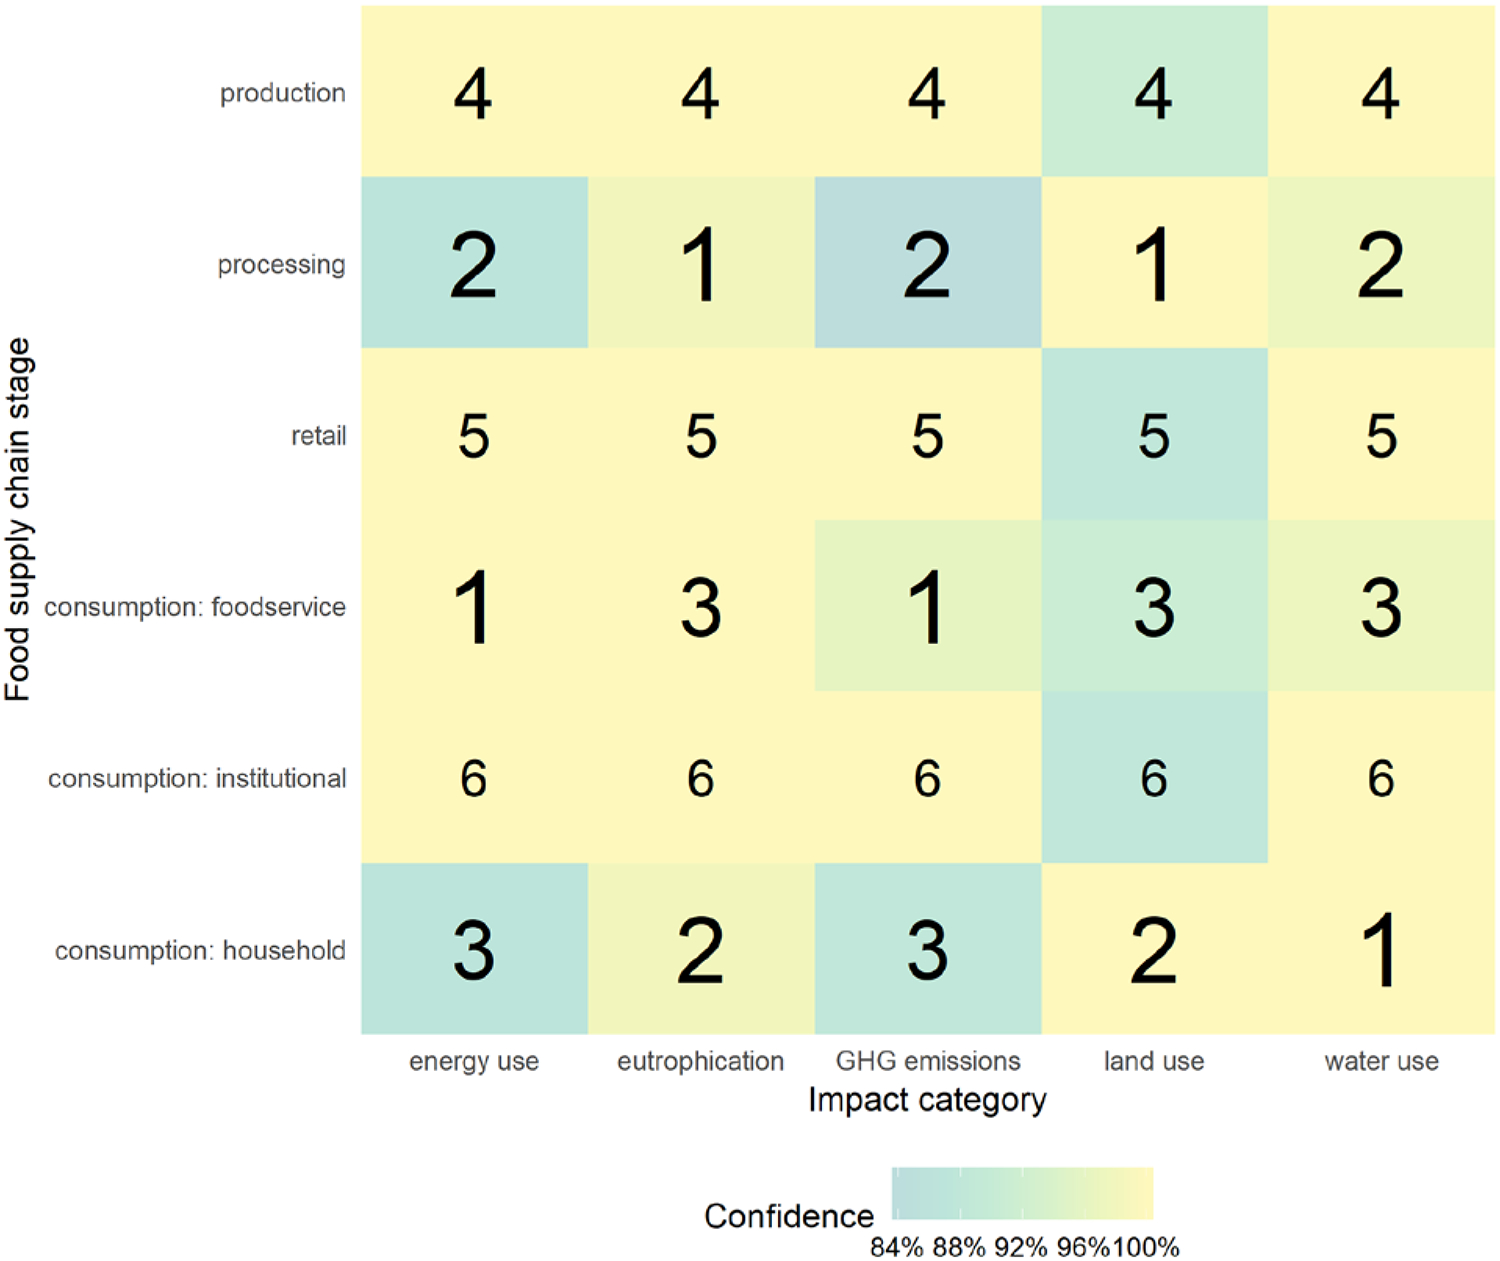
Prioritization of food supply chain stages to target for waste reduction. Rank 1 represents the highest priority stage for a given impact category (numbers are sized to emphasize ranking). The shading of each tile represents the degree of confidence in that ranking as measured by the percentage of times the ranking was unchanged in the uncertainty analysis.
4. Discussion
4.1. FLW reduction and sustainability
Transforming the food system to reduce land use and maximize the capacity of terrestrial land to absorb CO2 emissions is critical for sustainably feeding the global population and mitigating the negative effects of climate change (IPCC, 2019). FLW reduction anywhere along the supply chain has the potential to reduce food production, take pressure off agricultural land, and decrease direct GHG emissions of the food system. Furthermore, a food system with less built-in waste is not only more sustainable but also more resilient, buffering food production from the complex effects of global change (Schipanski et al., 2016). Risks of globally widespread crop losses are projected to increase with each additional degree of warming (Gaupp et al., 2019). Through increasing efficiency, reducing FLW could have beneficial outcomes for the resilience of the food system and for food security without unnecessarily enlarging the food system’s environmental footprint (West et al., 2014).
Recently, calls to transform the food system to maximize sustainability have been framed in terms of the circular economy (Ellen MacArthur Foundation, 2019; Rood et al., 2017). In the present study, we did not explicitly model interconnections among industries in which product that is prevented from being lost or wasted by one industrial process is used as input to another industry. However, we emphasize that transitioning to a circular economy in the context of FLW does not only refer to developing alternative uses for already wasted product, but also reducing the use of natural resources across the food system. FLW prevention is a key component of this transition. Below, we outline potential interventions that could contribute to FLW prevention in the priority FSC sectors we identified in this study.
4.2. Priority interventions to minimize the environmental impact of FLW
If the goal of FLW reduction is to minimize environmental impacts, efforts should be concentrated at the food processing, foodservice, and household consumption stages. At each of those three stages, there are a number of actions that could be taken to reduce FLW, including technology enhancements, policy changes to regulate the actions of processors and retailers (such as limiting organic waste disposal in landfills or facilitating donations), and behavioral interventions that directly influence consumer choices (Muth et al., 2019). It is important to note that an intervention designed to reduce FLW at one particular stage may actually be implemented at a different stage; for example, packaging or labeling changes that influence consumers to discard less food in the home would be implemented and presumably paid for by processors or retailers. In such a case, government incentives might help encourage processors or retailers to adopt the new FLW reduction technology (Katare et al., 2017).
Many possible interventions have the potential to reduce FLW. At the food processing stage, where manufacturers are already highly motivated by the desire to maximize profit, the most effective interventions are likely to be technological solutions that improve logistics or improve forecasting capability to guide proper production quantity. These interventions include improved cold chain management or direct shipments from manufacturers to retail distribution centers (ReFED, 2016).
In the foodservice industry, inventory management systems and analytics show promise for preventing FLW by optimizing the quantity of food purchases and the size of batches to prepare. Most policies aimed at reducing foodservice waste, such as an ordinance enacted in the city of San Francisco, have focused on reducing the use of non-recyclable packaging materials such as polystyrene foam containers (San Francisco Department of Environment, 2013). However, the high resource-use intensity of food wasted at foodservice establishments likely means that reducing the volume of FLW could yield greater benefits than reducing packaging.
At the household stage, achieving large reductions in FLW may be more difficult due to the large number of individual consumer decisions involved. Technological interventions implemented by manufacturers and retailers may be the most effective way to reduce household FLW. These solutions include optimization of package sizes (ReFED, 2016), standardized date labeling (Wilson et al., 2018), or smart labels that indicate freshness by changing color (Rossaint and Kreyenschmidt, 2015). Education and awareness campaigns aimed at directly influencing consumer behavior have also been piloted, such as in the U.K. by WRAP (Yamakawa et al., 2017) and in the United States (US EPA, 2016), but are very costly and have rarely been shown to have persistent effects after the end of the campaign.
The results of this study suggest which stages of the FSC are the most promising targets for waste reduction interventions. However, when evaluating specific interventions to reduce FLW, the environmental benefits should be compared to the costs of implementation (Ellison et al., 2019; Muth et al., 2019). Such a comparison must account for which individuals or institutions incur the cost of the intervention, as well as who benefits (Ellison et al., 2019). Predicting the effectiveness of interventions at national or regional scales may be difficult because most studies of FLW reduction interventions have been local in scope (Reynolds et al., 2019), and both the costs and effectiveness of individual interventions may vary regionally (US EPA, 2016).
4.3. Rebound effects
Our approach assumes that reducing FLW at a particular stage in the supply chain will propagate backward through the FSC and result in reduced production in proportion to the downstream increase in demand. In reality, efficiency gains, in this case FLW reductions by businesses or consumers, are partially offset by increased consumption of the same good (Hamilton and Richards, 2019; Rutten, 2013) or respending on other goods and services that have their own environmental footprint (Salemdeeb et al., 2017) – respectively, primary and secondary rebound effects. Most studies of FLW interventions have not adequately assessed rebound effects (Reynolds et al., 2019).
It is possible that a reduction in FLW at the downstream (consumption) end of the supply chain will initially decrease the prices of food due to decreased demand, thereby increasing some food purchases and thus subsequently increasing food production (Drabik et al., 2019). In contrast, FLW reduction at the upstream (production) end might have other consequences. If agricultural producers reduced on-farm food losses without simultaneously decreasing production, the increased amount of output they would provide to processors and consumers could potentially end up wasted further downstream along the supply chain, after incurring the additional environmental impacts associated with processing and distribution. Thus, the results presented in this paper represent an upper bound on potential impact reduction, because rebound effects and effects due to price changes would both tend to increase system-wide environmental impact.
5. Conclusion
Reducing FLW is a component of the transformations necessary to keep the food system’s impacts within planetary boundaries (Springmann et al., 2018). With growing interest in the problem, new solutions are constantly being proposed, but we know little about their potential effectiveness. This study presents a first-order estimate of the potential benefits of FLW reduction and identifies the food processing and foodservice sectors, as well as households, as the three most promising areas to target for FLW interventions. Future research will incorporate data on cost-effectiveness of specific interventions to refine the prioritization presented here. In addition, policymakers are not only responsible for reducing FLW but also for ensuring equitable access to food for everyone. We recommend that future research on FLW simultaneously address minimizing environmental impact and improving food access.
The conclusions of our study are dependent on the reliability of the baseline FLW rate data. While the rates of household and manufacturing waste provided by FAO tend to be well-supported by data, the rates for on-farm and retail losses are based on conservative assumptions or data from one or a few studies. As new data are collected (Johnson et al., 2018b), those rates may be revised upward, potentially affecting the prioritization presented in this study. In this context, we recommend that any future FLW interventions have a strong component of monitoring and data collection, enabling policymakers to identify the best candidate interventions to implement at large scale. In addition, we recommend that waste-reducing interventions be implemented at multiple stages simultaneously to minimize unwanted feedback effects in which reduced FLW at one stage leads to an oversupply of unwanted product at another. Finally, the most important goal of FLW reduction interventions should be source reduction – preventing waste from occurring in the first place. To prevent waste at the source, we must remove incentives to generate it. Currently, market conditions incentivize many stakeholders to maintain the current level of FLW produced by the food system. For example, the foodservice industry is motivated to sell large portions to customers to justify higher prices, and consumers may purchase more food than they need to reduce the frequency of shopping trips. Creating positive incentives to reduce waste at all stages of the FSC is the most important avenue to reduce the rate of food loss and waste to a sustainable level.
Supplementary Material
Appendix A: Supplemental Methods
Isolating the FSC components of the US economy
We determined whether each industry in the 389-by-389 BEA input-output table belongs to the FSC. Some of the BEA industries belong entirely to the FSC, while others represent aggregations of many smaller industries, only some of which belong to the FSC. For example, the “wholesale trade” industry aggregates food and non-food wholesale industries. We found various data sources for total revenues of the more finely resolved categories in order to assign a proportion FSC value to those aggregated industries (Supplemental Table 1). For agricultural industries (NAICS codes starting with 1), we used the 2012 annual compilation of the Quarterly Census of Employment and Wages (QCEW; https://www.bls.gov/cew) to determine the proportion of employees in each industry that are involved in food production. For example, BEA industry code 111400, “greenhouse crops, mushrooms, nurseries, and flowers,” records 21156 employees under NAICS codes associated with food crops, of a total of 144080 firms. Therefore we assigned 14.7% of its final demand to the FSC. Similarly, for the wholesale trade, general merchandise stores, other retail, and warehousing industry codes, we used the Statistics of U.S. Businesses dataset (SUSB; https://www.census.gov/programs-surveys/susb.html) to determine the proportion of employees in each industry involved in food production.
Weighting each FSC industry by composition of food groups
In order to determine the baseline FLW rate for each industry, it is necessary to determine what food commodity groups comprise it. We assumed that each FSC industry is composed of one or more food commodity groups. For agricultural industries (NAICS codes starting with 1), each industry’s output typically consisted of a single food group. Some produced multiple outputs, so we used the numbers of employees in each category taken from QCEW to assign proportions to the outputs. For example, within BEA industry code 111200, “fresh vegetables, melons, and potatoes,” 16045 people are recorded as employed in potato farming while 81046 are recorded under vegetable farming. Therefore, we assigned 16.5% of that industry to roots and tubers and 83.5% to fresh fruits and vegetables. For processing industries (NAICS codes starting with 3), if the industry’s output is assignable to a single food group, such as the processed dairy product and meat industries, we assigned the entire output to that food group. If the processed output consists of prepared foods with multiple ingredients, such as the frozen food industry, we assigned the output proportionally to the same food groups as the proportions of inputs. For the industries belonging to the foodservice and institutional stages (NAICS codes 4 and above), we also assumed the output is proportionally in the same categories as the inputs they receive from the food production and processing industries, applying additional corrections where indicated in Supplemental Table 1.
Appendix B: Results by Food Commodity Group
Meat and cereal grains had the highest potential to avert impacts by halving waste across most impact categories due to the large volumes produced (Figure B.1). In addition, meat has disproportionately high land (Figure B.2) and GHG (Figure B.3) impacts, and cereal grains require high energy (Figure B.4) and chemical (Figure B.5) inputs, leading to high eutrophication potential. Averting 50% of fresh fruits and vegetable waste, especially in households where the baseline waste rate is high, would reduce water consumption by a large amount (Figure B.6). Halving the loss and waste rate of beverages, including alcoholic drinks and soft drinks, has the potential to reduce a large amount of GHG and energy use due to the high GHG and energy intensity of beverage manufacturing (Figures B.3 and B.4).
Figure B.1.
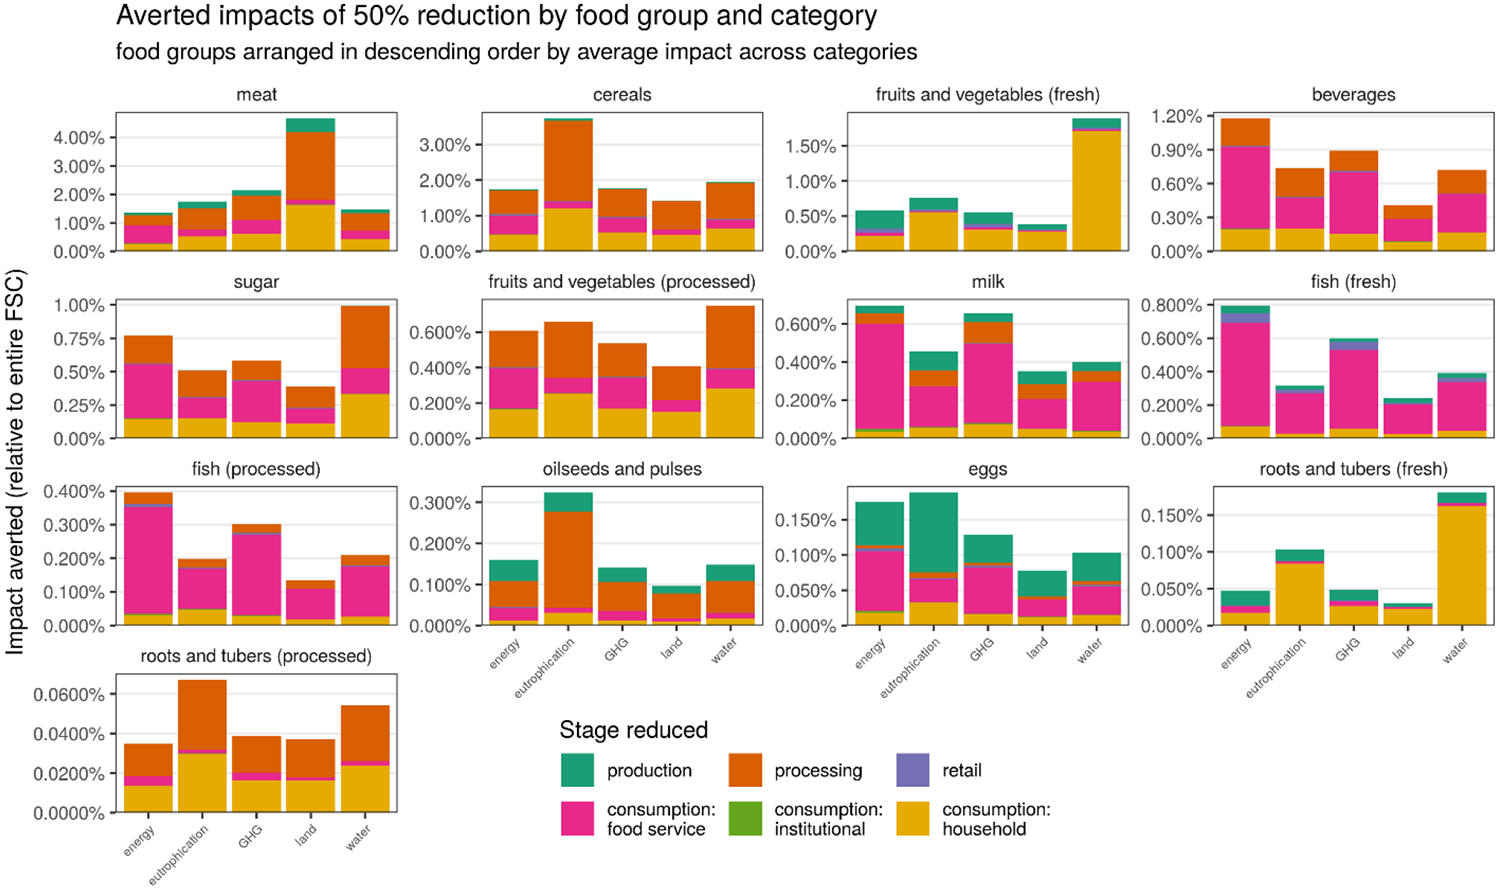
Potential averted environmental impacts assuming 50% FLW reduction in each food commodity group separately. Each panel depicts a different food commodity group, and each stacked bar includes the marginal reduction in averted impact when FLW in each stage is sequentially reduced by 50%. The percentage reductions are expressed relative to the total environmental impact of the entire food supply chain including all commodities.
Figure B.2.
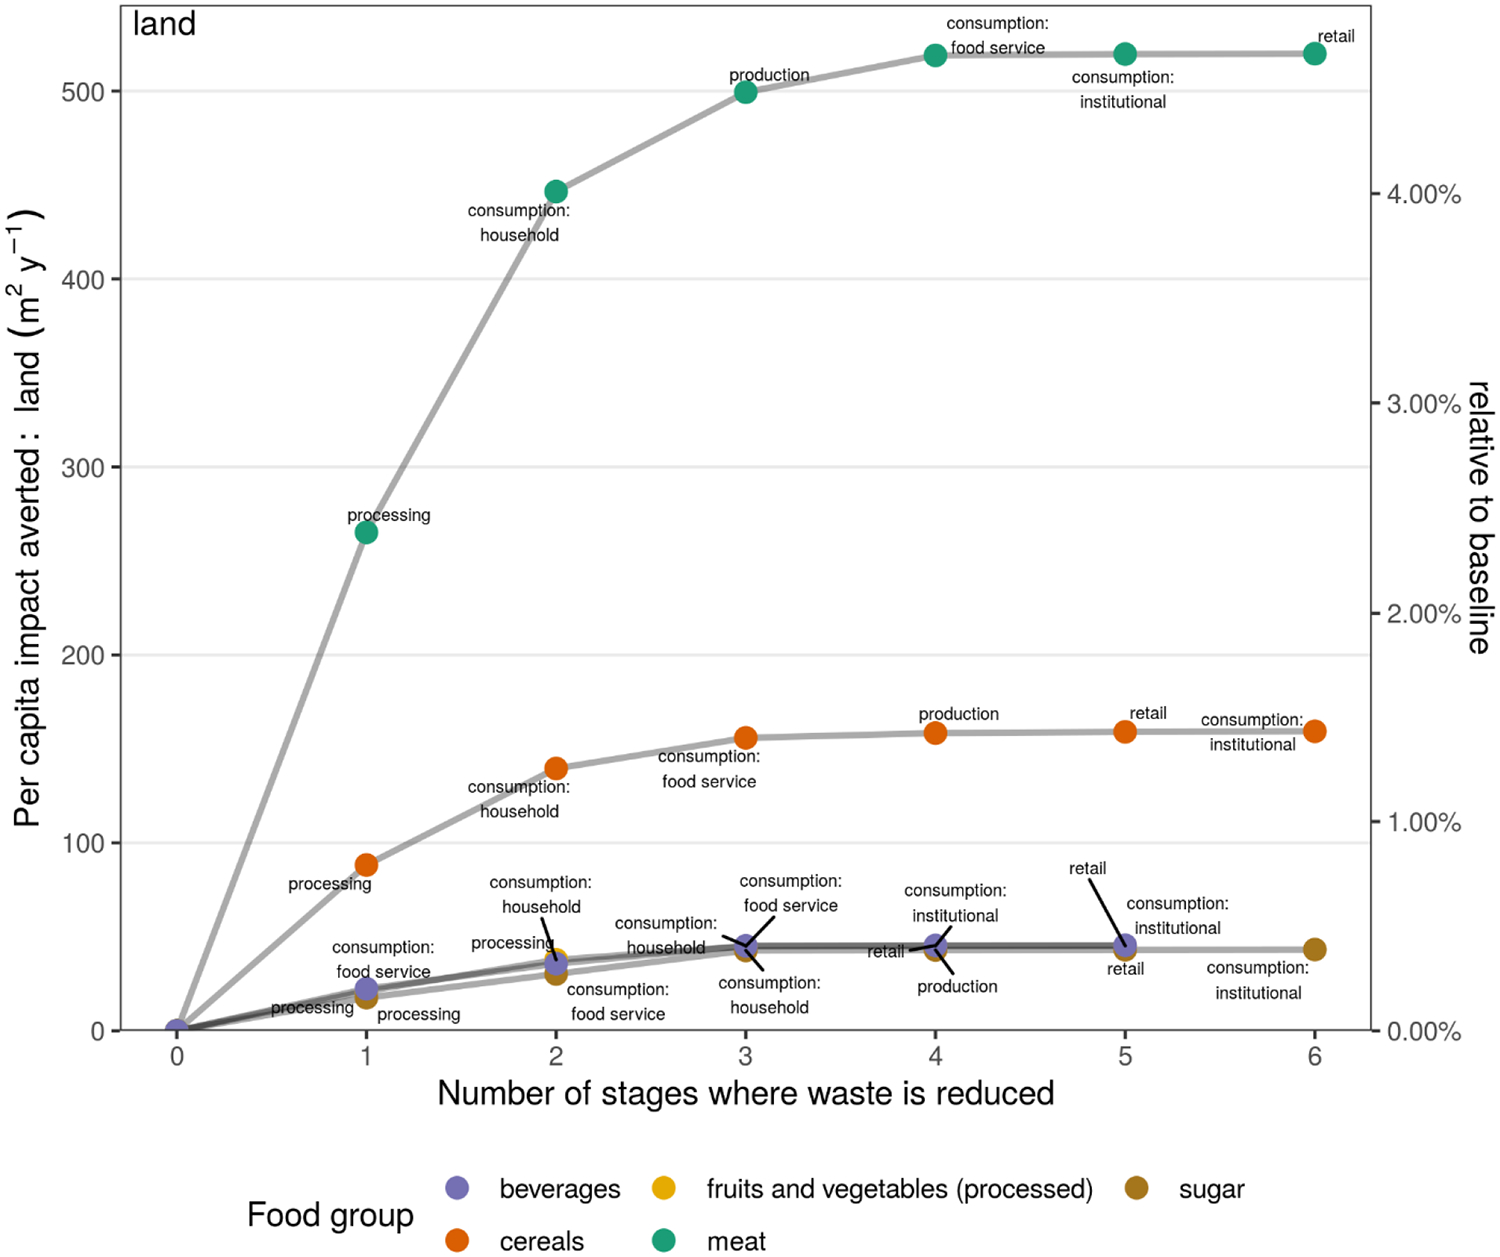
Potential averted land use impacts assuming 50% FLW reduction at each stage for each food commodity group separately. Each line shows the marginal increase in potential impact averted as FLW is reduced at one additional stage, for a single food commodity group. The five commodity groups with the largest potential averted land use impact are shown. The y-axis at left shows the result in per capita yearly impact averted in absolute units, and the y-axis at right shows the result relative to the total baseline impact of the food system, as in Figure B.1. Stages are labeled for each food commodity group to show the prioritization order for each food group; there was little variation across groups in the order of the three stages with the greatest marginal reduction.
Figure B.3.
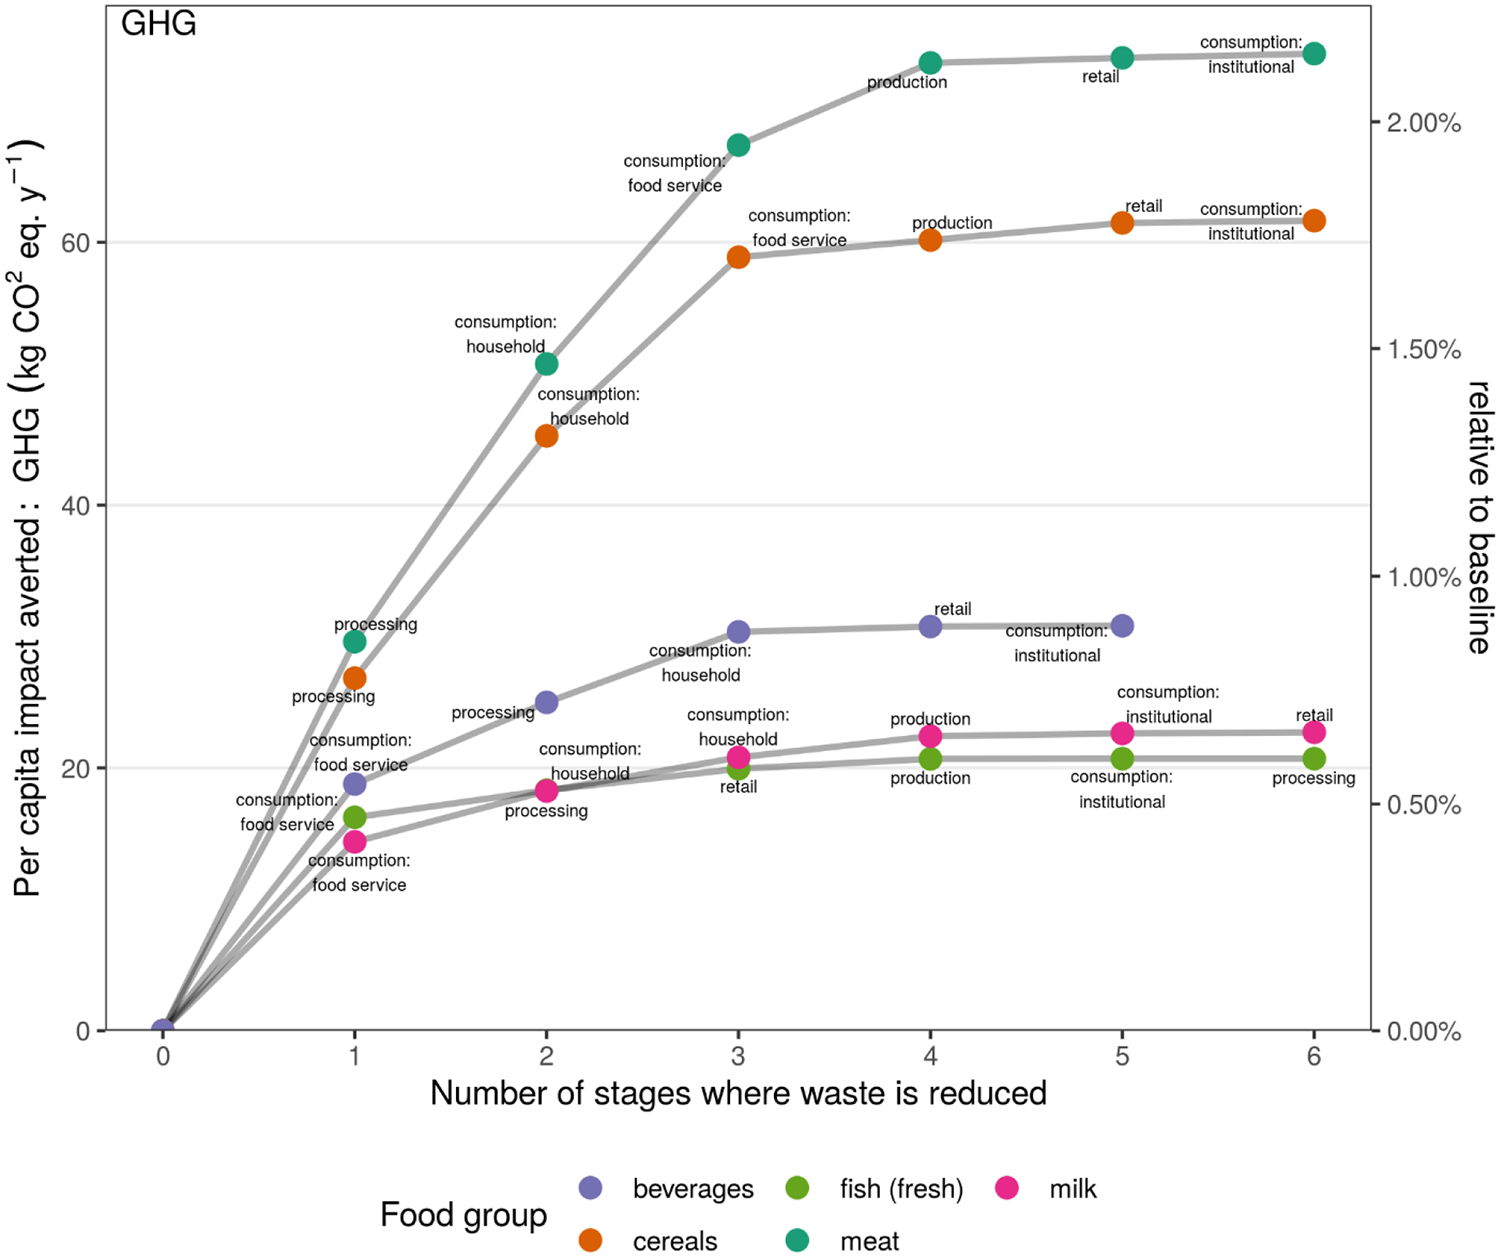
Potential averted greenhouse gas warming impacts assuming 50% FLW reduction at each stage for each food commodity group separately. See legend of Figure B.2.
Figure B.4.
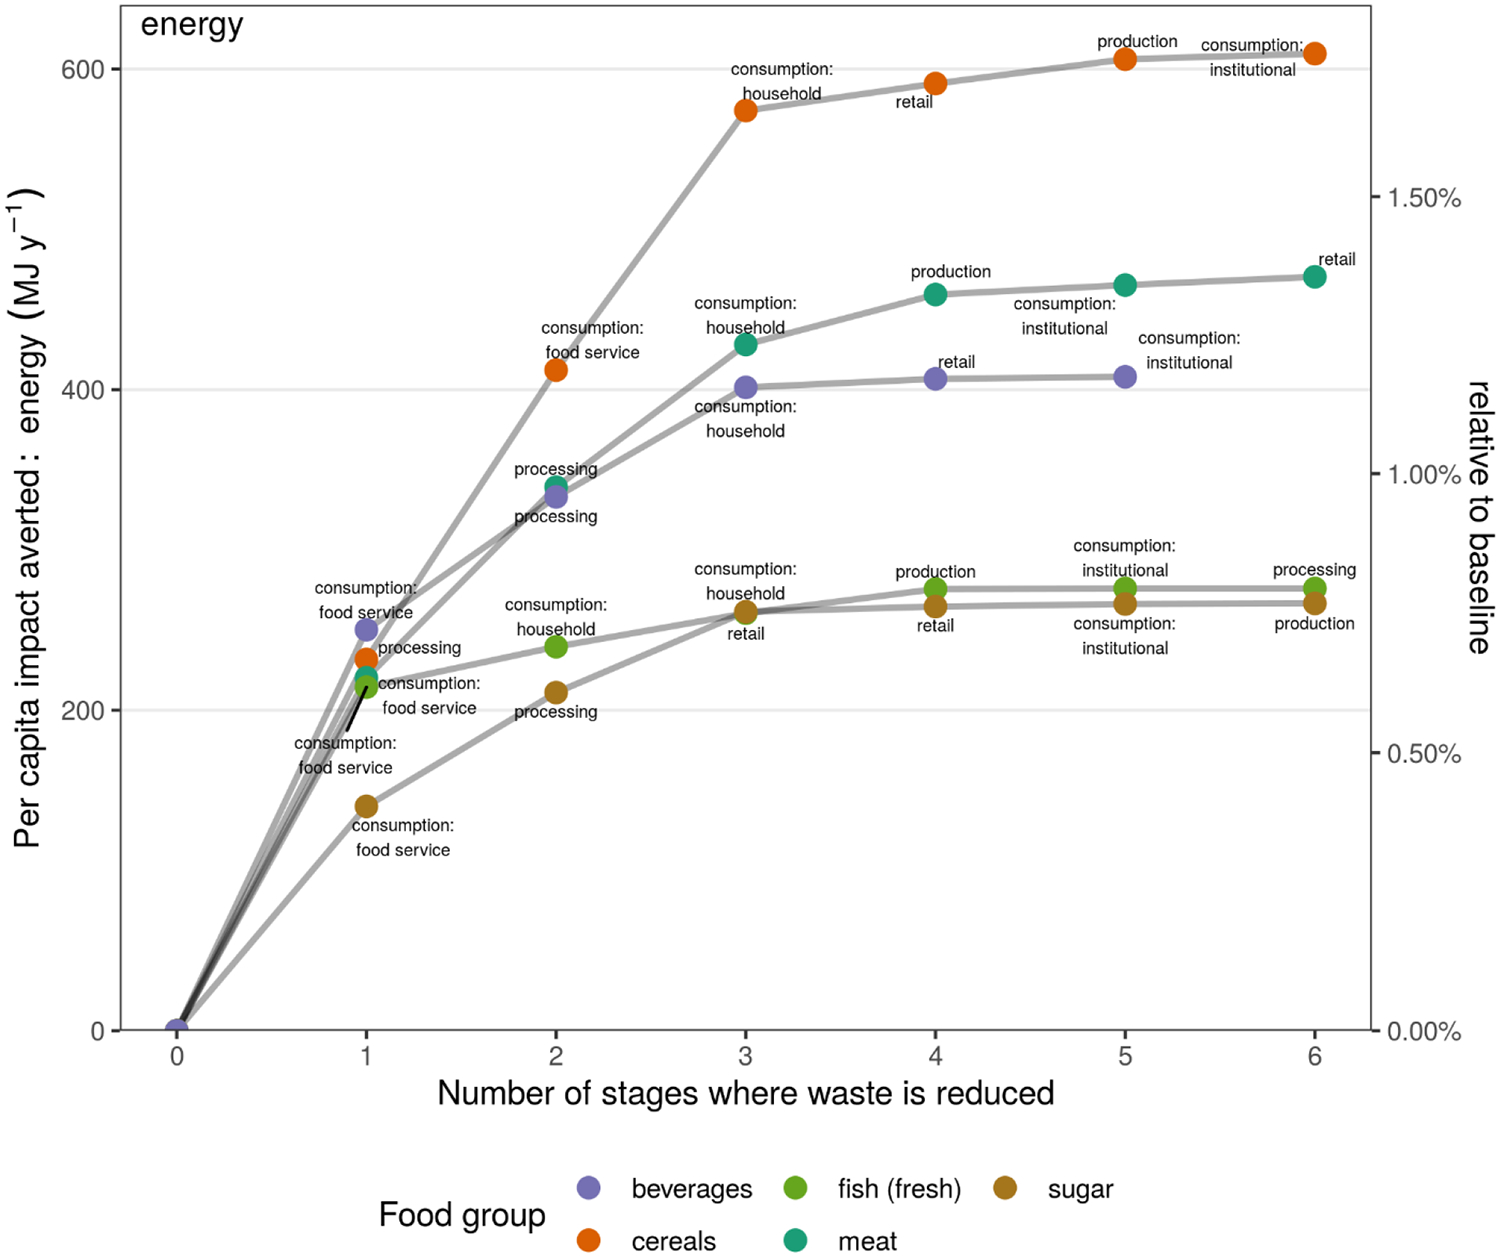
Potential averted energy use impacts assuming 50% FLW reduction at each stage for each food commodity group separately. See legend of Figure B.2.
Figure B.5.
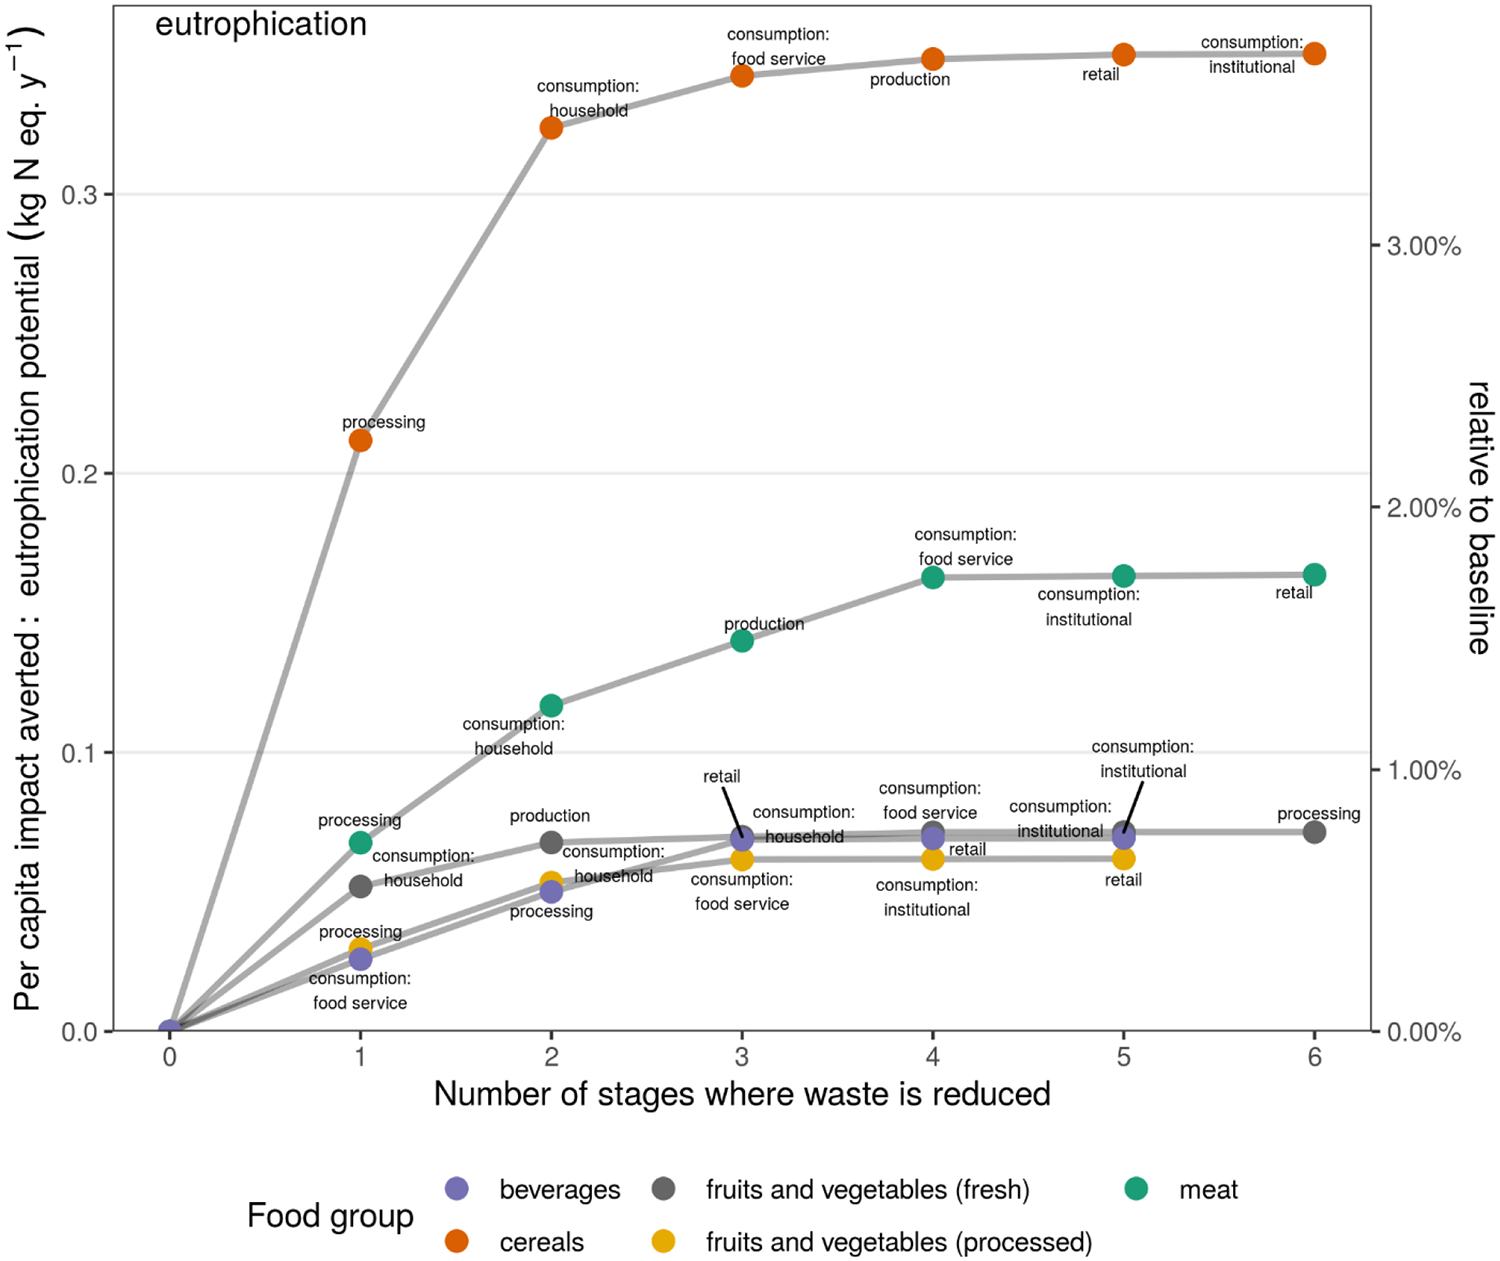
Potential averted eutrophication impacts assuming 50% FLW reduction at each stage for each food commodity group separately. See legend of Figure B.2.
Figure B.6.
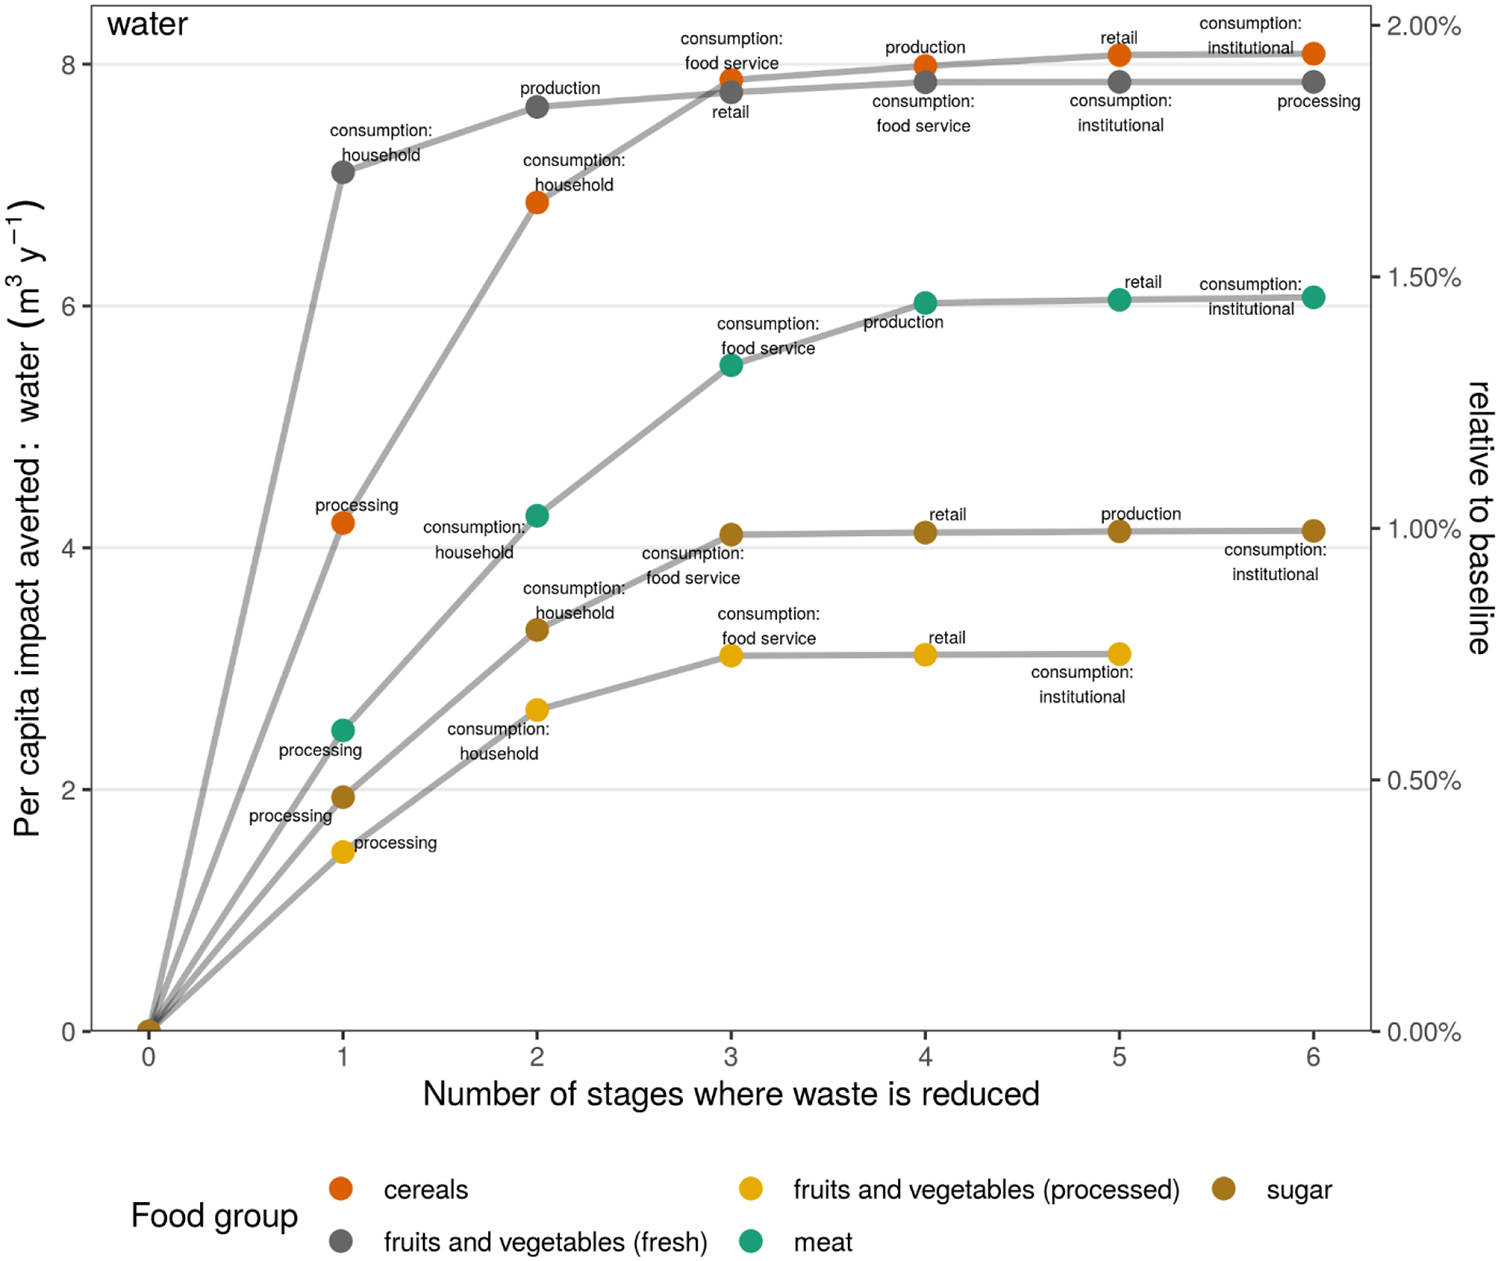
Potential averted water consumption impacts assuming 50% FLW reduction at each stage for each food commodity group separately. See legend of Supplemental Figure B.2.
Appendix C: Supplemental Tables
Table C.1.
This table contains the 76 industries out of the 389 industries included in the Bureau of Economic Analysis’ input-output tables that we identified as having at least some proportion of their output involved in the United States food system. For each of the industries, we provide the BEA code and full name, the food supply chain stage we assigned to that industry, the proportion of the industry’s output that is associated with the food system, and the relative proportion weights for each of the 13 food groups indicating what proportion of the industry’s output consists of each group. Where applicable, we provide the data source we use for the proportions (see footnotes). Some proportion output values are taken directly from the input-output table itself, assuming that the proportions of food groups in the industry’s output are equal to the input proportions. The corrections given for some of the input-output table values in level 3 industries are taken directly from the proportion weights in level 1 industries.
| BEA industry code | Industry name | Food supply chain stage | Food system proportion of industry output | Proportion industry output by food commodity group | Data source | |||||||||||||
|---|---|---|---|---|---|---|---|---|---|---|---|---|---|---|---|---|---|---|
| cereals | roots and tubers, fresh | roots and tubers, processed | oilseeds and pulses | fruits and vegetables, fresh | fruits and vegetables, processed | meat | fish, fresh | fish, processed | milk | eggs | sugar | beverages | Food supply chain proportion | Commodity proportion | ||||
| 1111A0 | Fresh soybeans, canola, flaxseeds, and other oilseeds | production | 1 | 0 | 0 | 0 | 1 | 0 | 0 | 0 | 0 | 0 | 0 | 0 | 0 | 0 | — | — |
| 1111B0 | Fresh wheat, corn, rice, and other grains | production | 1 | 1 | 0 | 0 | 0 | 0 | 0 | 0 | 0 | 0 | 0 | 0 | 0 | 0 | — | — |
| 111200 | Fresh vegetables, melons, and potatoes | production | 1 | 0 | 0.165 | 0 | 0 | 0.835 | 0 | 0 | 0 | 0 | 0 | 0 | 0 | 0 | — | a |
| 111300 | Fresh fruits and tree nuts | production | 1 | 0 | 0 | 0 | 0 | 1 | 0 | 0 | 0 | 0 | 0 | 0 | 0 | 0 | — | — |
| 111400 | Greenhouse crops, mushrooms, nurseries, and flowers | production | 0.147 | 0 | 0 | 0 | 0 | 1 | 0 | 0 | 0 | 0 | 0 | 0 | 0 | 0 | a | — |
| 111900 | Tobacco, cotton, sugarcane, peanuts, sugar beets, herbs and spices, and other crops | production | 0.115 | 0 | 0 | 0 | 0 | 0.147 | 0 | 0 | 0 | 0 | 0 | 0 | 0.853 | 0 | a | a |
| 112120 | Dairies | production | 1 | 0 | 0 | 0 | 0 | 0 | 0 | 0 | 0 | 0 | 1 | 0 | 0 | 0 | — | — |
| 1121A0 | Cattle ranches and feedlots | production | 1 | 0 | 0 | 0 | 0 | 0 | 0 | 1 | 0 | 0 | 0 | 0 | 0 | 0 | — | — |
| 112300 | Poultry farms | production | 1 | 0 | 0 | 0 | 0 | 0 | 0 | 0.302 | 0 | 0 | 0 | 0.698 | 0 | 0 | — | a |
| 112A00 | Animal farms and aquaculture ponds (except cattle and poultry) | production | 0.365 | 0 | 0 | 0 | 0 | 0 | 0 | 0.094 | 0.596 | 0 | 0.044 | 0 | 0.265 | 0 | a | a |
| 114000 | Wild-caught fish and game | production | 0.757 | 0 | 0 | 0 | 0 | 0 | 0 | 0 | 1 | 0 | 0 | 0 | 0 | 0 | a | a |
| 311210 | Flours and malts | processing | 1 | 1 | 0 | 0 | 0 | 0 | 0 | 0 | 0 | 0 | 0 | 0 | 0 | 0 | — | — |
| 311221 | Corn products | processing | 1 | 0.99 | 0 | 0 | 0.01 | 0 | 0 | 0 | 0 | 0 | 0 | 0 | 0 | 0 | — | c, d |
| 311225 | Refined vegetable, olive, and seed oils | processing | 1 | 0.448 | 0 | 0 | 0.478 | 0 | 0.074 | 0 | 0 | 0 | 0 | 0 | 0 | 0 | — | c, d |
| 31122A | Vegetable oils and by-products | processing | 1 | 0.006 | 0 | 0 | 0.968 | 0 | 0.026 | 0 | 0 | 0 | 0 | 0 | 0 | 0 | — | c, d |
| 311230 | Breakfast cereals | processing | 1 | 0.892 | 0 | 0 | 0 | 0 | 0.108 | 0 | 0 | 0 | 0 | 0 | 0 | 0 | — | c, d |
| 311300 | Sugar, candy, and chocolate | processing | 1 | 0 | 0 | 0 | 0 | 0 | 0.404 | 0 | 0 | 0 | 0 | 0.054 | 0.542 | 0 | — | c, d |
| 311410 | Frozen food | processing | 1 | 0.723 | 0 | 0.019 | 0 | 0 | 0.221 | 0 | 0 | 0.014 | 0 | 0.024 | 0 | 0 | — | c, e |
| 311420 | Fruit and vegetable preservation | processing | 1 | 0.075 | 0 | 0.018 | 0 | 0 | 0.742 | 0 | 0 | 0.15 | 0 | 0.013 | 0 | 0 | — | c, e |
| 311513 | Cheese | processing | 1 | 0 | 0 | 0 | 0 | 0 | 0 | 0 | 0 | 0 | 1 | 0 | 0 | 0 | — | — |
| 311514 | Dry, condensed, and evaporated dairy | processing | 1 | 0 | 0 | 0 | 0 | 0 | 0 | 0 | 0 | 0 | 1 | 0 | 0 | 0 | — | — |
| 31151A | Fluid milk and butter | processing | 1 | 0 | 0 | 0 | 0 | 0 | 0 | 0 | 0 | 0 | 1 | 0 | 0 | 0 | — | — |
| 311520 | Ice cream and frozen desserts | processing | 1 | 0 | 0 | 0 | 0 | 0 | 0.293 | 0 | 0 | 0 | 0.499 | 0.206 | 0.002 | 0 | — | — |
| 311615 | Packaged poultry | processing | 1 | 0 | 0 | 0 | 0 | 0 | 0 | 1 | 0 | 0 | 0 | 0 | 0 | 0 | — | — |
| 31161A | Packaged meat (except poultry) | processing | 1 | 0 | 0 | 0 | 0 | 0 | 0 | 1 | 0 | 0 | 0 | 0 | 0 | 0 | — | — |
| 311700 | Seafood | processing | 1 | 0 | 0 | 0 | 0 | 0 | 0 | 0 | 0 | 1 | 0 | 0 | 0 | 0 | — | — |
| 311810 | Bread and other baked goods | processing | 1 | 0.811 | 0 | 0 | 0 | 0 | 0.06 | 0 | 0 | 0 | 0 | 0.13 | 0 | 0 | — | c, d |
| 3118A0 | Cookies, crackers, pastas, and tortillas | processing | 1 | 0.526 | 0 | 0 | 0 | 0 | 0.178 | 0 | 0 | 0 | 0 | 0.292 | 0.004 | 0 | — | c, d |
| 311910 | Snack foods | processing | 1 | 0.215 | 0 | 0.003 | 0.041 | 0 | 0.397 | 0.003 | 0 | 0 | 0 | 0 | 0.294 | 0 | — | c, e, f |
| 311920 | Coffee and tea | processing | 1 | 0 | 0 | 0 | 0 | 0 | 0 | 0 | 0 | 0 | 0 | 0 | 0 | 1 | — | — |
| 311930 | Flavored drink concentrates | processing | 1 | 0 | 0 | 0 | 0 | 0 | 0 | 0 | 0 | 0 | 0 | 0 | 0 | 1 | — | — |
| 311940 | Seasonings and dressings | processing | 1 | 0 | 0 | 0.006 | 0.008 | 0 | 0.3 | 0.015 | 0 | 0 | 0 | 0.116 | 0.554 | 0 | — | c, f |
| 311990 | All other foods | processing | 1 | 0.195 | 0 | 0.019 | 0.001 | 0 | 0.455 | 0.111 | 0 | 0 | 0.061 | 0.064 | 0.005 | 0 | — | c, f |
| 312110 | Soft drinks, bottled water, and ice | processing | 1 | 0 | 0 | 0 | 0 | 0 | 0 | 0 | 0 | 0 | 0 | 0 | 0 | 1 | — | — |
| 312120 | Breweries and beer | processing | 1 | 0 | 0 | 0 | 0 | 0 | 0 | 0 | 0 | 0 | 0 | 0 | 0 | 1 | — | — |
| 312130 | Wineries and wine | processing | 1 | 0 | 0 | 0 | 0 | 0 | 0 | 0 | 0 | 0 | 0 | 0 | 0 | 1 | — | — |
| 312140 | Distilleries and spirits | processing | 1 | 0 | 0 | 0 | 0 | 0 | 0 | 0 | 0 | 0 | 0 | 0 | 0 | 1 | — | — |
| 420000 | Wholesale trade | retail | 0.104 | 0.32 | 0 | 0 | 0.346 | 0.013 | 0.012 | 0.154 | 0.024 | 0 | 0.092 | 0.004 | 0.012 | 0.023 | b | c, d |
| 452000 | General merchandise stores | retail | 0.209 | 0.534 | 0 | 0.001 | 0.07 | 0.003 | 0.052 | 0.063 | 0.001 | 0.015 | 0.136 | 0.043 | 0.043 | 0.039 | b | c, d |
| 4A0000 | Other retail | retail | 0.170 | 0.056 | 0.001 | 0 | 0.003 | 0.268 | 0.045 | 0.115 | 0 | 0.07 | 0.27 | 0.019 | 0.022 | 0.13 | b | c, d |
| 493000 | Warehousing | retail | 0.092 | 0.32 | 0 | 0 | 0.346 | 0.013 | 0.012 | 0.154 | 0.024 | 0 | 0.092 | 0.004 | 0.012 | 0.023 | b | c, d |
| 445000 | Food and beverage stores | retail | 1 | 0.44 | 0.001 | 0 | 0.021 | 0.09 | 0.035 | 0.051 | 0.133 | 0.027 | 0.1 | 0.038 | 0.013 | 0.05 | — | c, d |
| 722110 | Full-service restaurants | foodservice | 1 | 0.066 | 0.001 | 0.002 | 0.015 | 0.007 | 0.079 | 0.195 | 0.089 | 0.101 | 0.115 | 0.019 | 0.036 | 0.276 | — | c, d |
| 722211 | Limited-service restaurants | foodservice | 1 | 0.062 | 0.001 | 0.001 | 0.016 | 0.004 | 0.075 | 0.199 | 0.049 | 0.107 | 0.124 | 0.02 | 0.042 | 0.299 | — | c, d |
| 722A00 | All other food and drinking places | foodservice | 1 | 0.062 | 0.001 | 0.001 | 0.112 | 0.005 | 0.07 | 0.123 | 0.043 | 0.094 | 0.118 | 0.012 | 0.032 | 0.326 | — | c, d |
| 481000 | Air transport | foodservice | 0.003 | 0.01 | 0 | 0 | 0 | 0 | 0.001 | 0 | 0 | 0.258 | 0 | 0.002 | 0 | 0.73 | c, d | c, d |
| 482000 | Rail transport | foodservice | 0.007 | 0.226 | 0 | 0.003 | 0.043 | 0 | 0.417 | 0.003 | 0 | 0 | 0 | 0 | 0.308 | 0 | c, d | c, d |
| 483000 | Water transport (boats, ships, ferries) | foodservice | 0.012 | 0.07 | 0 | 0.001 | 0.001 | 0 | 0.065 | 0.09 | 0 | 0.28 | 0.078 | 0.018 | 0.032 | 0.363 | c, d | c, d |
| 484000 | Truck transport | foodservice | 0.022 | 0.034 | 0 | 0 | 0 | 0 | 0.002 | 0 | 0 | 0.333 | 0 | 0.005 | 0 | 0.625 | c, d | c, d |
| 485000 | Passenger ground transport | foodservice | 0.011 | 0.226 | 0 | 0.003 | 0.043 | 0 | 0.417 | 0.003 | 0 | 0 | 0 | 0 | 0.308 | 0 | c, d | c, d |
| 48A000 | Scenic and sightseeing transportation and support activities for transportation | foodservice | 0.007 | 0.011 | 0.07 | 0 | 0 | 0.453 | 0.013 | 0.041 | 0.152 | 0.02 | 0.016 | 0.006 | 0.081 | 0.137 | c, d | c, d |
| 512100 | Movies and film | foodservice | 0.001 | 0 | 0 | 0 | 0 | 0 | 0.231 | 0 | 0 | 0.214 | 0 | 0.031 | 0.31 | 0.214 | c, d | c, d |
| 711100 | Performances | foodservice | 0.003 | 0.059 | 0 | 0 | 0.004 | 0 | 0.041 | 0.144 | 0 | 0.048 | 0.335 | 0.006 | 0.028 | 0.335 | c, d | c, d |
| 711200 | Sports | foodservice | 0.027 | 0.159 | 0 | 0.013 | 0.002 | 0 | 0.322 | 0.15 | 0 | 0.031 | 0.15 | 0.047 | 0.019 | 0.107 | c, d | c, d |
| 711A00 | Promoters and agents | foodservice | 0.006 | 0.065 | 0 | 0 | 0.003 | 0 | 0.039 | 0.179 | 0 | 0.085 | 0.298 | 0.01 | 0.032 | 0.289 | c, d | c, d |
| 712000 | Museums, historical sites, zoos, and parks | foodservice | 0.010 | 0.055 | 0 | 0 | 0.002 | 0 | 0.025 | 0.179 | 0 | 0.125 | 0.233 | 0.007 | 0.016 | 0.358 | c, d | c, d |
| 713100 | Amusement parks and arcades | foodservice | 0.112 | 0.041 | 0 | 0.002 | 0.001 | 0.009 | 0.059 | 0.189 | 0.029 | 0.034 | 0.105 | 0.011 | 0.014 | 0.504 | c, d | c, d |
| 713200 | Gambling establishments (except casino hotels) | foodservice | 0.031 | 0.044 | 0 | 0.001 | 0.002 | 0.029 | 0.037 | 0.116 | 0.051 | 0.056 | 0.073 | 0.012 | 0.05 | 0.531 | c, d | c, d |
| 713900 | Golf courses, marinas, ski resorts, fitness and other rec centers and industries | foodservice | 0.047 | 0.056 | 0 | 0.002 | 0.001 | 0.004 | 0.065 | 0.12 | 0.085 | 0.074 | 0.111 | 0.012 | 0.036 | 0.434 | c, d | c, d |
| 721000 | Hotels and campgrounds | foodservice | 0.051 | 0.068 | 0 | 0.001 | 0.059 | 0.001 | 0.051 | 0.189 | 0.052 | 0.122 | 0.059 | 0.017 | 0.039 | 0.341 | c, d | c, d |
| 611100 | Elementary and secondary schools | institutional | 0.114 | 0.054 | 0.003 | 0.004 | 0.004 | 0.019 | 0.179 | 0.146 | 0.049 | 0.086 | 0.414 | 0.014 | 0.006 | 0.021 | c, d | c, d |
| 611A00 | Colleges, universities, junior colleges, and professional schools | institutional | 0.077 | 0.123 | 0.001 | 0.002 | 0.021 | 0.007 | 0.091 | 0.229 | 0.002 | 0.095 | 0.119 | 0.034 | 0.043 | 0.233 | c, d | c, d |
| 611B00 | Other educational services | institutional | 0.003 | 0.123 | 0.001 | 0.002 | 0.021 | 0.007 | 0.091 | 0.229 | 0.002 | 0.095 | 0.119 | 0.034 | 0.043 | 0.233 | c, d | c, d |
| 622000 | Hospitals | institutional | 0.030 | 0.034 | 0 | 0.002 | 0.001 | 0 | 0.083 | 0.361 | 0 | 0.202 | 0.149 | 0.024 | 0.025 | 0.121 | c, d | c, d |
| 623A00 | Nursing and community care facilities | institutional | 0.068 | 0.105 | 0 | 0.004 | 0.002 | 0 | 0.142 | 0.459 | 0 | 0.067 | 0.125 | 0.031 | 0.04 | 0.026 | c, d | c, d |
| 623B00 | Residential mental retardation, mental health, substance abuse and other facilities | institutional | 0.108 | 0.067 | 0 | 0.002 | 0.001 | 0 | 0.1 | 0.561 | 0 | 0.13 | 0.057 | 0.031 | 0.009 | 0.043 | c, d | c, d |
| 624100 | Individual and family services | institutional | 0.060 | 0.147 | 0 | 0.002 | 0.003 | 0 | 0.083 | 0.46 | 0 | 0.104 | 0.033 | 0.04 | 0.031 | 0.097 | c, d | c, d |
| 624400 | Child day care | institutional | 0.161 | 0.084 | 0 | 0.003 | 0 | 0 | 0.151 | 0.215 | 0 | 0.02 | 0.475 | 0.04 | 0.012 | 0 | c, d | c, d |
| 624A00 | Community food, housing, and other relief services, including rehabilitation services | institutional | 0.145 | 0.051 | 0 | 0.001 | 0.001 | 0 | 0.025 | 0.767 | 0 | 0.066 | 0.016 | 0.015 | 0.012 | 0.046 | c, d | c, d |
| 813100 | Religious organizations | institutional | 0.013 | 0.103 | 0.001 | 0.003 | 0 | 0.043 | 0.099 | 0.147 | 0.061 | 0.116 | 0.247 | 0.016 | 0.002 | 0.162 | c, d | c, d |
| 813A00 | Grantmaking, giving, and social advocacy organizations | institutional | 0.003 | 0.043 | 0 | 0 | 0 | 0 | 0.003 | 0 | 0 | 0.447 | 0 | 0.007 | 0 | 0.5 | c, d | c, d |
| 813B00 | Civic, social, professional, and similar organizations | institutional | 0.030 | 0.107 | 0 | 0.002 | 0.002 | 0.007 | 0.09 | 0.113 | 0.051 | 0.097 | 0.071 | 0.026 | 0.054 | 0.38 | c, d | c, d |
| S00102 | Other federal government enterprises | institutional | 0.038 | 0.134 | 0 | 0.005 | 0.001 | 0 | 0.156 | 0.245 | 0.013 | 0.087 | 0.166 | 0.02 | 0.03 | 0.142 | c, d | c, d |
| S00203 | Other state and local government enterprises | institutional | 0.003 | 0.073 | 0.001 | 0.003 | 0.01 | 0.05 | 0.133 | 0.264 | 0.009 | 0.13 | 0.166 | 0.027 | 0.034 | 0.101 | c, d | c, d |
| S00500 | Federal general government (defense) | institutional | 0.016 | 0.06 | 0 | 0.001 | 0.001 | 0 | 0.055 | 0.66 | 0.001 | 0.071 | 0.097 | 0.01 | 0.023 | 0.022 | c, d | c, d |
| S00700 | State and local general government | institutional | 0.065 | 0.073 | 0.001 | 0.003 | 0.01 | 0.05 | 0.133 | 0.264 | 0.009 | 0.13 | 0.166 | 0.027 | 0.034 | 0.101 | c, d | c, d |
Data source footnotes
Quarterly Census of Employment and Wages (QCEW, U.S. Bureau of Labor Statistics)
Statistics of United States Businesses (SUSB, U.S. Census Bureau)
Input-output table (U.S. Bureau of Economic Analysis)
Proportions assuming that relative inputs from upstream industries are equal to relative outputs
Internal correction of proportions made from BEA industry 111200: 16.5% roots and tubers, 83.5% fruits and vegetables
Internal correction of proportions made from BEA industry 111900: 14.7% fruits and vegetables (peanuts), 85.3% sugar
Table C.2.
Results of uncertainty analysis. For each environmental impact category and food supply chain stage, the true rank is the prioritization ranking calculated from the original parameter set, mean rank is the average prioritization ranking across all Monte Carlo draws of parameter sets, and percent not swapped refers to the percentage of draws in which the ranking was the same as the true ranking, representing a relative degree of confidence in the rank value.
| Category | Stage | True Rank | Mean Rank | Percent Not Swapped |
|---|---|---|---|---|
| eutrophication | processing | 1 | 1.02 | 98% |
| consumption: household | 2 | 1.98 | 98% | |
| consumption: food service | 3 | 3 | 100% | |
| production | 4 | 4 | 100% | |
| retail | 5 | 5 | 100% | |
| consumption: institutional | 6 | 6 | 100% | |
| GHG emissions | consumption: food service | 1 | 1.04 | 96% |
| processing | 2 | 2.08 | 84% | |
| consumption: household | 3 | 2.88 | 88% | |
| production | 4 | 4 | 100% | |
| retail | 5 | 5 | 100% | |
| consumption: institutional | 6 | 6 | 100% | |
| energy use | consumption: food service | 1 | 1 | 100% |
| processing | 2 | 2.13 | 87% | |
| consumption: household | 3 | 2.87 | 87% | |
| production | 4 | 4 | 100% | |
| retail | 5 | 5 | 100% | |
| consumption: institutional | 6 | 6 | 100% | |
| land use | processing | 1 | 1 | 100% |
| consumption: household | 2 | 2 | 100% | |
| consumption: food service | 3 | 3.09 | 91% | |
| production | 4 | 3.91 | 91% | |
| retail | 5 | 5.12 | 88% | |
| consumption: institutional | 6 | 5.88 | 88% | |
| water use | consumption: household | 1 | 1 | 100% |
| processing | 2 | 2.03 | 97% | |
| consumption: food service | 3 | 2.97 | 97% | |
| production | 4 | 4 | 100% | |
| retail | 5 | 5 | 100% | |
| consumption: institutional | 6 | 6 | 100% |
Works Cited
- Association of Washington Cities, 2019. Bill sets new state goal for food waste reduction [WWW Document]. URL https://wacities.org/advocacy/News/advocacy-news/2019/04/13/bill-sets-new-state-goal-for-food-waste-reduction (accessed 8.23.19).
- Beretta C, Stucki M, Hellweg S, 2017. Environmental impacts and hotspots of food losses: value chain analysis of Swiss food consumption. Environ. Sci. Technol 51, 11165–11173. 10.1021/acs.est.6b06179 [DOI] [PubMed] [Google Scholar]
- Birney CI, Franklin KF, Davidson FT, Webber ME, 2017. An assessment of individual foodprints attributed to diets and food waste in the United States. Environmental Research Letters 12, 105008 10.1088/1748-9326/aa8494 [DOI] [Google Scholar]
- Buzby JC, Farah-Wells H, Hyman J, 2014. The estimated amount, value, and calories of postharvest food losses at the retail and consumer levels in the United States. SSRN Electronic Journal. 10.2139/ssrn.2501659 [DOI] [Google Scholar]
- Chaudhary A, Kastner T, 2016. Land use biodiversity impacts embodied in international food trade. Global Environmental Change 38, 195–204. 10.1016/j.gloenvcha.2016.03.013 [DOI] [Google Scholar]
- Cuéllar AD, Webber ME, 2010. Wasted food, wasted energy: the embedded energy in food waste in the United States. Environ. Sci. Technol 44, 6464–6469. 10.1021/es100310d [DOI] [PMC free article] [PubMed] [Google Scholar]
- Drabik D, de Gorter H, Reynolds C, 2019. A conceptual and empirical framework to analyze the economics of consumer food waste. Resources, Conservation and Recycling 149, 500–509. 10.1016/j.resconrec.2019.06.008 [DOI] [Google Scholar]
- Ellen MacArthur Foundation, 2019. Cities and Circular Economy for Food.
- Ellison B, Muth MK, Golan E, 2019. Opportunities and Challenges in Conducting Economic Research on Food Loss and Waste. Appl Econ Perspect Policy 41, 1–19. 10.1093/aepp/ppy035 [DOI] [Google Scholar]
- Garrone P, Melacini M, Perego A, 2014. Opening the black box of food waste reduction. Food Policy 46, 129–139. 10.1016/j.foodpol.2014.03.014 [DOI] [Google Scholar]
- Gustavsson J, Cederberg C, Sonesson U, 2013. The methodology of the FAO study: “Global Food Losses and Food Waste - extent, causes and prevention”- FAO, 201 70.
- Gustavsson J, Cederberg C, Sonesson U, 2011. Global food losses and food waste: extent, causes and prevention ; study conducted for the International Congress Save Food! at Interpack 2011, [16 – 17 May], Düsseldorf, Germany. Food and Agriculture Organization of the United Nations, Rome. [Google Scholar]
- Hall KD, Guo J, Dore M, Chow CC, 2009. The progressive increase of food waste in America and its environmental impact. PLoS ONE 4, e7940 10.1371/journal.pone.0007940 [DOI] [PMC free article] [PubMed] [Google Scholar]
- Hamilton SF, Richards TJ, 2019. Food policy and household food waste. Am J Agric Econ 101, 600–614. 10.1093/ajae/aay109 [DOI] [Google Scholar]
- IPCC, 2019. Climate Change and Land: An IPCC Special Report on climate change, desertification, land degradation, sustainable land management, food security, and greenhouse gas fluxes in terrestrial ecosystems.
- Jedermann R, Nicometo M, Uysal I, Lang W, 2014. Reducing food losses by intelligent food logistics. Philosophical Transactions of the Royal Society A: Mathematical, Physical and Engineering Sciences 372, 20130302–20130302. 10.1098/rsta.2013.0302 [DOI] [PMC free article] [PubMed] [Google Scholar]
- Johnson LK, Dunning RD, Bloom JD, Gunter CC, Boyette MD, Creamer NG, 2018a. Estimating on-farm food loss at the field level: A methodology and applied case study on a North Carolina farm. Resources, Conservation and Recycling 137, 243–250. 10.1016/j.resconrec.2018.05.017 [DOI] [Google Scholar]
- Johnson LK, Dunning RD, Gunter CC, Dara Bloom J, Boyette MD, Creamer NG, 2018b. Field measurement in vegetable crops indicates need for reevaluation of on-farm food loss estimates in North America. Agricultural Systems 167, 136–142. 10.1016/j.agsy.2018.09.008 [DOI] [Google Scholar]
- Kantor LS, Lipton K, Manchester A, Oliveira V, 1997. Estimating and addressing America’s food losses. FoodReview 2–12. [Google Scholar]
- Katare B, Serebrennikov D, Wang HH, Wetzstein M, 2017. Social-optimal household food waste: taxes and government incentives. Am J Agric Econ 99, 499–509. 10.1093/ajae/aaw114 [DOI] [Google Scholar]
- Kummu M, de Moel H, Porkka M, Siebert S, Varis O, Ward PJ, 2012. Lost food, wasted resources: Global food supply chain losses and their impacts on freshwater, cropland, and fertiliser use. Science of The Total Environment 438, 477–489. 10.1016/j.scitotenv.2012.08.092 [DOI] [PubMed] [Google Scholar]
- Leach AM, Galloway JN, Bleeker A, Erisman JW, Kohn R, Kitzes J, 2012. A nitrogen footprint model to help consumers understand their role in nitrogen losses to the environment. Environmental Development 1, 40–66. 10.1016/j.envdev.2011.12.005 [DOI] [Google Scholar]
- Lenzen M, Moran D, Kanemoto K, Foran B, Lobefaro L, Geschke A, 2012. International trade drives biodiversity threats in developing nations. Nature 486, 109–112. 10.1038/nature11145 [DOI] [PubMed] [Google Scholar]
- Lenzen M, Moran D, Kanemoto K, Geschke A, 2013. Building EORA: a global multi-region input–output database at high country and sector resolution. Economic Systems Research 25, 20–49. 10.1080/09535314.2013.769938 [DOI] [Google Scholar]
- Leontief W, 1970. Environmental repercussions and the economic structure: an input-output approach. The Review of Economics and Statistics 52, 262 10.2307/1926294 [DOI] [Google Scholar]
- Miller RE, Blair PD, 2009. Input–Output Analysis: Foundations and Extensions, 2nd ed Cambridge University Press, Cambridge: 10.1017/CBO9780511626982 [DOI] [Google Scholar]
- Muth MK, Birney C, Cuéllar A, Finn SM, Freeman M, Galloway JN, Gee I, Gephart J, Jones K, Low L, Meyer E, Read Q, Smith T, Weitz K, Zoubek S, 2019. A systems approach to assessing environmental and economic effects of food loss and waste interventions in the United States. Science of The Total Environment 685, 1240–1254. 10.1016/j.scitotenv.2019.06.230 [DOI] [PMC free article] [PubMed] [Google Scholar]
- Nakamura S, Kondo Y, 2009. Waste input-output analysis: concepts and application to industrial ecology, Eco-efficiency in industry and science. Springer, Dordrecht, the Netherlands. [Google Scholar]
- Quested T, Johnson H, 2009. Household food and drink waste in the UK: final report. Wastes & Resources Action Programme (WRAP), Banbury, Oxon, U.K. [Google Scholar]
- Quested T, Murphy L, 2014. Household food and drink waste: a product focus. Waste & Resources Action Programme, Banbury, Oxon, U.K. [Google Scholar]
- ReFED, 2016. A roadmap to reduce U.S. food waste by 20 percent.
- Retail Profit Solutions, 2012. Where’s My Shrink? Sales and shrink by department [WWW Document]. URL http://wheresmyshrink.com/shrinkbydepartment.html (accessed 8.21.19).
- Reutter B, Lant P, Reynolds C, Lane J, 2017. Food waste consequences: Environmentally extended input-output as a framework for analysis. Journal of Cleaner Production 153, 506–514. 10.1016/j.jclepro.2016.09.104 [DOI] [Google Scholar]
- Reynolds C, 2013. Quantification of Australian food wastage with input-output analysis (Doctoral dissertation). University of South Australia. [Google Scholar]
- Reynolds C, Goucher L, Quested T, Bromley S, Gillick S, Wells VK, Evans D, Koh L, Carlsson Kanyama A, Katzeff C, Svenfelt Å, Jackson P, 2019. Review: Consumption-stage food waste reduction interventions – What works and how to design better interventions. Food Policy 83, 7–27. 10.1016/j.foodpol.2019.01.009 [DOI] [Google Scholar]
- Rood T, Muilwijk H, Westhoek H, 2017. Food for the circular economy. PBL Netherlands Environmental Assessment Agency, The Hague, the Netherlands. [Google Scholar]
- Rosa W (Ed.), 2017. Transforming Our World: The 2030 Agenda for Sustainable Development, in: A New Era in Global Health. Springer Publishing Company, New York, NY: 10.1891/9780826190123.ap02 [DOI] [Google Scholar]
- Rossaint S, Kreyenschmidt J, 2015. Intelligent label – a new way to support food waste reduction. Proceedings of the Institution of Civil Engineers - Waste and Resource Management 168, 63–71. 10.1680/warm.13.00035 [DOI] [Google Scholar]
- Rutten MM, 2013. What economic theory tells us about the impacts of reducing food losses and/or waste: implications for research, policy and practice. Agriculture & Food Security 2, 13 10.1186/2048-7010-2-13 [DOI] [Google Scholar]
- Salemdeeb R, Font Vivanco D, Al-Tabbaa A, zu Ermgassen EKHJ, 2017. A holistic approach to the environmental evaluation of food waste prevention. Waste Management 59, 442–450. 10.1016/j.wasman.2016.09.042 [DOI] [PubMed] [Google Scholar]
- San Francisco Department of Environment, 2013. Food Service Waste Reduction Ordinance (2007 Requirements - Food Vendors & Restaurants) [WWW Document]. sfenvironment.org; - Our Home. Our City. Our Planet. URL https://sfenvironment.org/food-service-waste-reduction-ordinance-2007-requirements-food-vendors-restaurants (accessed 8.22.19). [Google Scholar]
- Schipanski ME, MacDonald GK, Rosenzweig S, Chappell MJ, Bennett EM, Kerr RB, Blesh J, Crews T, Drinkwater L, Lundgren JG, Schnarr C, 2016. Realizing resilient food systems. BioScience 66, 600–610. 10.1093/biosci/biw052 [DOI] [Google Scholar]
- Smith P, 2013. Delivering food security without increasing pressure on land. Global Food Security 2, 18–23. 10.1016/j.gfs.2012.11.008 [DOI] [Google Scholar]
- Springmann M, Clark M, Mason-D’Croz D, Wiebe K, Bodirsky BL, Lassaletta L, Vries W. de, Vermeulen SJ, Herrero M, Carlson KM, Jonell M, Troell M, DeClerck F, Gordon LJ, Zurayk R, Scarborough P, Rayner M, Loken B, Fanzo J, Godfray HCJ, Tilman D, Rockström J, Willett W, 2018. Options for keeping the food system within environmental limits. Nature. 10.1038/s41586-018-0594-0 [DOI] [PubMed] [Google Scholar]
- Takase K, Kondo Y, Washizu A, 2008. An analysis of sustainable consumption by the waste input-output model. Journal of Industrial Ecology 9, 201–219. 10.1162/1088198054084653 [DOI] [Google Scholar]
- US EPA, 2019. Winning on Reducing Food Waste Federal Interagency Strategy [WWW Document]. US EPA; URL https://www.epa.gov/sustainable-management-food/winning-reducing-food-waste-federal-interagency-strategy (accessed 8.22.19). [Google Scholar]
- US EPA, 2016. Food: too good to waste: an evaluation report for the consumption workgroup of the West Coast climate and materials management forum. Seattle, WA. [Google Scholar]
- Wiebe KS, Bjelle EL, Többen J, Wood R, 2018. Implementing exogenous scenarios in a global MRIO model for the estimation of future environmental footprints. Economic Structures 7, 20 10.1186/s40008-018-0118-y [DOI] [Google Scholar]
- Willett W, Rockström J, Loken B, Springmann M, Lang T, Vermeulen S, Garnett T, Tilman D, DeClerck F, Wood A, Jonell M, Clark M, Gordon LJ, Fanzo J, Hawkes C, Zurayk R, Rivera JA, De Vries W, Majele Sibanda L, Afshin A, Chaudhary A, Herrero M, Agustina R, Branca F, Lartey A, Fan S, Crona B, Fox E, Bignet V, Troell M, Lindahl T, Singh S, Cornell SE, Srinath Reddy K, Narain S, Nishtar S, Murray CJL, 2019. Food in the Anthropocene: the EAT–Lancet Commission on healthy diets from sustainable food systems. The Lancet 393, 447–492. 10.1016/S0140-6736(18)31788-4 [DOI] [PubMed] [Google Scholar]
- Wilson NLW, Miao R, Weis C, 2018. Seeing is not believing: perceptions of date labels over food and attributes. Journal of Food Products Marketing 24, 611–631. 10.1080/10454446.2018.1472700 [DOI] [Google Scholar]
- WRAP, 2012. Product losses: reducing raw material yield losses in the UK drinks sector. Waste & Resources Action Programme, Banbury, Oxon, U.K. [Google Scholar]
- Yamakawa H, Williams I, Shaw P, Watanabe K, 2017. Food waste prevention: lessons from the Love Food, Hate Waste campaign in the UK, in: Proceedings Sardinia 2017. Presented at the Sixteenth International Waste Management and Landfill Symposium, CISA Publisher, Cagliari, Italy, p. 22. [Google Scholar]
- Yang Y, Ingwersen WW, Hawkins TR, Srocka M, Meyer DE, 2017. USEEIO: A new and transparent United States environmentally-extended input-output model. Journal of Cleaner Production 158, 308–318. 10.1016/j.jclepro.2017.04.150 [DOI] [PMC free article] [PubMed] [Google Scholar]
Associated Data
This section collects any data citations, data availability statements, or supplementary materials included in this article.