

Abstract
A major source of primary health care for millions of Americans, community health centers (CHCs) act as a key point of access for diabetes care. The ability of a CHC to deliver high quality care, that supports patients’ management of their diabetes, may be impacted by the unique set of resources and constraints it faces, both in terms of characteristics of its patient population and aspects of operations. This study examines how patient and regional characteristics, staffing patterns, and efficiency were associated with diabetes management at CHCs (percentage of patients with uncontrolled diabetes, HbA1C > 9%). Data on a sample of 1,229 CHCs came from multiple sources. CHC-level information was obtained from the Uniform Data System and regional-level information from the Behavioral Risk Factor Surveillance System and the US Census American Community Survey. A clustering methodology, latent class analysis, identified seven underlying staffing patterns at CHCs. Data envelopment analysis was performed to evaluate the efficiency of CHCs, relative to centers with similar staffing patterns. Finally, generalized linear models were used to examine the association between staffing patterns, efficiency, and patient and regional-level characteristics. Findings from this study have sociological, practical, and methodological implications. Findings highlight that the intersection of patient racial composition with regional racial composition is significant; diabetes control appears to be worse at CHCs serving racial minorities living in predominantly White areas. Findings suggest that CHCs that incorporate more behavioral health care into their staffing mix have lower rates of uncontrolled diabetes among their patients. Finally, greater efficiency in CHC operations is associated with better diabetes control among patients. By identifying sociodemographic and operational characteristics associated with better hemoglobin control among diabetes patients, the current study contributes to our understanding of both health care operations and health inequalities.
Keywords: diabetes, HbA1C, community health centers, staffing, efficiency
1. Introduction
Diabetes mellitus affects more than 30.3 million American adults, or 9.4% of the US population (Centers for Disease Control, 2017). The seventh leading cause of death, diabetes puts people at risk for a host of complications and comorbidities. Inequalities exist in diabetes prevalence and outcomes across different populations and places. Diabetes is expensive. In 2017, diabetes was estimated to cost the US $327 billion (American Diabetes Association, ADA, 2018a). Of all dollars spent on health care in the United States, one in four are spent caring for people with diagnosed diabetes (ADA, 2018a). Costs for the care of diabetes are also increasing, with increased prevalence rates and cost per person. Finding ways to improve care for people with diabetes is of paramount importance for the US health care system.
The management of diabetes in the population reflects both social determinants of health and access to quality health care. To improve health outcomes and reduce associated costs, the management of diabetes has become a focal point of diabetes care (ADA, 2018b). Blood glucose testing, specifically of hemoglobin A1C (HbA1C), is considered a foundational component of care for those with Type II diabetes, the type experienced by 90-95% of diabetes patients (ADA, 2003). Higher HbA1C levels are associated with greater likelihood of experiencing chronic complications. ADA guidelines set an HbA1C goal of less than 7%, while values above 9% are considered indicative of poorly controlled diabetes (ADA, 2018b). Inequalities persist in access to diabetes care and monitoring of HbA1C, and HbA1C levels. Studies find that individuals from more economically disadvantaged backgrounds visit clinics and have their HbA1C levels assessed less frequently, but are more likely to have higher HbA1C values when they are tested (Grintsova et al., 2014). Understanding factors associated with better control of HbA1C within a health care setting is important to promote policies for improving patient health outcomes and addressing health inequities.
Community health centers (CHCs) play a vital role in addressing such inequities. With almost 1,400 centers located across the United States, CHCs deliver comprehensive primary care to medically disadvantaged and underserved patients. CHCs charge for services on a sliding-scale and provide health care at no charge to those who are unable to pay (Health Resources and Services Administration, HRSA, 2020). Therefore, CHCs are an ideal health care setting to examine differences in HbA1C outcomes among diabetes patients, as cost barriers to seeking diabetes care are at least partially ameliorated.
Several aspects of CHC operations might be important for diabetes outcomes among their patients. Given differential prevalence rates of diabetes across sociodemographic groups (CDC 2017; Robbins, et al, 2005), the composition of the patient population being served by a CHC leads to different health care needs. CHC staffing patterns have been linked with the quality and efficiency with which care is delivered to patients (Ku et al., 2015). The efficiency with which a CHC delivers care might also reflect higher quality processes that simultaneously contribute to better health outcomes for patients (Clement et al., 2008). In their conceptual framework, Andersen and colleagues argue that aspects of the health services system (organization and resources) and individual-level determinants work together to impact how health services are utilized and satisfaction with the quality of care (Andersen & Newman, 2005; Aday & Andersen, 1974). In this paper we consider how two dimensions of the health service system at CHCs (staffing patterns and efficiency), and social determinants of health are associated with diabetes management among CHC patients.
2. Background
2.1. Staffing patterns
Staffing models for many CHCs are quite broad and based on the community’s needs, including patient composition and staff availability (Ku et al., 2015). Recruiting and retaining highly-qualified clinicians at CHCs is problematic, especially given provider shortages in the CHC service regions (Rosenblatt et al., 2006; Gamble et al., 2019). Choosing the right staffing model for a CHC’s patient population is important, as patterns of CHC staffing are associated with how well CHCs provide high-quality care in an efficient manner (Ku et al., 2015). In this paper we use an approach called data envelopment analysis (DEA; described in the next section) to evaluate the efficiency of CHCs relative to the type of staffing pattern employed.
Staffing patterns are associated with the quality of care delivered and patient outcomes (Clement et al., 2008). CHCs “recognize the link between multidisciplinary healthcare teams and improved patient outcomes, reduced disparities, and lower care costs” (Proser et al., 2015, p. 49). For example, a nurse practitioner - medical doctor (NP-MD) collaborative care approach to diabetes management may be an efficient way to allocate staff resources without sacrificing health care quality (Litaker et al., 2003). The ADA recommends a best practice of integrating psychosocial care into collaborative, patient-centered health care delivery (ADA, 2018b). Integration of behavioral health into primary care is important for patient health, including diabetes outcomes (Reiss-Brennan et al., 2016). Patient-centered collaborative care teams may be effective since changes in HbA1C are heavily influenced by patient behavior (Litaker et al., 2003). Therefore, we hypothesize that CHCs that incorporate more behavioral health and advanced-practice professionals on their staff will be associated with improved diabetes outcomes.
2.2. Efficiency and quality
A CHC’s efficiency can impact the quality of healthcare delivered to patients. Deily and McKay (2006) hypothesized that hospitals that are more cost efficient may have better patient health outcomes due to improved management of processes in delivering health care. Process improvements implemented to reduce wasteful use of resources, such as the quality improvement philosophy “Lean,” may simultaneously improve the system of delivering care, contributing to better health outcomes for patients (Toussaint & Berry, 2013). Menor et al. (2001) examined operations agility in the services sector and proposed that quality and low-cost can work together in a symbiotic manner. Roth et al. (2019) extended this hypothesis to the healthcare domain and found that a subset of hospitals were able to achieve high technical efficiency simultaneously with high clinical quality. Health care organizations that provide quality health outcomes in an efficient manner may be considered high value.
A common approach for defining value in health care is the ratio of outcomes to cost, but operationalizing these concepts is a challenge (Luo, 2015). In this context, value can be increased by any combination of reducing the denominator, through cost-saving initiatives, and increasing the numerator, by improving patient outcomes. Efficiency can be broadly interpreted as the ratio of outputs to inputs. In a health care context, these outputs are frequently measured as a count of patients treated or procedures performed, while inputs commonly refer to dollar expenditures or staff full time-equivalents (FTEs). Per capita cost of healthcare is a metric commonly used in the literature (McGlynn, 2008). The inverse of cost per patient can be used as an efficiency measure. If multiple metrics are to be used for inputs and/or outputs, it is not obvious how an efficiency ratio can be computed. Data envelopment analysis (DEA) is a mathematical technique for computing efficiency in such cases, measuring the extent to which a health care provider achieves a given level of multi-dimensional outputs relative to its consumption of multidimensional inputs (Sherman & Zhu, 2006). In the remainder of this paper, the term efficiency will be used consistent with the term technical efficiency in the DEA context, referring to a CHC’s production of outputs relative to its utilization of inputs (see Section 4.2).
A challenge to efficiency-focused analyses of health care is that, unlike value, efficiency does not explicitly consider the quality of outcomes. Health care performance measures used in practice do not address the relationship between quality and costs of care (Russo & Adler, 2015). These authors recommend the use of a gated approach, in which a minimum threshold for quality must be satisfied before a provider is considered for cost efficiency recognition. Previous research has examined efficiency using DEA in such a gated approach (McGarvey et al., 2019).
Focusing specifically on diabetes care, certain initiatives have been found to generate improvements in both efficiency and quality (Huang et al., 2007). Kralewski et al. (2012) found that practices which improve the quality of care can both improve outcomes and generate significant net savings per patient. Collaborative practice models are another approach found to be cost-effective from the clinic, payer and health system perspectives (Hirsch et al., 2017). Complex diabetes patients served by a collaborative endocrinologist-pharmacist practice had better outcomes (e.g., reduced risks for diabetes-related complications) than patients served by primary care physicians, thus producing greater cost avoidance (Hirsch et al., 2017). Further, the collaborative practice’s slightly higher cost per additional HbA1C benefit was outweighed by their improved HbA1C control over the usual practice.
Past research has examined efficiency with respect to diabetes treatment. Wanke and Aktas (2018) computed relative efficiency scores for diabetes care providers in the United Kingdom, and identified key factors influencing a provider’s treatment efficiency, including hospital and patient demographics and in particular diabetes prevalence. Amado and Dyson (2009) used DEA to evaluate a small sample of diabetes care providers in the England across multiple dimensions. Their results found that objectives of efficiency and positive clinical outcomes are not necessarily conflicting, and that some practices were able to achieve high scores on both objectives. Testi et al. (2013) used an integrated DEA approach and found that it was possible for diabetes care providers to achieve good performance on both quality of physician practices and efficiency scores.
Current research lacks a systematic evaluation of the association between efficiency and quality outcomes for diabetes patients. A limitation to both Amado and Dyson (2009) and Testi et al. (2013) is the limited number of medical practices (14 and 96, respectively) examined in the DEA models. Thus, given evidence from studies suggesting that quality improvement initiatives are positively associated with both improved efficiency and improved health outcomes (e.g. Hirsch et al., 2017; Krawlewski et al., 2012), and the evidence that greater efficiency may occur simultaneously with improved health outcomes (Testi et al., 2013; Clement et al., 2008), we hypothesize that CHCs with greater efficiency will have better management of diabetes, as evidenced by lower rates of uncontrolled HbA1C among their patients.
2.3. Social location and environment
Research points to persistent inequalities in diabetes prevalence, with higher rates of diabetes among individuals from lower socioeconomic status (Robbins, et al, 2005), non-Hispanic Blacks, Hispanics, and especially American Indian and Alaskan Native men and women (CDC, 2017). Individuals living in poor neighborhoods are found to have higher rates of diabetes, even adjusting for individual income levels (Gaskin et al., 2014). The racial composition of a neighborhood has also been linked with diabetes prevalence, where Blacks living in more racially-integrated neighborhoods are found to have higher rates of diabetes (Gaskin et al., 2014).
Indicators of diabetes management (HbA1C levels) also vary across groups. Research finds that individuals with lower socioeconomic status (Hassan et al., 2006), Hispanics (Kirk et al., 2008), Blacks (Kirk et al., 2006), American Indians (Quandt et al., 2005), and individuals without medical insurance (Zhang et al., 2012) have poorer glycemic control (higher HbA1C). Neighborhood characteristics have also been linked with poorer glycemic control including economic disadvantage, low social cohesion, and food insecurity (Laraia et al., 2012; Walker et al., 2016). Less is known about how the racial composition and segregation of people within neighborhoods is associated with diabetes control among people from different racial groups (Kershaw & Pender, 2016). Research points to the importance of considering patient and neighborhood racial composition, when examining the health outcomes of patients served by CHCs (Thorsen et al., 2019). This study found that when CHCs served largely poor racial minority patients in more affluent, predominantly white areas, their patients had poorer birth outcomes.
Together this body of research points to the myriad ways in which social location and neighborhood environment act as social determinants of health. For example, greater exposure to chronic stress and trauma impacts health behavior (e.g. stress-induced eating) and elicits physiological responses (e.g. fat accumulation, elevated cortisol), in ways that may act as mechanisms for poorer glycemic control among socially- and economically-disadvantaged individuals and those living in more disadvantaged environments (Hilliard et al., 2016). Given strong evidence of the socially determined nature of diabetes outcomes, accounting for differences in patient populations and regional settings of care is important in order to isolate the association between CHC operations and diabetes management.
Informed by prior research we hypothesize that CHCs serving a greater percentage of poor, uninsured, racial minority patients (in particular Blacks, Hispanics, and American Indian patients) will have a higher likelihood that their patients have uncontrolled diabetes. We hypothesize that rates of uncontrolled diabetes will be higher at CHCs located in areas with high poverty and obesity rates and areas where a large percentage of individuals lack access to a usual source of medical care. Finally, we hypothesize that this association will be stronger for CHCs that serve racial minorities located in predominately White areas.
3. Current Study
This study uses multiple data sources to examine the association between CHC staffing patterns and efficiency, their patient populations and settings of care, and control of diabetes among its patients (HbA1C level). Our analytic approach involved three main steps. First, we used a clustering method, latent class analysis (LCA), to identify unobserved subgroups of CHCs based on their distribution of fulltime equivalents (FTEs) across six staffing categories. Second, we conducted DEA to analyze the efficiency of CHCs in reference to their peer organizations from the previously identified latent classes of staffing patterns. Finally, we ran a series of generalized linear regression models (GLMs) estimating the odds that a diabetes patient at a CHC had uncontrolled diabetes (defined as HbA1C > 9%). In these models we examined associations between diabetes management (uncontrolled diabetes) and the sociodemographic composition of the patient population, characteristics of the region in which the CHC is located (e.g. regional poverty), patterns of staffing at CHCs, and the efficiency of CHC operations. This approach enables us to identify how particular patterns of staffing and the efficiency with which CHCs operate are associated with quality health outcomes for diabetes patients at CHCs, above and beyond the constellation of socially-determined risk factors facing a given patient mix and setting. To the best of our knowledge, this is the first study to systematically examine the associations between staffing patterns, efficiency, and diabetes management among diabetes patients.
4. Methods
4.1. Data
Data come from several sources, including information at the level of the CHC and regional information at the zip-code tabulation area (ZCTA) level. Health-center data come from the Uniform Data System (UDS) from 2015, and includes information on patient demographics, health measures, and costs for all 1,375 federally-qualified health centers (FQHCs; HRSA, 2015a). Data on staffing by major service category for each CHC was accessed from the UDS Mapper website (American Academy of Family Physicians, 2017). Regional level information was obtained at the level of the ZCTA from the US Census American Community Survey (ACS; 2010-2014) and Behavioral Risk Factor Surveillance System (BRFSS; 2009-2012). Regional data associated with each CHC’s service delivery area was obtained by averaging ZCTA-level data across all ZCTAs served by each CHC.
Forty-four FQHCs that were either outside of the 50 US states or served fewer than 100 patients were excluded from our LCA analyses. Our analyses were limited to FQHCs funded under Section 330(e) of the Public Health Service Act, requiring the FQHC to serve all residents in the center’s service area regardless of their ability to pay (HRSA, 2020). This resulted in the exclusion of an additional 79 centers. Those 79 excluded centers were only funded under Section 330(g), (h), or (i) with the purpose of serving a subgroup of the service area’s population (i.e., migrant workers, homeless persons, and residents of public housing). Finally, an additional 18 CHCs were excluded that were missing data on staffing FTE, for a final analytic sample of n = 1,234 CHCs for LCA analyses. Additionally, 5 CHCs were missing data regarding the percent of adult patients who had a diagnosis of diabetes whose hemoglobin (HbA1C) was not adequately controlled; these 5 CHCs were excluded from the DEA model, for a final DEA sample of n = 1,229 CHCs. This sample was used in regression models predicting uncontrolled diabetes.
4.2. Measures
The dependent variable in the current study was number of patients at a CHC with uncontrolled diabetes, defined as an HbA1C level of 9% or higher (or diabetes patients who did not receive an HbA1C test in the previous year). Generalized linear models took the form of binomial regression models, in which the total number of diabetes patients at the CHC was accounted for in the denominator. Coefficients are interpreted as the likelihood that a diabetes patient at a CHC has uncontrolled diabetes. Further discussion of the GLM models are provided below.
The LCA includes six variables from HRSA data on the percentage of total full-time equivalents (FTEs) dedicated to six staffing categories. These categories include the percentage of total FTE used for 1) physicians, 2) advanced practice professionals including nurse-practitioners (NPs), physician assistants (PAs), and certified nurse-midwives (CNMs), 3) nursing and medical/technical staff, 4) enabling services (e.g. transportation, social services, etc.), 5) behavioral health staff including mental health and substance abuse professionals, and 6) vision and dental staff.
The DEA model had seven input measures, three operational output measures, and one quality threshold measure for each CHC. The input measures included the count of FTEs in each of the six staffing categories discussed above, along with the center’s total cost as reported by HRSA (including medical staff, medical lab and X-ray costs, other direct medical costs [supplies, equipment depreciation, EHR system costs], dental, mental health, substance abuse, pharmacy, pharmaceuticals, other professional [podiatry, chiropractic], vision, enabling [case management, transportation], other program related [WIC, childcare centers, adult day health care centers, fitness centers, Head Start and Early Head Start], quality improvement services, facility costs, non-clinical support services costs, the value of donations). The operational output measures included number of adult patients with diabetes, their number of visits, and total number of patients from HRSA data. The quality threshold measure was the percentage of diabetes patients with HbA1C above 9%. This threshold measure was used to exclude cases from the reference set that were operationally efficient, but low quality. In addition to efficiency, the association between cost per patient and diabetes management was examined in separate models. This variable was measured per $100, such that a one-unit increase represents an increase of $100 spent per patient.
Four measures derived from HRSA data capture the sociodemographic composition of the patient population served by CHCs: race, poverty, insurance status, and the average number of medical visits by diabetes patients. Race was measured with four variables: % of the CHC patient population that was Black, % Asian/Pacific Islander, % Hispanic, and % American Indian. Poverty was measured as the percentage of the CHC patient population at 100% or below the federal poverty line. Insurance status was measured with three variables: % of the CHC patient population that was uninsured, % on Medicaid, and % on Medicare. The average number of visits by diabetes patients was calculated by dividing the total number of visits to the CHC for diabetes related care over the total number of diabetes patients at the CHC. Data from the ACS and BRFSS was used to measure the characteristics of CHC service region: % urban, % of the regional population in poverty (at or below 100% of the federal poverty line), % of the regional population that was non-white, % of the regional population that was obese (body-mass index above 30), % of the regional population who reported no access to a usual source of medical care, and % of the regional adult population that reported a diagnosis of diabetes. To account for variation in health care, regulatory environments, and other endogenous variability across place we included controls for Centers for Medicare and Medicaid Services (CMS) region (Centers for Medicare and Medicaid Services, 2017). All variables (except the binary variable urban and the Medicaid Region categories) were standardized to have a mean of 0 and a standard deviation of 1.
4.3. Analytic strategy
Three methodologies were used in the current study: LCA, DEA, and GLMs with a binomial distribution. We describe each of these methods in turn.
Latent class analysis (LCA) is a clustering methodology used to identify latent subgroups of CHCs, based on observed indicators of staffing. Using Mplus version 6, several measures of model fit were jointly considered to determine the optimal number of latent classes and facilitate model selection, including information criteria (the Bayesian Information Criteria (BIC) and the Akaike Information Criteria (AIC)) and likelihood-ratio tests (Lo-Mendell Ruin, LMR) (Nylund et al., 2007). Entropy scores, indicating the degree of disambiguation between classes, were also evaluated during model selection.
The efficiency of CHCs was evaluated with the method Data Envelopment Analysis (DEA), using the optimization software GAMS/CPLEX. For a given set of organizations, DEA computes an efficiency score for each organization based on the quantity of inputs the organization uses (e.g. physical and monetary resources) and the quantity and quality of the outputs generated by the organization (e.g. patient visits with positive health outcomes). The DEA approach identifies a group of organizations that are on the efficient frontier (the efficient reference set, ERS), and assigns them an efficiency score of one. Every other organization is compared to the optimal pattern of resource usage by this ERS, and an efficiency score between 0 and 1 is computed for each organization. An input-oriented variable return-to-scale (VRS) DEA model was used, under the assumption that CHCs have greater control over inputs (FTE in each staffing category and total costs) than they have over outputs (number of adult patients with diabetes, their number of visits, total number of patients, percentage of diabetes patients with HbA1C above 9%), with a VRS approach allowing the model to capture the potential influence of nonlinear scale economies (i.e., an increase in inputs need not be expected to generate a proportional increase in outputs).
One concern with such efficiency scores is the potential for organizations to be classified as “high efficiency” while operating with poor quality (e.g. poor health outcomes). A variant of the Quality-Adjusted DEA approach (Sherman & Zhu, 2006) was thus applied in the current study to mitigate the influence of low-quality organizations on DEA efficiency scores. CHCs below a given quality target threshold were excluded from the ERS. Specifically, all CHCs with an efficiency score of 1.0 that exceeded the sample average for diabetes management of HbA1C (greater than 30.57% of their diabetes patients with HbA1C score of 9% or above) were excluded from the ERS. A flag identifying centers excluded from the ERS was included in all GLM models including efficiency.
To adjust for heterogeneity across CHC operating environments, an initial classification of CHCs using LCA was performed and then DEA within each class was conducted to identify a CHC’s efficiency score relative to the other members of its class. Research suggests that such a disaggregated approach to calculating efficiency, in which efficiency scores are calculated separately for groups of similar organizations, provides a more precise and equitable assessment of efficiency (McGarvey et al., 2019). Therefore, DEA scores are relative metrics; a high efficiency score indicates that a given organization is performing comparably to the benchmark ERS for its class, not that the organization is performing well from an absolute standpoint.
The goal of our study is to examine how CHC staffing typologies and efficiency are related to the control of diabetes among its patients (Y, the number of patients with uncontrolled diabetes). We specify the GLM as follows:
The dependent variable Y is specified using a binomial distribution where the number of trials is equal to the total number of diabetes patients at the CHC. The number of trials varies across observations. The model’s link function g is a logit function. The vector X represents the independent variables including patient and regional characteristics, latent class indicators, DEA efficiency scores, and cost per patient values.
5. Results
5.1. Latent Class Analysis
Using measures of CHC staffing usage, LCA solutions were estimated for two through eight classes. Following established conventions in the literature, information criteria, likelihood-ratio tests, and entropy were jointly considered (Nylund et al., 2007). Model comparisons led to the selection of the seven-class solution. A high entropy score, low values for information criteria, and a marginally statistically significant Lo-Mendell Rubin test suggest that it fit the data best with a clear substantive interpretation (see appendix Table S1).
Table 1 presents descriptive information on indicators of staffing distributions at CHCs used to determine the latent classes. The overall means of staffing indicators for the full sample of CHCs are presented in the first column, with indicator means for each of the seven classes presented in subsequent columns. The overall means provide a reference point to enable comparisons between LCA classes and the sample average. Subscript lettering indicates significant differences in means across latent classes, according to Analysis of Variance (ANOVA) tests. Class one (25% of the sample) includes CHCs characterized by a high emphasis on the staffing of nursing and medical technician professionals, with over 50% of all FTEs going towards this staffing category. Further, this class was characterized by a relatively high emphasis on advanced practice professionals (nurse practitioners, physician assistants, and certified nurse-midwives). We label this group High Nursing and Advanced Practice. Class two (8.6% of the sample) consists of CHCs with the greatest concentration of FTEs related to vision and dental professionals (almost 40%). We label this group High Vision/Dental. The third latent class includes CHCs with the largest concentration of staff involved in enabling services (38.4%; e.g. transportation, case managers, patient education specialists) and the second highest concentration of staff providing behavioral health services; we label this group High Enabling. Class four (51% of the sample) includes CHCs with a more evenly distributed staffing pattern, similar to the FTE means of the overall sample; we label this class Typical. Class five (3% of the sample) includes CHCs with the greatest share of physicians making up their total FTEs (31%); we label this class High Physicians. Class six (3% of the sample) consists of CHCs with the highest concentration of staff delivering behavioral health services (including mental health and substance abuse services; 42% of total FTE); we label this group High Behavioral. Finally, class seven (0.6% of the sample) was a small group of CHCs that placed a strong emphasis on advanced practice professionals, devoting over 60% of their FTEs to this staffing category. We labeled this group High Advanced Practice.
Table 1.
Means of CHC Staffing Percentage (%) Full-Time Equivalents (FTEs) Indicators by Latent Class Membership
| Full Sample | Class 1a High Nursing and Adv. Practice |
Class 2b High Vision/Dental |
Class 3c High Enabling |
Class 4d Typical |
Class 5e High Physician |
Class 6f High Behavioral |
Class 7g High Advanced Practice |
|
|---|---|---|---|---|---|---|---|---|
| % of Total FTE | ||||||||
| Physicians | 10.37 | 11.77bcdfg | 6.66 | 7.63f | 9.92bfg | 30.85abcdfg | 4.81 | 2.76 |
| Vision/Dental | 13.61 | 2.32 | 39.69acdefg | 7.68a | 16.83acefg | 4.18a | 7.40a | 0.95 |
| Nursing/Medical Tech. | 40.25 | 51.94bcdefg | 26.96g | 25.86g | 40.32bcfg | 41.50bcfg | 23.47 | 15.81 |
| Advanced Practice (NP/PA/CNM) | 12.03 | 16.14bcdef | 8.65e | 10.81e | 10.82bef | 5.10 | 7.71 | 63.80abcdef |
| Behavioral | 6.72 | 3.81 | 5.12 | 9.64abdeg | 6.00a | 4.74 | 41.78abcdeg | 3.12 |
| Enabling | 17.02 | 14.03 | 12.85 | 38.38abdefg | 16.11ab | 13.66 | 14.84 | 13.56 |
| N | 1,234 | 309 | 106 | 102 | 632 | 39 | 38 | 8 |
| Proportion | 100% | 25.0% | 8.6% | 8.3% | 51.2% | 3.2% | 3.1% | 0.6% |
Notes:
represents that the mean is significantly larger than the mean for another class at p<0.05 based on Bonferroni post hoc paired comparisons of Analysis of Variance (ANOVA) tests (classes 1-7 coded as a-g).
5.2. Efficiency Analyses: DEA and Cost per Patient
A separate DEA optimization model was run for each latent class to compute relative efficiency scores for each CHC, such that each CHC was only compared to the other members of its latent class. Observe first that the mean DEA efficiency score was 1.0 for class 7, in this case the small sample size (only six CHCs included in the DEA), relative to the large number of input and output variables, is such that the model identified all CHCs as being efficient; that is, the DEA model is not able to discriminate between any members of class 7 with respect to efficiency. Excluding class 7, the mean DEA efficiency score was highest for 2, while class 4 had the lowest mean efficiency values (see Table 2). Note that a DEA efficiency score is a relative metric, comparing how well a CHC generates outputs (diabetes patients, diabetes patient visits, and total patients) from a common set of inputs (staff FTEs and total cost), relative to the members of the efficient reference set in its own class. There is no inference to be drawn comparing absolute differences in DEA efficiency scores across classes. The variability in DEA efficiency scores within a class (measured by the standard deviation) does, however, allow for inference to be drawn across classes. Again, excluding class 7, the smallest standard deviation appears for class 2, with the largest standard deviation corresponding to class 1. This suggests that the members of class 2 (“High Vision/Dental”) exhibit greater homogeneity with respect to their DEA efficiency scores than do other classes. Similarly, there are many members of class 1 (“High Nursing and Adv. Practice”) that are significantly less efficient than the members of the class 1 efficient reference set. This does not suggest that the members of class 1 are less efficient, on average, than members of other classes.
Table 2.
Comparisons of Efficiency and Cost Per Patient by Staffing Latent Class (Analysis of Variance)
| Full Sample | Class 1a High Nursing and Adv. |
Class 2b High Vision/Dental |
Class 3c High Enabling |
Class 4d Typical |
Class 5e High Physician |
Class 6f High Behavioral |
Class 7g High Advanced Practice |
||
|---|---|---|---|---|---|---|---|---|---|
| Efficiency | Mean | 0.836 | 0.816 | 0.957ad | 0.899ad | 0.801 | 0.946ad | 0.938ad | 1.00 |
| St. Dev. | 0.182 | 0.190 | 0.095 | 0.181 | 0.178 | 0.149 | 0.136 | 0.000 | |
| Cost per Patient | Mean | $890 | $740 | $805 | $1,654abde | $816 | $903 | $1,428abde | $1,599abd |
| St. Dev. | $661 | $320 | $305 | $1,671 | $331 | $404 | $1,092 | $1,491 | |
Notes:
represents that the mean is significantly larger than the mean for another class at p<0.05 based on Bonferroni post hoc paired comparisons of Analysis of Variance (ANOVA) tests (classes 1-7 coded as a-g).
Table 2 also presents the mean and standard deviation of the Cost per patient for each class. Here direct comparisons can be made across classes. Observe that classes 3 and 6 (“High Enabling” and “High Behavioral”) have mean costs per patient that are significantly larger (at the p=0.05 level) than the members of classes 1, 2, 4 or 5. Class 7, despite having only 6 members, has a mean cost that is significantly larger than the members of classes 1, 2 or 4. These differences in average cost per patient are large in an absolute sense, with the average cost per patient for members of class 3 (“High Enabling”) roughly double the average cost per patient for members of classes 1, 2, 4 or 5. What remains to be seen is whether these classes with greater average costs per patient are able to translate those increased costs into better diabetes outcomes.
Turning to the GLM analyses, results in Table 3 suggest that characteristics of the patient population and the regional setting of the CHCs were associated with the odds that diabetes patients at a CHC had uncontrolled diabetes (as measured by uncontrolled hemoglobin levels, HbA1C > 9%). CHCs with a higher percentage of black patients and a higher percentage of American Indian patients had significantly higher odds of their diabetes patients having uncontrolled diabetes (Model 1). CHCs with a higher percentage of Asian or Pacific Islander patients and a higher percentage of patients on Medicare were associated with a lower odds that their diabetes patients had uncontrolled diabetes. The more visits diabetes patients had on average at a CHC, the less likely those patients were to have uncontrolled diabetes. Looking at regional characteristics (Model 2), CHCs located in urban areas and in areas with a high percentage of the regional population that are obese and without access to a usual source of care were associated with a higher odds that their diabetes patients had uncontrolled diabetes. The conclusions of models that included both patient- and regional-level characteristics (Model 3) are largely similar, although changes to coefficients with the inclusion of both patient- and regional-level racial composition information suggests that the two factors interact with one another. Tests of race interaction-effects are presented in model 4.
Table 3:
Patient and Regional Characteristics and the Odds of Having a Patient with Uncontrolled Diabetes at a CHC (GLMs; Odds Ratio)
| Model 1 | Model 2 | Model 3 | Model 4 | Model 5a | |
|---|---|---|---|---|---|
| Patient Characteristics | |||||
| % Black | 1.047** | 1.109*** | 1.119*** | 1.101*** | |
| (0.02) | (0.03) | (0.03) | (0.03) | ||
| Black X Regional non-White | 0.969^ | 0.953** | |||
| (0.02) | (0.02) | ||||
| % Asian/Pacific Isl. | 0.953** | 0.968^ | 0.891*** | 0.909*** | |
| (0.01) | (0.02) | (0.02) | (0.02) | ||
| Asian X Regional non-White | 1.051** | 1.038** | |||
| (0.02) | (0.02) | ||||
| % Hispanic | 1.032^ | 1.023 | 1.020 | 1.005 | |
| (0.02) | (0.02) | (0.02) | (0.02) | ||
| Hispanic X Regional non-White | 0.945** | 0.952** | |||
| (0.02) | (0.02) | ||||
| % American Indian | 1.054* | 1.065* | 1.074* | 1.058* | |
| (0.03) | (0.03) | (0.03) | (0.03) | ||
| Amer. Ind. X Regional non-White | 0.966 | 0.964^ | |||
| (0.02) | (0.02) | ||||
| % in Poverty | 1.025 | 1.010 | 1.005 | 0.982 | |
| (0.02) | (0.02) | (0.02) | (0.02) | ||
| % Uninsured | 1.007 | 0.982 | 0.989 | 0.988 | |
| (0.03) | (0.03) | (0.03) | (0.03) | ||
| % Medicaid | 0.989 | 0.972 | 0.981 | 0.980 | |
| (0.03) | (0.03) | (0.03) | (0.03) | ||
| % Medicare | 0.947* | 0.927** | 0.928** | 0.913** | |
| (0.03) | (0.03) | (0.03) | (0.02) | ||
| Avg. number of visits by diabetes patients | 0.906*** | 0 914*** | 0.915*** | 0.920*** | |
| (0.01) | (0.02) | (0.02) | (0.02) | ||
| Regional Characteristics | |||||
| Urban | 1.102*** | 1.056^ | 1.051^ | 1.050^ | |
| (0.03) | (0.03) | (0.03) | (0.03) | ||
| % in poverty | 1.000 | 1.017 | 1.028 | 1.024 | |
| (0.02) | (0.03) | (0.03) | (0.02) | ||
| % non-White | 0.989 | 0.926** | 0.932* | 0.959 | |
| (0.02) | (0.02) | (0.03) | (0.03) | ||
| % obese | 1.069* | 1.019 | 1.015 | 1.010 | |
| (0.03) | (0.02) | (0.02) | (0.03) | ||
| % no access to care | 1.034 | 1.003 | 1.029 | 1.024 | |
| (0.02) | (0.02) | (0.02) | (0.02) | ||
| 0.973 | 1.006 | 1.003 | 1.012 | ||
| % with diabetes in region | (0.03) | (0.03) | (0.03) | (0.03) | |
Notes:
Model 5 includes staffing latent classes and efficiency. Models 2-5 include indicators for Medicaid region.
p < .1,
p < .05
p < .01
p < .001;
standard errors are in parentheses, standard errors scaled using square root of deviance-based dispersion. All variables except urban have been standardized to have a mean of 0 and a standard deviation of one.
Results in Table 3, model 4 suggest that the association between patient-racial composition and diabetes control is moderated by the racial composition of the region in which the CHC is located. Specifically, while CHCs with a higher percentage of Black patients had higher odds of having a patient with uncontrolled diabetes, this association is reduced when that CHC is located in an area with a higher percentage of the regional population that is non-White. A similar pattern appears for the percentage of Hispanic and American Indian patients at CHCs. CHCs with a higher percentage of Hispanic patients had a lower odds of having a diabetes patient with uncontrolled diabetes, but only in regions where the population was largely non-White. Diabetes patients at CHCs with a higher share of American Indians were more likely to have uncontrolled diabetes, specifically in contexts in which the regional population was largely White. Finally, this pattern was reversed when looking at the distribution of the Asian patient population. Having a large share of Asian patients was associated with a lower odds that CHC patients had uncontrolled diabetes, and this association was strongest at centers where the regional population was largely White. Figure 1 graphs the results of the final multivariate model 5, illustrating these race interactions in a series of graphs plotting the predicted margins (counts) of diabetes patients with uncontrolled diabetes by the patient racial composition and regional racial composition.
Figure 1:
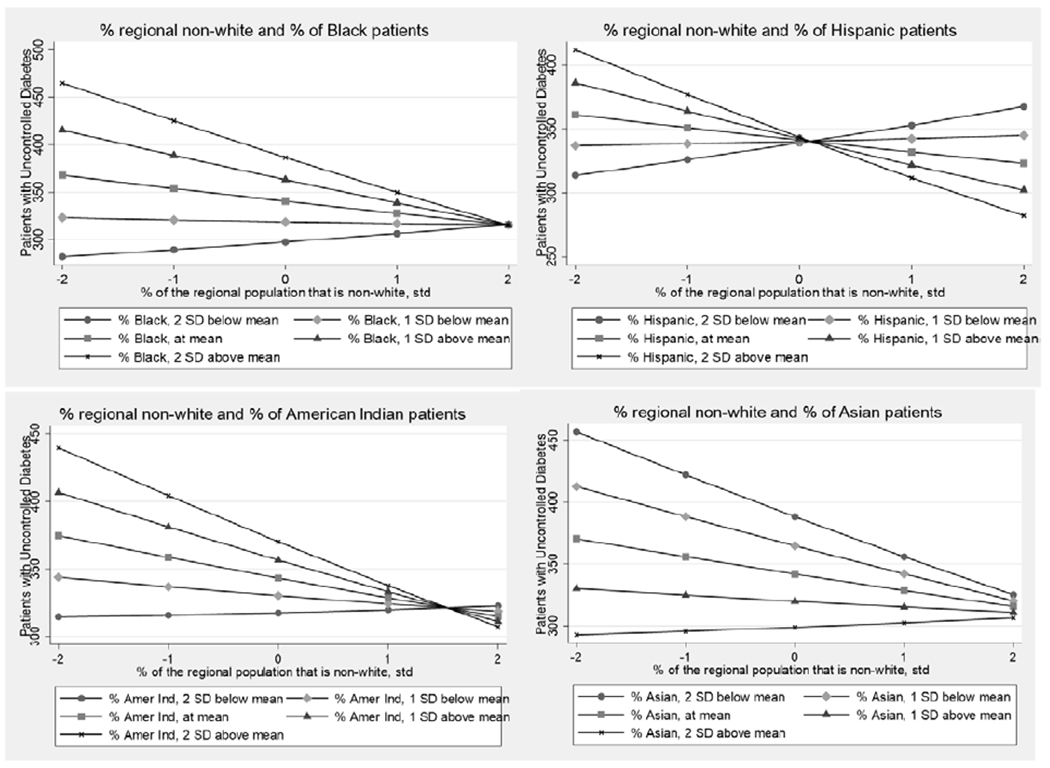
Predicted Counts of Diabetes Patients with Uncontrolled Diabetes, Regional Race by Patient Racial Composition Interactions
Models presented in Table 4 examine the association between staffing patterns, cost per patient, efficiency, and the odds that diabetes patients at CHCs have uncontrolled diabetes. Comparisons of models rotating the reference group of staffing latent class (not shown) suggest that Class 6 (“High Behavioral”) stood out for its lower odds of having patients with uncontrolled diabetes relative to other latent classes. Relative to class 6 (“High Behavioral”), CHCs in class 1 (“High Nursing and Adv. Practice”) and Class 2 (“High Vision/Dental”) had 19% and 33% higher odds of having a diabetes patient with uncontrolled diabetes respectively (model 1). Even controlling for the efficiency of CHCs, the sociodemographic characteristics of their patients, and characteristics of the regional setting, results in model 6 suggest that CHCs characterized by greater emphasis on behavioral health staffing (class 6) had lower odds of having patients with uncontrolled diabetes, relative to class 1 or 2.
Table 4:
Staffing Patterns, Cost per Patient, Efficiency and the Odds of Having a Patient with Uncontrolled Diabetes at a CHC (GLMs; Odds Ratio)
| Model 1 | Model 2 | Model 3 | Model 4 | Model 5 | Model 6b | |
|---|---|---|---|---|---|---|
| FTE Latent Classes a | ||||||
| 1 High Nursing, Adv. Practice | 1.192^ | 1.134 | 1.174^ | 1.180^ | ||
| (0.13) | (0.12) | (0.11) | (0.11) | |||
| 2 High Vision/Dental | 1.325* | 1.272* | 1.276* | 1.250* | ||
| (0.16) | (0.16) | (0.14) | (0.14) | |||
| 3 High Enabling | 1.154 | 1.168 | 1.158 | 1.131 | ||
| (0.14) | (0.14) | (0.12) | (0.12) | |||
| 4 Typical | 1.124 | 1.085 | 1.135 | 1.115 | ||
| (0.12) | (0.11) | (0.11) | (0.11) | |||
| 5 High Physician | 1.063 | 1.116 | 1.096 | 1.125 | ||
| (0.14) | (0.14) | (0.13) | (0.13) | |||
| 7 High Advanced Practice | 2.043 | 1.919 | 1.538 | 1.386 | ||
| (0.92) | (0.86) | (0.64) | (0.55) | |||
| Cost per patient (per $100) | 0.984*** | 0.985*** | ||||
| (0.00) | (0.00) | 0.763*** | 0.757*** | 0.697*** | ||
| Efficiency | (0.06) | (0.06) | (0.06) |
Notes:
Class 6 (High Behavioral) is reference;
Model 6 controls for patient characteristics (race, poverty, insurance status, avg. number of visits by diabetes patients), regional characteristics (urban, poverty, non-White, obese, no access to care, % diabetes in catchment area, Medicaid region) and patient-regional race interactions. Models with efficiency include the exclusion criteria flag;
p < .1,
p < .05,
p < .01,
p < .001;
standard errors in parentheses, standard errors scaled using square root of deviance-based dispersion.
Analyses examining the role of cost per patient (models 2 and 3) suggest that an increase of $100 spent per patient was associated with a 2% reduction in the odds that a patient had uncontrolled diabetes; spending more per patient was linked with better diabetes control among patients. Models examining CHC efficiency indicate that CHCs characterized as “efficient” had 23.7% lower odds of having a patient with uncontrolled diabetes, compared to inefficient CHCs (model 4). Looking across models controlling for both staffing patterns (model 5) and patient and regional characteristics (model 6), the magnitude of this association becomes larger. CHCs characterized as “efficient” had 30% lower odds of having a diabetes patient with uncontrolled diabetes, adjusting for staffing patterns, the sociodemographic characteristics of their patient population and the region in which the center is located.
6. Discussion
Emphasis on the management of diabetes through controlled hemoglobin levels has been a focus of practitioners and diabetes researchers (ADA, 2018b). Ensuring adequate control of HbA1C levels among diabetes patients is complex; involving patient characteristics, settings of care, and the nature of health care delivery. Social determinants of health create challenges for diabetes management among disadvantaged populations and places, who are more likely to have diabetes and less likely to have it controlled. The ability of a health care facility to deliver high quality diabetes care may be impacted by the unique set of resources and constraints it faces. Community health centers are an important focus for diabetes management, as they serve 1.9 million diabetes patients (authors’ analysis of HRSA data). Findings suggest that outcomes of diabetes patients served by CHCs are associated with a CHC’s mix of patients, the regional setting where it operates, its mix of staff, and its efficiency in operation.
Results support findings in literature that CHCs serving racial minorities living in areas without a usual source of health care have an increased likelihood of having uncontrolled diabetes, with some important caveats. The juxtaposition of patient racial composition with the racial composition of the area where patients live is associated with the level of diabetes management at CHCs. Diabetes control appears to be worse at CHCs serving racial minorities (Blacks, Hispanics, and American Indians) living in predominantly White areas. This supports prior research that racial segregation is associated with increased access to diabetes services and higher quality care for minority patients, while living in areas as a racial minority is associated with reduced access and poorer care (Chan et al., 2012). Increased access to medical safety nets in disadvantaged, segregated communities (Gaskin et al., 2009) may be linked with greater health care utilization and improved diabetes management, while minority patients living in integrated neighborhoods may lack access to comprehensive safety nets and services that promote diabetes control.
Further, social isolation and exposure to racial discrimination have been linked with poorer diabetes outcomes (Walker et al., 2016), and perceptions about exposure to racism has been linked with poor diabetes control among racial minorities (Wagner et al., 2011). Minorities living in more integrated or predominately White neighborhoods report higher perceptions of racial discrimination (Hunt et al., 2007), which may negatively impact health care seeking behaviors (White et al., 2012). Increased access to community resources and services in highly segregated neighborhoods may counteract the adverse effects of racism, while minorities living in more integrated, White neighborhoods may lack community resources and experience greater social isolation. Research also suggests that the adverse health effects of exposure to racism experienced by people of color living in predominately White neighborhoods may offset any positive health benefits of living in better socioeconomic contexts (Vinikoor et al., 2008). Less attention has been paid to the role of racial composition for diabetes management and outcomes (White & Borrell, 2011). Results of this study emphasize the resiliency and positive health outcomes for diabetes patients of CHCs serving Black, Hispanic, and American Indians in more racially diverse neighborhoods. These processes appear to be different for Asians; a finding warranting future research.
Results also highlight the link between staffing mix and diabetes management. Following research on the importance of integrated behavioral health for diabetes care (ADA 2018b), the current study finds some evidence that CHCs which focus a larger percentage of staffing FTE towards behavioral health care have lower rates of uncontrolled diabetes among their patients. The integration of behavioral health care into a primary care setting may help diabetes patients adhere to a plan for their diabetes care (Reiss-Brennan et al., 2016), resulting in better control of their HbA1C levels.
The relationship between diabetes control and efficiency was found to vary by how efficiency is measured. When using a simple metric of efficiency (cost per patient), this study found support for an inverse relationship, with increases in the amount spent per patient (reduced efficiency) associated with lower odds of a patient having uncontrolled diabetes. This is consistent with Jha et al. (2009), who found lower-cost hospitals have poorer quality.
When using a more nuanced measure of efficiency (DEA), this study found evidence for a direct relationship, with increases in efficiency associated with lower odds of a patient having uncontrolled diabetes. This finding echoes those of Amado and Dyson (2009) and Testi et al. (2013), moving beyond these prior anecdotal observations, and provides support for the existence of a mutually-reinforcing association between DEA efficiency and quality outcomes for diabetes patients.
The significance of this relationship is two-fold. First, identifying benchmark centers that achieve good health outcomes efficiently could allow for their best practices to be identified and translated to other centers (Chin et al., 2001). Second, to the extent that the US Department of Health and Human Services incentivizes increases in efficiency at CHCs, care should be taken to ensure that efficiency is measured in a manner that does not allow for efficiency gains to occur at the expense of poorer care. Our findings suggest that metrics like cost per patient could lead to rewarding centers with poorer care. Alternatively, DEA performed under a gated approach, accounting for CHC heterogeneity, generates efficiency scores that are positively correlated with better diabetes management.
There are several limitations to this study. First, there are bio-psychosocial determinants of diabetes management that we were unable to capture with the current data, such as marital status, stress, and coping styles (Peyrot et al., 1999). Due to data limitations, we rely on HbA1C level as the sole indicator of diabetes outcomes, but there are other important measures indicative of diabetes management (e.g. blood pressure, cholesterol, etc.; de Beradis et al., 2004). Further, data is reported at the CHC level, however many CHCs operate multiple service delivery sites over which their staff is spread. This renders us unable to examine issues at the service delivery sites level, a limitation shared by all research analyzing UDS data. Given the cross-sectional nature of our data, we are only able to identify correlations between efficiency, staffing, and patient diabetes control and do not make any inferences about causality; there may be issues with endogeneity.
7. Conclusion
CHCs act as a key point of access for diabetes care and management for millions of Americans. Our results highlight several factors contributing to variation in diabetes outcomes across CHCs. Findings from this study have sociological, practical, and methodological implications for our understanding of diabetes care and inequalities. First, the management of diabetes at CHCs serving predominantly Black, Hispanic, or American Indian patients tends to be poorer when patients live in predominantly White areas. These findings underscore the importance of considering regional racial context when examining racial inequalities in diabetes outcomes. Future research should continue to explore why health outcomes are poorer at clinics when racial minority patients are more racially isolated. Second, we find evidence that CHC staffing is associated with diabetes management. Diabetes control tends to be better among patients when there is greater integration of behavioral health into staffing mix models. From a practical standpoint, in order to improve HbA1C control among their diabetes patients, CHCs may want to increase their investment in behavioral health professionals. Finally, findings have methodological implications for the way in which health care operations are evaluated. Adopting a nuanced measurement of efficiency, that accounts for both variation in staffing operations and quality of care, may be useful for researchers and health policymakers searching for specific practices that are efficient and effective for improving patient outcomes. By identifying sociodemographic and operational characteristics associated with better hemoglobin control among diabetes patients, the current study contributes to our understanding of both health care operations and health inequalities.
Supplementary Material
Research Highlights.
Rates of uncontrolled diabetes varies across community health centers (CHCs)
Diabetes control is worse at CHCs serving minorities living in White areas
CHCs with more behavioral health staff had lower rates of uncontrolled diabetes
Greater efficiency in CHC operations is associated with better diabetes control
Funding Acknowledgement
Research reported in this manuscript was supported by the National Institute of General Medical Sciences of the National Institutes of Health under Award Number P20GM104417. The content is solely the responsibility of the authors and does not necessarily represent the official views of the National Institutes of Health.
Footnotes
Publisher's Disclaimer: This is a PDF file of an unedited manuscript that has been accepted for publication. As a service to our customers we are providing this early version of the manuscript. The manuscript will undergo copyediting, typesetting, and review of the resulting proof before it is published in its final form. Please note that during the production process errors may be discovered which could affect the content, and all legal disclaimers that apply to the journal pertain.
References
- Aday LA, & Andersen R (1974). A framework for the study of access to medical care. Health Services Research, 9(3), 208. [PMC free article] [PubMed] [Google Scholar]
- Amado CAF, & Dyson RG (2009). Exploring the use of DEA for formative evaluation in primary diabetes care: An application to compare English practices. Journal of the Operational Research Society, 60(11), 1469–1482 [Google Scholar]
- American Academy of Family Physicians. (2017). UDS Mapper. Retrieved from www.udsmapper.org
- American Diabetes Association. (2003). Tests of glycemia in diabetes. Diabetes Care, 26(suppl 1), s106–s108. [DOI] [PubMed] [Google Scholar]
- American Diabetes Association. (2018a). Economic costs of diabetes in the US in 2017. Diabetes care, 41(5), 917–928. [DOI] [PMC free article] [PubMed] [Google Scholar]
- American Diabetes Association. (2018b). Standards of Medical Care in Diabetes-2018 Abridged for Primary Care Providers. Clinical diabetes: a publication of the American Diabetes Association, 36(1), 14. [DOI] [PMC free article] [PubMed] [Google Scholar]
- Andersen R, & Newman JF (2005). Societal and individual determinants of medical care utilization in the United States. The Milbank Quarterly, 83(4), Online-only. [PubMed] [Google Scholar]
- Centers for Disease Control and Prevention. (2017). National diabetes statistics report, 2017. Atlanta, GA: Centers for Disease Control and Prevention, US Department of Health and Human Services. [Google Scholar]
- Centers for Medicare and Medicaid Services. (2017). CMS Regional Offices. Retrieved from https://www.cms.gov/Medicare/Coding/ICD10/CMS-Regional-Offices.html
- Chan KS, Gaskin DJ, Dinwiddie GY, & McCleary R (2012). Do diabetic patients living in racially segregated neighborhoods experience different access and quality of care?. Medical care, 50(8), 692. [DOI] [PMC free article] [PubMed] [Google Scholar]
- Chin MH, Cook S, Jin L, Drum ML, Harrison JF, Koppert J, … & Chiu SC (2001). Barriers to providing diabetes care in community health centers. Diabetes care, 24(2), 268–274. [DOI] [PubMed] [Google Scholar]
- Clement JP, Valdmanis VG, Bazzoli GJ, Zhao M, & Chukmaitov A (2008). Is more better? An analysis of hospital outcomes and efficiency with a DEA model of output congestion. Health Care Management Science, 11(1), 67–77. [DOI] [PubMed] [Google Scholar]
- De Berardis G, Pellegrini F, Franciosi M, Belfiglio M, Di Nardo B, Greenfield S, … & Valentini M (2004). Quality of care and outcomes in type 2 diabetic patients: a comparison between general practice and diabetes clinics. Diabetes care, 27(2), 398–406. [DOI] [PubMed] [Google Scholar]
- Deily ME, & McKay NL (2006) Cost inefficiency and mortality rates in Florida hospitals. Health Economics, 15, 419–431. [DOI] [PubMed] [Google Scholar]
- Gamble E, Thorsen A, & Black L (2019). Expanding Strategic Opportunities in Nonprofits: Mapping the Interdependencies of Critical Performance Variables. Nonprofit and Voluntary Sector Quarterly, 48(3), 616–632. [DOI] [PMC free article] [PubMed] [Google Scholar]
- Gaskin DJ, Thorpe RJ Jr, McGinty EE, Bower K, Rohde C, Young JH, … & Dubay L (2014). Disparities in diabetes: the nexus of race, poverty, and place. American journal ofpublic health, 104(11), 2147–2155. [DOI] [PMC free article] [PubMed] [Google Scholar]
- Grintsova O, Maier W, & Mielck A (2014). Inequalities in health care among patients with type 2 diabetes by individual socio-economic status (SES) and regional deprivation: a systematic literature review. International journal for equity in health, 13(1), 43. [DOI] [PMC free article] [PubMed] [Google Scholar]
- Hassan K, Loar R, Anderson BJ, & Heptulla RA (2006). The role of socioeconomic status, depression, quality of life, and glycemic control in type 1 diabetes mellitus. The Journal of pediatrics, 149(4), 526–531. [DOI] [PubMed] [Google Scholar]
- Health Resources and Services Administration. (2015a). 2015 Health Center Data - Health Center Program Grantee Data. Retrieved from https://bphc.hrsa.gov/uds/datacenter.aspx?year=2015
- Health Resources and Services Administration. (2020). Health Center Program Terms and Definitions. Retrieved from https://www.hrsa.gov/sites/default/files/grants/apply/assistance/Buckets/definitions.pdf
- Hilliard ME, Joyce P, Hessler D, Butler AM, Anderson BJ, & Jaser S (2016). Stress and A1c among people with diabetes across the lifespan. Current diabetes reports, 16(8), 67. [DOI] [PMC free article] [PubMed] [Google Scholar]
- Hirsch JD, Bounthavong M, Arjmand A, Ha DR, Cadiz CL, Zimmerman A, Ourth H, Morreale AP, Edeman SV, & Morello CM (2017). Estimated Cost-Effectiveness, Cost Benefit, and Risk Reduction Associated with an Endocrinologist-Pharmacist Diabetes Intense Medical Management “Tune-Up” Clinic. Journal of Managed Care & Specialty Pharmacy, 23(3), 318–326. [DOI] [PMC free article] [PubMed] [Google Scholar]
- Huang ES, Zhang Q, Brown SES, Drum ML, Meltzer DO, & Chin MH. (2007). The Cost-Effectiveness of Improving Diabetes Care in U.S. Federally Qualified Community Health Centers. Health Services Research, 42(6), 2174–2193. [DOI] [PMC free article] [PubMed] [Google Scholar]
- Hunt MO, Wise LA, Jipguep MC, Cozier YC, & Rosenberg L (2007). Neighborhood racial composition and perceptions of racial discrimination: Evidence from the Black Women’s Health Study. Social Psychology Quarterly, 70(3), 272–289. [Google Scholar]
- Jha AK, Orav EJ Dobson A, Book RA, & Epstein AM. (2009). Measuring Efficiency: The Association of Hospital Costs and Quality of Care. Health Affairs, 28(3), 897–906. [DOI] [PubMed] [Google Scholar]
- Kershaw KN, & Pender AE (2016). Racial/ethnic residential segregation, obesity, and diabetes mellitus. Current diabetes reports, 16(11), 108. [DOI] [PubMed] [Google Scholar]
- Kirk JK, D’Agostino RB, Bell RA, Passmore LV, Bonds DE, Karter AJ, & Narayan KV (2006). Disparities in HbA1c levels between African-American and non-Hispanic white adults with diabetes: a meta-analysis. Diabetes care, 29(9), 2130–2136. [DOI] [PMC free article] [PubMed] [Google Scholar]
- Kirk JK, Passmore LV, Bell RA, Narayan KV, D’Agostino RB, Arcury TA, & Quandt SA (2008). Disparities in A1C levels between Hispanic and non-Hispanic white adults with diabetes: a meta-analysis. Diabetes care, 31(2), 240–246. [DOI] [PubMed] [Google Scholar]
- Kralewski JE, Dowd BE, & Xu YW (2012). Medical Groups Can Reduce Costs By Investing In Improved Quality of Care For Patients With Diabetes. Health Affairs, 31(8), 1830–1835. [DOI] [PubMed] [Google Scholar]
- Ku L, Frogner BK, Steinmetz E, & Pittman P (2015). Community health centers employ diverse staffing patterns, which can provide productivity lessons for medical practices. Health Affairs, 34(1), 95–103. [DOI] [PubMed] [Google Scholar]
- Laraia BA, Karter AJ, Warton EM, Schillinger D, Moffet HH, & Adler N (2012). Place matters: neighborhood deprivation and cardiometabolic risk factors in the Diabetes Study of Northern California (DISTANCE). Social science & medicine, 74(7), 1082–1090. [DOI] [PMC free article] [PubMed] [Google Scholar]
- Litaker D, MION LC, Planavsky L, Kippes C, Mehta N, & Frolkis J (2003). Physician-nurse practitioner teams in chronic disease management: the impact on costs, clinical effectiveness, and patients’ perception of care. Journal of interprofessional care, 17(3), 223–237. [DOI] [PubMed] [Google Scholar]
- Luo E (2015). Increasing Cost Efficiency in Health Care without Sacrificing the Human Touch. American Medical Association Journal of Ethics, 17(11), 1059–1063. [DOI] [PubMed] [Google Scholar]
- McGarvey RG, Thorsen A, Thorsen ML, & Madhi Reddy R (2019). Measuring efficiency of community health centers: a multi-model approach considering quality of care and heterogeneous operating environments. Health Care Management Science, 22, 489–511. [DOI] [PMC free article] [PubMed] [Google Scholar]
- McGlynn EA (2008). Identifying, categorizing, and evaluating health care efficiency measures. AHRQ Publication No. 08(0030), 214p.
- Menor LJ, Roth AV, & Mason CH (2001). Agility in retail banking: A numerical taxonomy of strategic service groups. Manufacturing & Service Operations Management, 3(4), 273–292. [Google Scholar]
- Nylund KL, Asparouhov T, & Muthen BO (2007). Deciding on the number of classes in latent class analysis and growth mixture modeling: A Monte Carlo simulation study. Structural equation modeling, 14(4), 535–569. [Google Scholar]
- Peyrot M, McMurray JF, & Kruger DF (1999). A biopsychosocial model of glycemic control in diabetes: Stress, coping, and regimen adherence. Journal of Health and Social Behavior, 40(2), 141–158. [PubMed] [Google Scholar]
- Proser M, Bysshe T, Weaver D, & Yee R (2015). Community health centers at the crossroads: Growth and staffing needs. Jaapa, 28(4), 49. [DOI] [PMC free article] [PubMed] [Google Scholar]
- Quandt SA, Bell RA, Snively BM, Smith SL, Stafford JM, Wetmore LK, & Arcury TA (2005). Ethnic disparities in glycemic control among rural older adults with type 2 diabetes. Ethnicity & disease, 15(4), 656. [PMC free article] [PubMed] [Google Scholar]
- Reiss-Brennan B, Brunisholz KD, Dredge C, Briot P, Grazier K, Wilcox A, … & James B (2016). Association of integrated team-based care with health care quality, utilization, and cost. Jama, 316(8), 826–834. [DOI] [PubMed] [Google Scholar]
- Robbins JM, Vaccarino V, Zhang H, & Kasl SV (2005). Socioeconomic status and diagnosed diabetes incidence. Diabetes research and clinical practice, 68(3), 230–236. [DOI] [PubMed] [Google Scholar]
- Rosenblatt RA, Andrilla CHA, Curtin T, & Hart LG (2006). Shortages of medical personnel at community health centers: implications for planned expansion. JAMA, 295(9), 1042–1049. [DOI] [PubMed] [Google Scholar]
- Roth A, Tucker AL, Venkataraman S, & Chilingerian J (2019). Being on the productivity frontier: Identifying “triple aim performance” hospitals. Production and Operations Management, 28(9), 2165–2183. [Google Scholar]
- Russo P, & Adler A (2015). Health Care Efficiency: Measuring the Cost Associated with Quality. Managed Care, 24(7), 38–44. [PubMed] [Google Scholar]
- Sherman HD, & Zhu J (2006). Service productivity management: improving service performance using Data Envelopment Analysis (DEA): Springer science & business media. [Google Scholar]
- Testi A, Fareed N, Ozcan YA, & Tanfani E (2013). Assessment of physician performance for diabetes: a bias-corrected data envelopment analysis model. Quality in Primary Care 21, 345–57. [PubMed] [Google Scholar]
- Toussaint JS, & Berry LL (2013, January). The promise of Lean in health care. In Mayo clinic proceedings (Vol. 88, No. 1, pp. 74–82). Elsevier. [DOI] [PubMed] [Google Scholar]
- Thorsen ML, Thorsen A, & McGarvey R (2019). Operational efficiency, patient composition and regional context of US health centers: Associations with access to early prenatal care and low birth weight. Social Science & Medicine, 226, 143–152. [DOI] [PMC free article] [PubMed] [Google Scholar]
- Vinikoor LC, Kaufman JS, MacLehose RF, & Laraia BA (2008). Effects of racial density and income incongruity on pregnancy outcomes in less segregated communities. Social science & medicine, 66(2), 255–259. [DOI] [PubMed] [Google Scholar]
- Walker RJ, Williams JS, & Egede LE (2016). Influence of race, ethnicity and social determinants of health on diabetes outcomes. The American journal of the medical sciences, 351(4), 366–373. [DOI] [PMC free article] [PubMed] [Google Scholar]
- Wanke P, & Aktas E (2018). Efficiency of Diabetes Treatment In Operations Research Applications in Health Care Management, Kahraman C, & Topcu YI, (eds). Springer International Publishing, pp. 351–377. [Google Scholar]
- White K, & Borrell LN (2011). Racial/ethnic residential segregation: framing the context of health risk and health disparities. Health & place, 17(2), 438–448. [DOI] [PMC free article] [PubMed] [Google Scholar]
- White K, Haas JS, & Williams DR (2012). Elucidating the role of place in health care disparities: the example of racial/ethnic residential segregation. Health services research, 47(3pt2), 1278–1299. [DOI] [PMC free article] [PubMed] [Google Scholar]
- Zhang X, Bullard KM, Gregg EW, Beckles GL, Williams DE, Barker LE, … & Imperatore G (2012). Access to health care and control of ABCs of diabetes. Diabetes Care, 35(7), 1566–1571. [DOI] [PMC free article] [PubMed] [Google Scholar]
Associated Data
This section collects any data citations, data availability statements, or supplementary materials included in this article.