

Abstract
Auditory attention allows us to focus on relevant target sounds in the acoustic environment while maintaining the capability to orient to unpredictable (novel) sound changes. An open question is whether orienting to expected vs. unexpected auditory events are governed by anatomically distinct attention pathways, respectively, or by differing communication patterns within a common system. To address this question, we applied a recently developed PeSCAR analysis method to evaluate spectrotemporal functional connectivity patterns across subregions of broader cortical regions of interest (ROIs) to analyze magnetoencephalography data obtained during a cued auditory attention task. Subjects were instructed to detect a predictable harmonic target sound embedded among standard tones in one ear and to ignore the standard tones and occasional unpredictable novel sounds presented in the opposite ear. Phase coherence of estimated source activity was calculated between subregions of superior temporal, frontal, inferior parietal, and superior parietal cortex ROIs. Functional connectivity was stronger in response to target than novel stimuli between left superior temporal and left parietal ROIs and between left frontal and right parietal ROIs, with the largest effects observed in the beta band (15–35 Hz). In contrast, functional connectivity was stronger in response to novel than target stimuli in inter-hemispheric connections between left and right frontal ROIs, observed in early time windows in the alpha band (8–12 Hz). Our findings suggest that auditory processing of expected target vs. unexpected novel sounds involves different spatially, temporally, and spectrally distributed oscillatory connectivity patterns across temporal, parietal, and frontal areas.
Keywords: Magnetoencephalography, auditory, attention, oscillation, network
Introduction
Selective attention to relevant auditory information (or “targets”) while simultaneously maintaining the capability for orienting to unexpected (or “novel”) sound events is critical for our everyday communication. Dynamic brain activation patterns that emerge during “endogenous” attentive processing of auditory targets and “exogenous” orienting to novelty have been well documented using EEG and MEG. Target sounds that occur among repetitive “standard” sounds elicit a N2/P3b component complex, whose main cortical generators are thought encompass posterior auditory association areas and the temporoparietal junction (Knight et al. 1989; Polich 2007). Unexpected novel sounds in turn elicit an auditory cortical mismatch negativity process that is followed by a prefrontally generated P3a component (Näätänen 1992; Polich 2007). These MEG/EEG measures of auditory detection and orienting have been extensively used for clinically oriented research. However, the way the different temporal, parietal, and frontal areas involved in target-related vs. novelty-related auditory processing work together is still poorly known.
Accumulating evidence exists that communication between distant groups of neurons can be quantified by examining the inter-regional synchronization of neuronal oscillations. These oscillatory synchronization patterns may occur at different frequency bands, which have functionally distinct roles in attention and brain function (Doesburg et al. 2005; Fries 2015; Jensen et al. 2007; Panagiotaropoulos et al. 2012; Tallon-Baudry and Bertrand 1999; Womelsdorf et al. 2007). Increased inter-regional phase-coherence in the >30 Hz gamma range has been associated with exogenous (or bottom-up) shifts of visual attention (Buschman and Miller 2007), whereas oscillations in the 13–30 Hz beta range appear better suited for long-range coupling that underlies endogenous (or top-down) communication (Buschman and Miller 2007; Engel et al. 2001; Kopell et al. 2010; von Stein and Sarnthein 2000). In contrast, alpha oscillations (8–12 Hz) have been consistently linked to functional inhibition during visual attention (Hanslmayr et al. 2007; Jensen and Mazaheri 2010; Kelly et al. 2006; Rihs et al. 2009; Romei et al. 2008; Snyder and Foxe 2010; Thut et al. 2006; Worden et al. 2000).
Thus far, however, the association of functional roles with neuronal oscillatory synchronization has not been equally well established in the domain of auditory attention. The number of auditory studies on this topic is overall relatively small (Huang et al. 2014a; Muller and Weisz 2012; Weisz et al. 2014). During a visually cued auditory attention task, alpha power was found to be increased in right auditory cortex areas, which were, further, phase-synchronized to frontal areas in the lower alpha range (Muller and Weisz 2012). Also, Weisz et al. (2014) found a lower beta (14 Hz) band effective connectivity from right inferior parietal to auditory cortex in the pre-target period, supporting the general notion that beta oscillations mediate top-down processing (Bastos et al. 2015; Buschman and Miller 2007; Khan et al. 2018; Siegel et al. 2012). There is also evidence that cortical alpha oscillations mediate selective inhibition of irrelevant inputs during auditory speech processing (Ahveninen et al. 2017; Strauss et al. 2014).
Based on visual studies, it has been proposed that endogenous vs. exogenous orienting functions are founded on distinct dorsal vs. ventral attention systems in the human brain (Corbetta and Shulman 2002). In the auditory domain, however, the theory of distinct endogenous and exogenous attention pathways has been only partially supported (Huang et al. 2012; Salmi et al. 2009). It is thus possible that a more general attention system is recruited, but in different ways (Kim et al. 1999; Rosen et al. 1999), also for auditory target vs. endogenous processes that underlie the generation of ERP responses such as target P3b vs. novelty P3a. This could occur, for example, through slightly differing combinations of smaller subregions of the general attention network that communicate via differing synchronization patterns of neuronal oscillations depending on the type of attention task (Buschman and Miller 2007). Examining these ideas using non-invasive recordings in humans has, however been challenging, due to the lack of methods suitable for hypothesis testing across highly multidimensional activation and inter-regional connectivity patterns (Mamashli et al. 2019a).
Here, we applied a recently introduced Permutation-Statistics-for-Connectivity-Analysis-between Regions-of-interest (PeSCAR) approach, particularly developed for functional connectivity analysis in time and frequency among subregions of broader cortical regions of interest (ROIs), to investigate connectivity patterns during endogenous vs. exogenous auditory attention (Mamashli et al. 2019b). To this end, we used MEG data that had been previously collected during a dichotic auditory selective attention task. In this task, subjects were cued to detect a target sound presented among standard tones to one ear and ignore the occasional novel sounds presented in the opposite ear. (Other aspects of this data set are published in Ahveninen et al. (2013) and Huang et al. (2014a).) Given the previous findings of frequency-specific connectivity patterns, we hypothesized that detecting target sounds is associated with stronger interregional phase-coherence in the beta band, that exogenous orienting toward task-irrelevant novel sounds is associated with stronger phase-coherence in the alpha band.
Materials and Methods
Subjects
The study sample consisted of thirteen right-handed and normal-hearing subjects (19–43 years, 7 females). The data of three subjects of an initial sample of 16 were excluded because of insufficient signal-to-noise ratio (SNR) for our dynamic spectrotemporal connectivity analyses. All procedures were approved by the Institutional Review Board of Massachusetts General Hospital. All subjects gave their informed consent before participating in the study.
Stimuli and Task
The subjects preformed an auditory selective attention task, during which MEG data was recorded. Ten-second sound trials were presented in random order (Fig. 1). In most trials, a monaural 250-ms buzzer cue was delivered to the ear which the subsequent target sound was likely to be delivered. The target sound consisted of a combination of 800 and 1500-Hz pure tones of 50-ms duration. The cue and target sounds were embedded within streams of 50-ms pure-tones presented randomly to the right (800 Hz) or left ear (1500 Hz). To investigate exogenous attention, in 20% of the trials, the target was replaced by task-irrelevant novel sound presented opposite to the cued ear. These novel sounds, which are known to elicit strong exogenous auditory attention effects (Alho et al. 1998; Knight 1984), consisted of eight spectrotemporally complex environmental and synthetic sounds whose peak intensities. The design also included 20% of “catch trials” with a cue but no target or novel stimuli and another 20% of catch trials with no cue, novel, or target stimuli.
Fig. 1:

Experiment design: The cued auditory attention task consisted of randomly ordered 10-s trials. During most trials the subject heard a cue in the ear where a target, a harmonic sound within pure-tone trains, was likely to subsequently appear. The subjects were asked to attend to the cued ear and to press a button as quickly as possible after a target. Novel sounds, which occasionally occurred opposite to the cued ear, and the pure tones appearing in the opposite ear were to be ignored. Each trial ended to a binaural trial-end signal sound. In addition to the Target (40%) and Novel trials (20%), the paradigm included 20 % of cued catch trials with no target and 20% of trials with pure tones only (not shown).
The stimuli were presented at 55 dB over the subjective hearing threshold. At 7.82 s after the trial onset, the subjects heard a 2.18-s binaural complex sound that served as a Trial-End Signal. In each trial, a total of 13 auditory stimuli were presented, starting 0.12 s after the offset of preceding Trial-End Signal and ending on average 1.3 s before the subsequent one. Within the sequence of the 13 sounds, the stimulus onset asynchrony (SOA) was 350–750 ms. The SOA varied quasi randomly such that there was always at least 650 ms silence after each cue, target, and novel stimulus.
In each trial, the subjects were to look at a centered fixation mark and wait for the cue. The subjects were advised to shift their attention to the cued ear, pay close attention to the tones delivered to this ear, ignore the sounds presented to the opposite ear, and press a button with the right index finger as rapidly as possible after hearing the target.
Data were recorded in two 37-minute runs, with 220 trials in each run. A standardized computerized approach taking about 5 min was utilized to teach the task to the subjects before the recordings. In subsequent analyses, individual trials with target-detection responses beyond the subject’s mean±2SD reaction time were considered outliers.
Data acquisition and preprocessing
306-channel MEG (Elekta-Neuromag, Helsinki, Finland) was recorded in a magnetically shielded room (600 samples/s, passband 0.01–192 Hz). The position of the head relative to the sensor array was monitored continuously using four head position indicator coils attached to the scalp. Vertical and horizontal electrooculograms (EOG) were recorded to monitor blinks and eye movements. External MEG noise was suppressed and subjects’ head movements were compensated for using the signal-space separation method (Taulu et al. 2005) (Maxfilter, Elekta-Neuromag, Helsinki, Finland). The MEG data were then down-sampled (300 samples/s, passband 0.5–100 Hz) and 1400-ms epochs were extracted, starting at 400 ms prior to the stimulus onset. Epochs coinciding with over 150 μV EOG or 2000 fT/cm MEG sensor-data changes were excluded from further analyses. Epochs were combined for attend to left and right trials for both target and novel conditions because the focus of this study was not to investigate the lateralization effect of attention. To maintain comparable SNR in all analyses, we used equal numbers of epochs across the two conditions (around 75 in each participant).
In a separate MRI session, Tl-weighted anatomical data were obtained to support cortically-constrained MEG source analysis using a multi-echo MPRAGE pulse sequence (TR=2510 ms; 4 echoes with TEs = 1.64 ms, 3.5 ms, 5.36 ms, 7.22 ms; 176 sagittal slices with l×l×l mm3 voxels, 256×256 mm2 matrix; flip angle = 7°). Cortical surface representations were constructed from the anatomical MRI data using FreeSurfer 5.0 (http://surfer.nmr.mgh.harvard.edu/). Individual subjects were co-registered to an average representation using spherical morphing based on the sulcal and gyral patterns (Fischl et al. 1999).
Regions of interest
Our ROIs were selected from the Freesurfer parcellation (Desikan-Killiany Atlas) and covered eight regions, four in each hemisphere: bilateral (i) superior temporal gyrus (STG), (ii) frontal region including inferior frontal, rostral middle frontal, caudal middle frontal, lateral orbitofrontal cortex, (iii) inferior parietal region, and (iv) superior parietal region. These regions were selected a priori, based on the extensive evidence that they are all involved in auditory attention (Ahveninen et al. 2011; Alho et al. 2003; Grady et al. 1997; Hansen and Hillyard 1980; Hillyard et al. 1973; Huang et al. 2012; Mayer et al. 2006; Petkov et al. 2004; Shomstein and Yantis 2004; Woldorff et al. 1998; Wu et al. 2007; Zatorre et al. 1999) and that they may show distinct functional connectivity patterns during different forms of auditory attention (Rossi et al. 2014). For the PeSCAR analysis, each large ROI was divided into smaller sub-ROIs (Mamashli et al. 2019a); we used an automatic routine “mris_divide_parcellation” (using equal size principle) available in the Freesurfer package to make all sub-ROIs in all ROIs to be of approximately the same size.
Note that we did not include intra-hemispheric connectivity between the inferior parietal and superior parietal ROIs because these ROIs are adjacent to each other, and therefore, the reliability of the results could be potentially affected by strong cross-talk effects in the MEG source estimates.
Sub-ROI time series extraction
Cortical activation was estimated using ℓ2 minimum-norm estimates (MNE) (Hämäläinen and Ilmoniemi 1994). The source space consisted of ~25,000 current dipoles in each hemisphere, placed on the cortical surface. The electrical conductivity properties of the head were modeled using a three-compartment (brain, skull, scalp) boundary element model (Hämäläinen and Sarvas 1989). For the inverse estimation, the source orientations were assumed perpendicular to the cortical surface (Lin et al. 2006). Noise covariance was estimated from a separate resting-state MEG data set. Single-epoch MEG sensor time series were multiplied by the inverse operator and noise normalized to yield the estimated cortical activity as a function of time (Dale et al. 2000).
Estimated source time courses for all epochs were computed for all vertices within each sub-ROI, generating a Λ × N × T matrix, where Λ is the number of vertices, N is the number of epochs and T is the number of time points. The source time courses within each sub-ROI were aligned with the dominant component of the multivariate set of time series, to reduce cancellation due to the ambiguity of dipole orientations across the vertex locations. To accomplish this, we first concatenated all the epochs for each vertex in a vector and then conducted a singular value decomposition of the data. The sign of the dot product between the first left singular vector and all other time-series in a sub-ROI was then computed. If this sign was negative, we inverted the time-series before averaging over all time courses of a sub-ROI. The time series data of each sub-ROI was then arranged into an N × T matrix.
For time-frequency decomposition, each epoched time series was convolved with a dictionary of complex Morlet wavelets, transforming the real 2D matrix into complex N × T × F matrix, where F is the number of frequencies. We used 7 cycles in Morlet wavelets for all frequencies between 7–60 Hz selected on a 36-point logarithmic scale (Kitzbichler et al. 2015).
Functional connectivity
To estimate functional connectivity between ROIs, we used phase coherence, which is a measure of the consistency of phase difference across epochs (Lachaux et al. 1999). Pairs of ROIs were indexed with (I,J), where 1 ≤ I ≤ K − 1, and I + 1 ≤ ] ≤ K; K = 8 is the number of ROIs. Lower case letters (i,j) were used to index sub-ROIs. Separately for each condition (i.e., Target and Novel), phase-coherence was estimated between each sub-ROI pair (Ii,Jj), for all frequencies and time points. Here, the sub-ROI indices are i = 1, …,KI,, and j = 1, …,Kj, where KI, and Kj are the maximum number of sub-ROIs in ROI/ and ROIj, respectively. Note that the connectivity was computed only between sub-ROIs that belonged to different ROIs. To evaluate differences in the coherence between the Target and Novel conditions, we used phase-coherence Z statistics (Maris et al. 2007):
where is the phase coherence between sub-ROI Ii and Jj in time and frequency in the target and novel conditions, and N is the number of epochs. The use of ZCoh avoids statistical bias due to the non-Gaussian distribution of the phase-coherence (Maris et al. 2007). All statistics on the ZCoh were focused on the time window of 0 to 600 ms and on the frequencies range of 7 to 60 Hz.
The PeSCAR analysis strategy for evaluating the multidimensional connectivity patterns is depicted in Fig. 2. For the connectivity between a pair of sub-ROIs (Fig. 2A), cluster-based statistics were applied over both time and frequency (Maris and Oostenveld 2007). We used p < 0.05 as the initial threshold, 500 permutations of conditions, and one-sample t-tests as the test statistics. It is worth noting that the ZCoh is approximately normally distributed (Maris et al, 2007). The output of the cluster-based statistic included a p-value, cluster mask, and cluster mass for each cluster. If the p-value was smaller than 0.05, the cluster was considered significant. The cluster mask is a matrix of ones and zeros, indicating which time-frequency bins did or did not belong to a cluster, respectively. The cluster mass was defined as the sum of the t-values of all time-frequency bins inside the cluster: a positive cluster mass meant Target> Novel, negative Novel>Target.
Fig. 2:

A schematic display of the statistical analysis for the comparison of functional connectivity between Target vs Novel conditions. (A) An example of two ROIs that encompass STG and inferior parietal areas. ZCoh was computed for each sub-ROI connection, with KI, = 9 and Kj = 9 sub-ROIs. (B) Cluster-based statistics using one sample t-tests were done on the ZCoh values across all subjects at each sub-ROI pair. Two 2D matrixes were generated based on the p-values and the sign of cluster masses. (C) Target and Novel data were permuted and the cluster statistics repeated 500 times to generate the null distribution. (D) Two p-values were assigned for Target> Novel (left panel) and Novel> Target (right panel) by comparing the total ROI connectivity (sum of cluster masses in the sub-ROI connectivity matrix) with the null distribution.
To determine the statistical significance of the (total) connectivity between main ROIs (Fig. 2B), the “cluster mass” of sub-ROI connectivity values that exceeded the initial cluster-forming threshold (p < 0.05) were collected into two KI × Kj matrices, one for Target> Novel and one for Novel>Target, for each ROI pair (I,J). The matrix elements corresponding to below-threshold sub-connections were set to zero. The sums of the cluster masses of all sub-ROI pairs that exceeded the initial threshold were called “(total) ROI connectivity” for an ROI pair (I,J). To estimate the null distribution of the total ROI connectivity, we randomly changed the sign of ZCoh (i.e., switched the Target and Novel condition labels) at the subject level 500 times, without repetition, and conducted the cluster-based statistics for each sub-ROI pair (Ii,Jj) again (Mamashli et al., 2019a) (Figs. 2C, D). This permutation resulted in two matrices of 500 × KI × Kj values as a null distribution (for Target> Novel and Novel>Target). The null distributions thus obtained were compared with the non-permuted total ROI connectivity values, resulting in one p-value for Target> Novel and one for Novel>Target for a pair of ROIs. These p-values were multiplied by a factor of two to adjust for the two comparisons. Please note that the null distribution accounts for the source leakage problem between the sub-ROIs because the null distribution employs the same statistics as the non-shuffled data. If a certain sub-ROI pair connection becomes significant due to strong source leakage, the same will occur with the shuffled data as well. Furthermore, our shuffling scheme only permutes across the conditions and not across ROIs.
To make a clear distinction between inferential and descriptive results (Maris and Oostenveld 2007; Winer et al. 1991), we note that the main statistic for inferring significance was the total ROI connectivity (sum of cluster masses). In addition, we describe properties of the data by visualizing the time-frequency and sub-region maps of the ROI pairs. Specifically, representations of the spectrotemporal differences between the Target and Novel conditions for each ROI pair were obtained by summing the t-value-weighted time-frequency cluster masks across all significant pairs of sub-ROI connections (Fig. 2B). To display the anatomical distribution of the subconnections that contributed to each of the significant main-ROI connections, the numbers of above-threshold connections for each sub-ROI were visualized with color-coding on the cortical surface.
One advantage of the PeSCAR approach is that it enables the identification of multidimensional connectivity patterns with spectral, temporal, and spatial specificity (Mamashli et al, 2019a). Unlike many previous approaches using spatial cluster analysis (e.g., Huang et al. 2014b), the PeSCAR method does not require that the observed activity extends continuously over a cortical region (Mamashli et al, 2019a). This is addressed in PeSCAR by dividing each ROI into sub-ROIs. This approach is derived from the fact that cortically constrained MEG and EEG source estimates are typically spatially discontinuous due to selective sensitivity to source orientation, cancellation effects (Ahlfors et al. 2010), and complex point-spread over sulcal and gyral convolutions. In addition, PeSCAR offers higher statistical power in contrast to traditional connectivity statistical approaches when the signal-to-noise ratio is low. For example, our previous simulations indicated that if the estimated activity is spatially continuous with SNR = 2.5, PeSCAR offers >80% statistical power, whereas with conventional averaging one would need to almost double this SNR to obtain the same statistical power (Mamashli et al, 2019). Matlab scripts implementing PeSCAR are available online through our github repository (https://github.com/fmamashli/run_PeSCAR).
Regional activation (source power)
In addition to the connectivity analysis, we also examined the regional activation within each ROI by computing the power of the time-frequency representation for the estimated sub-ROI source time courses. Estimating differences in the magnitude of activation between the Target and Novel conditions is of interest not only for characterizing the attention-related neural processes, but also to identify potential confounding effects in the connectivity analysis (Lowet et al. 2016). Relative power values in the post stimulus interval (0 to 600 ms) were computed with respect to the mean power in the pre-stimulus baseline interval (−200 to 0 ms). The power estimates were calculated separately for each condition, subject, and sub-ROI.
Time-frequency cluster statistics was used to identify significant differences in the power between two conditions in each sub-ROI. We used p < 0.05 as the initial threshold, 1000 permutations and paired t-tests to compare the Target and Novel conditions. The statistical significance was determined by a cluster-based randomization test. To estimate the null distribution of the ROI power, we randomly permuted the two conditions for 500 times, without repetition, and conducted the cluster-based statistics for each sub-ROI again. By permuting the two conditions’ data 500 times and repeating the cluster-based statistics, we ended up with a matrix of 500 × KI values as a null distribution for Target> Novel and Novel>Target. The null distribution thus obtained was compared with the non-permuted total ROI power values, resulting in one p-value for Target > Novel and one for Novel >Target for a pair of ROIs. Bonferroni correction was applied to adjust for the two comparisons. Time-frequency maps for the power were obtained the same way as for the connectivity measures, i.e., summing weighted cluster masks.
Results
Behavioral results
All subjects were capable of performing the task according to the instruction. The mean proportion or correct responses was 0.9 (SD=0.08) and the mean reaction time was 478 ms (SD=110 ms).
Functional connectivity
The PeSCAR analysis indicated that there was significantly larger phase-coherence in the Target condition compared with the Novel condition for the following two ROI pairs (Fig. 3):
Intra-hemispheric connectivity between the left inferior parietal and superior temporal ROIs (p = 0.04) (Fig. 3A). The time-frequency map of the sum of the weighted cluster masks showed largest differences in the 15–18 Hz beta band at about 50–250 ms after the stimulus onset. Within the superior temporal region, the most prominent sub-ROI connections were concentrated to regions near the primary auditory cortex.
Inter-hemispheric connectivity between the left frontal and right inferior parietal ROI (p = 0.008) (Fig. 3B). The time-frequency map showed prominent differences in lower (15–18 Hz) and higher (25–36 Hz) beta bands at 300–450 ms. The sub-ROI connections were relatively evenly distributed across the dorsal and ventral aspects of both the frontal and inferior parietal ROIs.
The analyses also indicated two ROI pairs, both inter-hemispheric, for which the phase-coherence was significantly larger in the Novel than in the Target condition:
Connectivity between the left and right superior temporal ROIs (p= 0.03), (Fig. 4A). The time-frequency map showed largest difference in the 7–11 Hz range within the first 300 ms after stimulus onset. The strongest sub-ROI connections were concentrated to posterior non-primary auditory cortex areas.
Connectivity between the left and right frontal ROIs (p = 0.008) (Fig. 4B). Largest differences were observed in the 9–12 Hz alpha band at 50–250 ms and in the 12–16 Hz low beta band at 400–600 ms. Most of the prominent sub-ROI connections were concentrated to inferior frontal regions (Fig. 4B).
Fig. 3:

ROI pairs for which the functional connectivity was stronger in the Target than in the Novel condition: (A) left STG and left inferior parietal ROIs, (B) left frontal and right inferior parietal ROIs. The left column shows time-frequency maps obtained by summing the weighted cluster masks of the significant sub-ROIs pairs. The middle column shows the sub-ROI connectivity matrices, and the right column shows color-coded the corresponding count of significant connections for each sub-ROI.
Fig. 4:

ROI pairs for which the functional connectivity was stronger in the Novel than in the Target condition: (A) left right superior temporal gyrus ROIs, (B) left and right frontal ROIs. As in Fig. 3, TF-maps (left), sub-ROI connectivity matrices (middle), and counts of significant sub-ROI connections (right) are shown.
Regional activation (source power)
The oscillatory power of the estimated source activity was found to be significantly larger in the Target compared with the Novel condition within the right frontal ROI (p = 0.008) (Fig. 5A); the time-frequency map of the sum of the weighted cluster masks showed largest power difference in the 25–35 Hz high beta band around 400–550 ms, which is close to the time of the button press; the largest sub-ROI cluster mass values were concentrated in the dorsal prefrontal area. The oscillatory power was found to be significantly larger in the Novel than in the Target condition for 4 ROIs (Fig. 5B): the right superior temporal gyrus (p = 0.008), the left inferior parietal (p = 0.04), the left superior parietal (p = 0.008), and the right superior parietal (p = 0.02) ROIs. For the right superior temporal gyrus ROI, the time-frequency map showed largest effects in an early time range (within the first 200 ms after the sound onset) in the low alpha band. For the other three, the largest effects were seen later (400–600 ms) in the alpha and beta frequency bands.
Fig. 5:
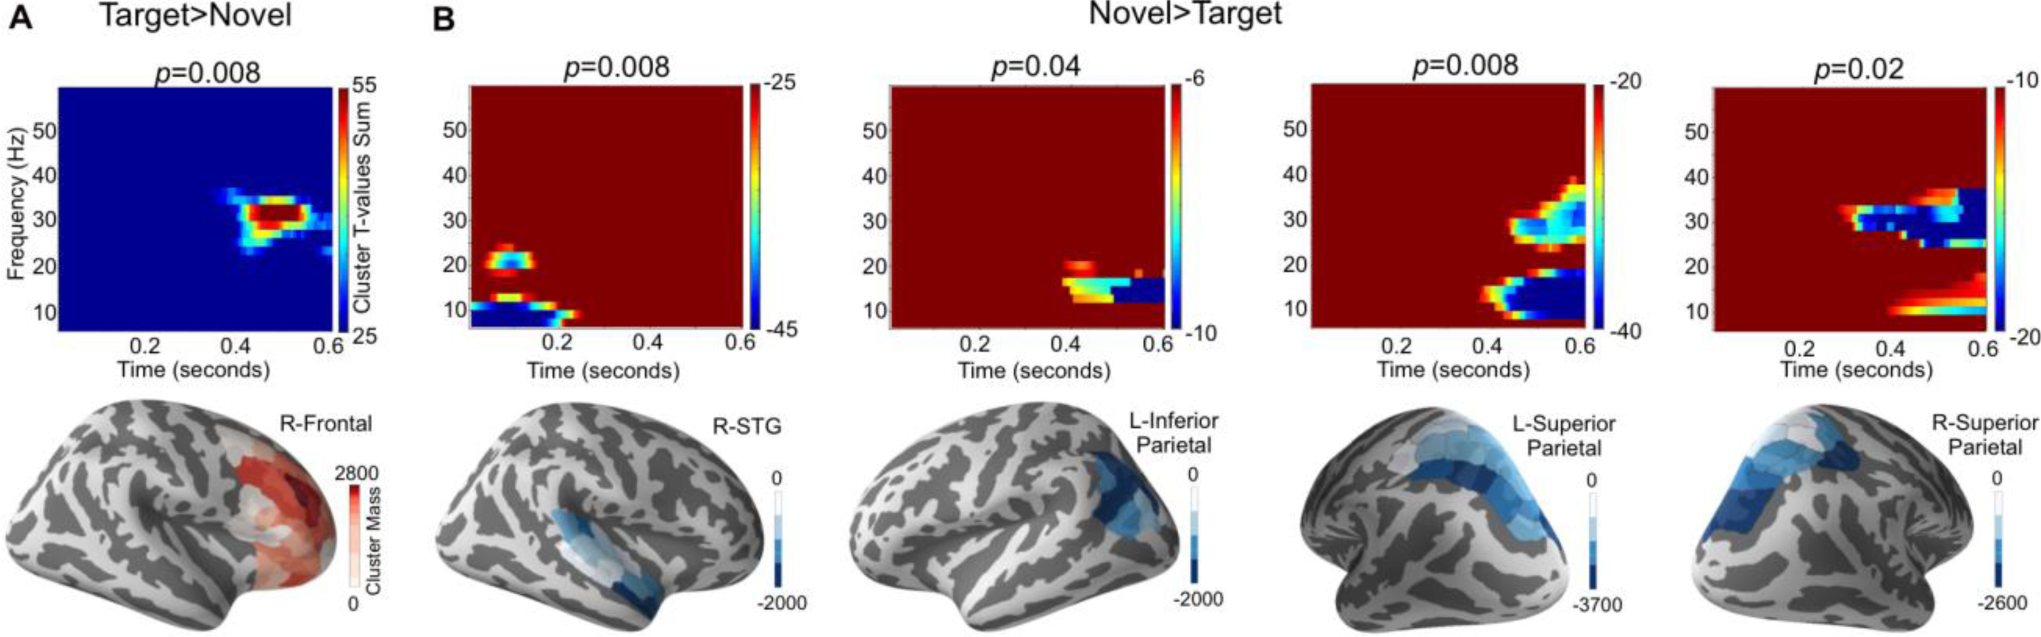
ROIs with significant differences in the power of regional oscillatory activity between the conditions: (A) Target > Novel and (B) Novel >Target. The upper row shows time-frequency maps obtained by summing the weighted cluster masks for significant clusters for all sub-ROIs. In the lower row, color-coding indicates the cluster mass for each sub-ROI.
Discussion
Here, we utilized our recently developed PeSCAR approach to estimate multidimensional patterns of inter-regional phase-coherence, to examine dynamic oscillatory networks involved in auditory attention. Our task was modified from a well-established EEG and MEG paradigms, which tap into endogenous vs. exogenous aspects of auditory processing by comparing brain responses to pre-defined targets vs. physically varying novel sounds (Alho et al. 1998; Knight 1984; Knight et al. 1989; Näätänen 1992; Polich 2007). The results suggest that endogenous vs. exogenous aspects of auditory attention could associated with spectrotemporally differing inter-regional connectivity patterns across largely overlapping subregions of frontal, parietal, and temporal areas.
Beta band oscillatory activity and endogenous target detection
We found evidence of larger long-range synchronization of parietotemporal and frontoparietal oscillations during target detection compared with the processing of novel stimuli, with the largest effects observed in the beta frequency range. Target detection requires a greater degree of endogenous attention than orienting to task-irrelevant novel stimuli. The present findings are generally consistent with previous neurophysiological studies in nonhuman primates, which suggest that beta-band synchronization between frontal and parietal regions is associated with top-down aspects of visual attention (Bastos et al. 2015; Buschman and Miller 2007). Analogous effects have also been observed in auditory MEG studies in humans, suggesting that the power of beta-band oscillatory activity is increased during top-down aspects of auditory processing (Iversen et al. 2009; Morillon and Baillet 2017). Thus, frontoparietal and parietotemporal synchronization of beta oscillations appears to play a role in endogenous auditory attention.
Alpha band activity and exogeneous novelty processing
For unexpected novel sounds, which trigger exogenous (or involuntary) attention shifting, larger inter-regional connectivity was most prominent in the alpha band. The early (up to 200 ms) difference in the low frequency range between the temporal ROIs (Fig. 4A) coincided with a difference in the regional power in the right temporal ROI (Fig. 5B); thus, the observed connectivity difference may be confounded by the power difference (Lowet et al. 2016), and could simply be related to acoustical differences between the target and novel stimuli. That said, the connectivity was more focused on auditory cortex areas, whereas the power effect was more distributed and stronger in anterior part of superior temporal cortex. In contrast, the alpha-band effect at 50–250 ms between the frontal ROIs did not coincide with potentially confounding power differences. This alpha-band connectivity effect may be related to inhibition of irrelevant inputs, to control involuntary orienting. This interpretation is supported by a host of previous studies using auditory, visual, and tactile tasks, which have reported that the power of alpha oscillations increases in cortical areas that represent task-irrelevant stimuli and/or in anticipation of distractor events (Ahveninen et al. 2012; Ahveninen et al. 2017; Bauer et al. 2012; Foxe et al. 1998; Frey et al. 2014; Haegens et al. 2011; Sokoliuk et al. 2019; Worden et al. 2000). Notably, the inhibitory role of alpha oscillations has not been limited to only sensory processing but also to higher order processing such as auditory speech comprehension (Strauss et al. 2015; Strauss et al. 2014; Wöstmann et al. 2016; Wostmann et al. 2015; Wostmann et al. 2019).
Anatomically overlapping networks in auditory attention
The present findings also contribute to the discussion on whether endogenous vs. exogenous aspects of attention are explainable by anatomically distinct or shared systems. In the dual-system theory (Corbetta and Shulman 2002), which is based on non-auditory tasks, endogenous attention was associated with a system that encompasses dorsal aspects of parietal (intraparietal sulcus, superior parietal lobule) and frontal cortices (frontal eye fields). Exogenous orienting was, in turn, theorized to be governed by ventral temporoparietal and fronto-insular cortices (Corbetta and Shulman 2002). The present results are only partially consistent with this model. For example, the beta-band connectivity effects associated with target detection were observed not only in dorsal, but also in relatively ventral subregions of both parietal and frontal cortices. This is more in line with previous fMRI-based interpretations that the human brain uses largely similar networks, but perhaps in slightly different ways or in different subcombinations, to support exogenous (or bottom-up) and endogenous (or top-down) attention (Kim et al. 1999; Peelen et al. 2004; Rosen et al. 1999).
Potential limitations and future studies
The present task was selected based on the abundance of previous studies that have used event-related EEG and MEG responses to compare event-related potential/field components elicited during endogenous target detection (i.e., the P3b component) vs. novelty processing (i.e., the P3a component) (Alho et al. 1998; Knight 1984). Based on this long line of previous studies, we presumed that such a comparison could be also elucidate differences in functional connectivity patterns that are more generally related to endogenous vs. exogenous attention processes in the auditory domain. However, given the physical stimulus differences, the exogenous process driven by novelty events is not purely attention related. It is also important to keep in mind that although the subjects were expecting a target also in the Novel trials, presumably resulting in a similar motor preparation activity during the pre-stimulus period, only the Target trials were expected to trigger a subsequent motor activity. At the same time, the Novelty trials may have induced endogenous control processing to suppress of the button press. To address the issues related to motor execution (or suppression thereof), the current theoretical interpretations were only made based on effects observed before the average onset of motor execution determined from the behavioral reaction times. In the present implementation, we applied cluster statistics within each of our a priori determined ROI pair; we are currently working on a method for determining a common null distribution on the whole-brain scale.
Another interesting topic for future studies would be the investigation of functional connectivity within an ROI. Due to increased source leakage problem with increasing adjacency of the sub-ROIs, potential approaches could use non zero-lag connectivity metrics such as imaginary coherence or weighted phase lag index in combination with theoretically advanced approaches such as resolution matrix normalization (Nolte et al. 2004; Vinck et al. 2011).
Conclusion
Our findings are in line with the hypothesis that communication between the cortical areas involves functionally distinct frequency bands during (predominantly endogenous) target detection vs. (predominantly exogenous) orienting to physically varying, unexpected novel sounds. Consistent with previous studies in the visual domain, the larger phase synchronization during trials requiring greater degrees of endogenous or top-down processing was most prominent in the beta band, whereas for trials involving suppression of irrelevant information, the largest effects were observed in the alpha band.
Acknowledgments:
This work was supported by grants from National Institute on Deafness and other Communication Disorders (R01DC016915, R01DC016765, R01DC017991), National Institute of Mental Health (R01MH083744) and National Institute of Neurological Disorders and Stroke (R01NS104585). The research environment was supported by the NIH awards P41EB015896, S10RR014978, S10RR021110, S10RR019307, S10RR014798, and S10RR023401.
Footnotes
Conflict of interest: The authors declare that they have no conflict of interest.
References
- Ahlfors SP, Han J, Lin FH, Witzel T, Belliveau JW, Hämäläinen MS, Halgren E (2010) Cancellation of EEG and MEG signals generated by extended and distributed sources Hum Brain Mapp 31:140–149 doi: 10.1002/hbm.20851 [DOI] [PMC free article] [PubMed] [Google Scholar]
- Ahveninen J et al. (2011) Attention-driven auditory cortex short-term plasticity helps segregate relevant sounds from noise Proc Natl Acad Sci U S A 108:4182–4187 doi:101613410810.1073/pnas.1016134108 [DOI] [PMC free article] [PubMed] [Google Scholar]
- Ahveninen J, Huang S, Belliveau JW, Chang WT, Hämäläinen M (2013) Dynamic oscillatory processes governing cued orienting and allocation of auditory attention J Cogn Neurosci 25:1926–1943 doi: 10.1162/jocn_a_00452 [DOI] [PMC free article] [PubMed] [Google Scholar]
- Ahveninen J, Jääskeläinen IP, Belliveau JW, Hämäläinen M, Lin FH, Raij T (2012) Dissociable influences of auditory object vs. spatial attention on visual system oscillatory activity PLoS One 7:e38511 doi: 10.1371/journal.pone.0038511 [DOI] [PMC free article] [PubMed] [Google Scholar]
- Ahveninen J, Seidman LJ, Chang WT, Hamalainen M, Huang S (2017) Suppression of irrelevant sounds during auditory working memory Neuroimage 161:1–8 doi:S1053–8119(17)30687–0 [DOI] [PMC free article] [PubMed] [Google Scholar]
- Alho K et al. (2003) Hemispheric lateralization of cerebral blood-flow changes during selective listening to dichotically presented continuous speech Brain Res Cogn Brain Res 17:201–211 [DOI] [PubMed] [Google Scholar]
- Alho K et al. (1998) Processing of novel sounds and frequency changes in the human auditory cortex: magnetoencephalographic recordings Psychophysiology 35:211–224 [PubMed] [Google Scholar]
- Bastos AM et al. (2015) Visual areas exert feedforward and feedback influences through distinct frequency channels Neuron 85:390–401 doi: 10.1016/j.neuron.2014.12.018 [DOI] [PubMed] [Google Scholar]
- Bauer M, Kennett S, Driver J (2012) Attentional selection of location and modality in vision and touch modulates low-frequency activity in associated sensory cortices J Neurophysiol 107:2342–2351 doi: 10.1152/jn.00973.2011 [DOI] [PMC free article] [PubMed] [Google Scholar]
- Buschman TJ, Miller EK (2007) Top-down versus bottom-up control of attention in the prefrontal and posterior parietal cortices Science 315:1860–1862 doi: 10.1126/science.1138071 [DOI] [PubMed] [Google Scholar]
- Corbetta M, Shulman GL (2002) Control of goal-directed and stimulus-driven attention in the brain Nat Rev Neurosci 3:201–215 doi: 10.1038/nrn755nrn755 [DOI] [PubMed] [Google Scholar]
- Dale AM, Liu AK, Fischl BR, Buckner RL, Belliveau JW, Lewine JD, Halgren E (2000) Dynamic statistical parametric mapping: combining fMRI and MEG for high-resolution imaging of cortical activity Neuron 26:55–67 [DOI] [PubMed] [Google Scholar]
- Doesburg SM, Kitajo K, Ward LM (2005) Increased gamma-band synchrony precedes switching of conscious perceptual objects in binocular rivalry Neuroreport 16:1139–1142 [DOI] [PubMed] [Google Scholar]
- Engel AK, Fries P, Singer W (2001) Dynamic predictions: oscillations and synchrony in top-down processing Nat Rev Neurosci 2:704–716 doi: 10.1038/3509456535094565 [DOI] [PubMed] [Google Scholar]
- Fischl B, Sereno MI, Tootell RB, Dale AM (1999) High-resolution intersubject averaging and a coordinate system for the cortical surface Hum Brain Mapp 8:272–284 [DOI] [PMC free article] [PubMed] [Google Scholar]
- Foxe JJ, Simpson GV, Ahlfors SP (1998) Parieto-occipital approximately 10 Hz activity reflects anticipatory state of visual attention mechanisms Neuroreport 9:3929–3933 [DOI] [PubMed] [Google Scholar]
- Frey JN, Mainy N, Lachaux JP, Muller N, Bertrand O, Weisz N (2014) Selective modulation of auditory cortical alpha activity in an audiovisual spatial attention task J Neurosci 34:6634–6639 doi: 10.1523/JNEUROSCI.4813-13.2014 [DOI] [PMC free article] [PubMed] [Google Scholar]
- Fries P (2015) Rhythms for Cognition: Communication through Coherence Neuron 88:220–235 doi: 10.1016/j.neuron.2015.09.034 [DOI] [PMC free article] [PubMed] [Google Scholar]
- Grady CL, Van Meter JW, Maisog JM, Pietrini P, Krasuski J, Rauschecker JP (1997) Attention-related modulation of activity in primary and secondary auditory cortex Neuroreport 8:2511–2516 [DOI] [PubMed] [Google Scholar]
- Haegens S, Handel BF, Jensen O (2011) Top-down controlled alpha band activity in somatosensory areas determines behavioral performance in a discrimination task J Neurosci 31:5197–5204 doi: 10.1523/JNEUROSCI.5199-10.2011 [DOI] [PMC free article] [PubMed] [Google Scholar]
- Hämäläinen MS, Ilmoniemi RJ (1994) Interpreting Magnetic-Fields of the Brain - Minimum Norm Estimates Med Biol Eng Comput 32:35–42 [DOI] [PubMed] [Google Scholar]
- Hämäläinen MS, Sarvas J (1989) Realistic conductivity geometry model of the human head for interpretation of neuromagnetic data IEEE Trans Biomed Eng BME-36:165–171 [DOI] [PubMed] [Google Scholar]
- Hansen JC, Hillyard SA (1980) Endogenous brain potentials associated with selective auditory attention Electroencephalogr Clin Neurophysiol 49:277–290 [DOI] [PubMed] [Google Scholar]
- Hanslmayr S, Aslan A, Staudigl T, Klimesch W, Herrmann CS, Bauml KH (2007) Prestimulus oscillations predict visual perception performance between and within subjects Neuroimage 37:1465–1473 doi:S1053–8119(07)00603–9 [DOI] [PubMed] [Google Scholar]
- Hillyard SA, Hink RF, Schwent VL, Picton TW (1973) Electrical signs of selective attention in the human brain Science 182:177–180 [DOI] [PubMed] [Google Scholar]
- Huang S, Belliveau JW, Tengshe C, Ahveninen J (2012) Brain networks of novelty-driven involuntary and cued voluntary auditory attention shifting PLoS One doi: 10.1371/journal.pone.0044062 [DOI] [PMC free article] [PubMed] [Google Scholar]
- Huang S, Chang WT, Belliveau JW, Hämäläinen M, Ahveninen J (2014a) Lateralized parietotemporal oscillatory phase synchronization during auditory selective attention Neuroimage 86:461469 doi: 10.1016/j.neuroimage.2013.10.043 [DOI] [PMC free article] [PubMed] [Google Scholar]
- Huang S, Rossi S, Hämäläinen M, Ahveninen J (2014b) Auditory conflict resolution correlates with medial-lateral frontal theta/alpha phase synchrony PLoS ONE 9:e110989 doi: 10.1371/journal.pone.0110989PONE-D-14-33298 [DOI] [PMC free article] [PubMed] [Google Scholar]
- Iversen JR, Repp BH, Patel AD (2009) Top-down control of rhythm perception modulates early auditory responses Ann N Y Acad Sci 1169:58–73 doi: 10.1111/j.1749-6632.2009.04579.x [DOI] [PubMed] [Google Scholar]
- Jensen O, Kaiser J, Lachaux JP (2007) Human gamma-frequency oscillations associated with attention and memory Trends Neurosci 30:317–324 doi: 10.1016/j.tins.2007.05.001 [DOI] [PubMed] [Google Scholar]
- Jensen O, Mazaheri A (2010) Shaping functional architecture by oscillatory alpha activity: gating by inhibition Front Hum Neurosci 4:186 doi: 10.3389/fnhum.2010.00186 [DOI] [PMC free article] [PubMed] [Google Scholar]
- Kelly SP, Lalor EC, Reilly RB, Foxe JJ (2006) Increases in alpha oscillatory power reflect an active retinotopic mechanism for distracter suppression during sustained visuospatial attention J Neurophysiol 95:3844–3851 doi: 10.1152/jn.01234.2005 [DOI] [PubMed] [Google Scholar]
- Khan S et al. (2018) Maturation trajectories of cortical resting-state networks depend on the mediating frequency band Neuroimage 174:57–68 doi: 10.1016/j.neuroimage.2018.02.018 [DOI] [PMC free article] [PubMed] [Google Scholar]
- Kim YH, Gitelman DR, Nobre AC, Parrish TB, LaBar KS, Mesulam MM (1999) The large-scale neural network for spatial attention displays multifunctional overlap but differential asymmetry Neuroimage 9:269–277 doi:S1053–8119(99)90408–1 [DOI] [PubMed] [Google Scholar]
- Kitzbichler MG, Khan S, Ganesan S, Vangel MG, Herbert MR, Hämäläinen MS, Kenet T (2015) Altered development and multifaceted band-specific abnormalities of resting state networks in autism Biological psychiatry 77:794–804 [DOI] [PMC free article] [PubMed] [Google Scholar]
- Knight RT (1984) Decreased response to novel stimuli after prefrontal lesions in man Electroencephalogr Clin Neurophysiol 59:9–20 [DOI] [PubMed] [Google Scholar]
- Knight RT, Scabini D, Woods DL, Clayworth CC (1989) Contributions of temporal-parietal junction to the human auditory P3 Brain Research 502:109–116 [DOI] [PubMed] [Google Scholar]
- Kopell N, Kramer MA, Malerba P, Whittington MA (2010) Are different rhythms good for different functions? Front Hum Neurosci 4:187 doi: 10.3389/fnhum.2010.00187 [DOI] [PMC free article] [PubMed] [Google Scholar]
- Lachaux JP, Rodriguez E, Martinerie J, Varela FJ (1999) Measuring phase synchrony in brain signals Hum Brain Mapp 8:194–208 doi: 10.1002/(SICI)1097-0193 [DOI] [PMC free article] [PubMed] [Google Scholar]
- Lin FH, Belliveau JW, Dale AM, Hämäläinen MS (2006) Distributed current estimates using cortical orientation constraints Hum Brain Mapp 27:1–13 doi: 10.1002/hbm.20155 [DOI] [PMC free article] [PubMed] [Google Scholar]
- Lowet E, Roberts MJ, Bonizzi P, Karel J, De Weerd P (2016) Quantifying Neural Oscillatory Synchronization: A Comparison between Spectral Coherence and Phase-Locking Value Approaches PLoS One 11:e0146443 doi: 10.1371/journal.pone.0146443 [DOI] [PMC free article] [PubMed] [Google Scholar]
- Mamashli F, Hämäläinen M, Ahveninen J, Kenet T, Khan S (2019a) Permutation Statistics for Connectivity Analysis between Regions of Interest in EEG and MEG Data Scientific reports 9:7942 doi: 10.1038/s41598-019-44403-z [DOI] [PMC free article] [PubMed] [Google Scholar]
- Mamashli F, Khan S, Obleser J, Friederici AD, Maess B (2019b) Oscillatory dynamics of cortical functional connections in semantic prediction Hum Brain Mapp 40:1856–1866 doi: 10.1002/hbm.24495 [DOI] [PMC free article] [PubMed] [Google Scholar]
- Maris E, Oostenveld R (2007) Nonparametric statistical testing of EEG- and MEG-data J Neurosci Methods 164:177–190 doi: 10.1016/j.jneumeth.2007.03.024 [DOI] [PubMed] [Google Scholar]
- Maris E, Schoffelen JM, Fries P (2007) Nonparametric statistical testing of coherence differences J Neurosci Methods 163:161–175 doi: 10.1016/j.jneumeth.2007.02.011 [DOI] [PubMed] [Google Scholar]
- Mayer AR, Harrington D, Adair JC, Lee R (2006) The neural networks underlying endogenous auditory covert orienting and reorienting Neuroimage 30:938–949 doi: 10.1016/j.neuroimage.2005.10.050 [DOI] [PubMed] [Google Scholar]
- Morillon B, Baillet S (2017) Motor origin of temporal predictions in auditory attention Proc Natl Acad Sci U S A 114:E8913–E8921 doi: 10.1073/pnas.1705373114 [DOI] [PMC free article] [PubMed] [Google Scholar]
- Muller N, Weisz N (2012) Lateralized auditory cortical alpha band activity and interregional connectivity pattern reflect anticipation of target sounds Cereb Cortex 22:1604–1613 doi: 10.1093/cercor/bhr232 [DOI] [PubMed] [Google Scholar]
- Näätänen R (1992) Attention and Brain Function. Lawrence Erlbaum, Hillsdale [Google Scholar]
- Nolte G, Bai O, Wheaton L, Mari Z, Vorbach S, Hallett M (2004) Identifying true brain interaction from EEG data using the imaginary part of coherency Clin Neurophysiol 115:2292–2307 [DOI] [PubMed] [Google Scholar]
- Panagiotaropoulos TI, Deco G, Kapoor V, Logothetis NK (2012) Neuronal discharges and gamma oscillations explicitly reflect visual consciousness in the lateral prefrontal cortex Neuron 74:924–935 doi: 10.1016/j.neuron.2012.04.013 [DOI] [PubMed] [Google Scholar]
- Peelen MV, Heslenfeld DJ, Theeuwes J (2004) Endogenous and exogenous attention shifts are mediated by the same large-scale neural network Neuroimage 22:822–830 doi: 10.1016/j.neuroimage.2004.01.044 [DOI] [PubMed] [Google Scholar]
- Petkov CI, Kang X, Alho K, Bertrand O, Yund EW, Woods DL (2004) Attentional modulation of human auditory cortex Nat Neurosci 7:658–663 doi: 10.1038/nn1256 [DOI] [PubMed] [Google Scholar]
- Polich J (2007) Updating P300: an integrative theory of P3a and P3b Clin Neurophysiol 118:21282148 doi:S1388–2457(07)00189–7 [DOI] [PMC free article] [PubMed] [Google Scholar]
- Rihs TA, Michel CM, Thut G (2009) A bias for posterior alpha-band power suppression versus enhancement during shifting versus maintenance of spatial attention Neuroimage 44:190199 doi:S1053–8119(08)00946–4 [DOI] [PubMed] [Google Scholar]
- Romei V, Brodbeck V, Michel C, Amedi A, Pascual-Leone A, Thut G (2008) Spontaneous fluctuations in posterior alpha-band EEG activity reflect variability in excitability of human visual areas Cereb Cortex 18:2010–2018 doi: 10.1093/cercor/bhm229 [DOI] [PMC free article] [PubMed] [Google Scholar]
- Rosen AC et al. (1999) Neural basis of endogenous and exogenous spatial orienting. A functional MRI study J Cogn Neurosci 11:135–152 [DOI] [PubMed] [Google Scholar]
- Rossi S, Huang S, Furtak SC, Belliveau JW, Ahveninen J Functional connectivity of dorsal and ventral frontoparietal seed regions during auditory orienting In: Cognitive Neuroscience Society Annual Meeting, Boston, MA, April 5–8 2014. [DOI] [PMC free article] [PubMed] [Google Scholar]
- Salmi J, Rinne T, Koistinen S, Salonen O, Alho K (2009) Brain networks of bottom-up triggered and top-down controlled shifting of auditory attention Brain Res 1286:155–164 doi: 10.1016/j.brainres.2009.06.083 [DOI] [PubMed] [Google Scholar]
- Shomstein S, Yantis S (2004) Control of attention shifts between vision and audition in human cortex J Neurosci 24:10702–10706 doi: 10.1523/JNEUROSCI.2939-04.2004 [DOI] [PMC free article] [PubMed] [Google Scholar]
- Siegel M, Donner TH, Engel AK (2012) Spectral fingerprints of large-scale neuronal interactions Nat Rev Neurosci 13:121–134 doi: 10.1038/nrn3137 [DOI] [PubMed] [Google Scholar]
- Snyder AC, Foxe JJ (2010) Anticipatory attentional suppression of visual features indexed by oscillatory alpha-band power increases: a high-density electrical mapping study J Neurosci 30:4024–4032 doi: 10.1523/JNEUROSCI.5684-09.2010 [DOI] [PMC free article] [PubMed] [Google Scholar]
- Sokoliuk R et al. (2019) Two Spatially Distinct Posterior Alpha Sources Fulfill Different Functional Roles in Attention J Neurosci 39:7183–7194 doi: 10.1523/JNEUROSCI.1993-18.2019 [DOI] [PMC free article] [PubMed] [Google Scholar]
- Strauss A, Henry MJ, Scharinger M, Obleser J (2015) Alpha phase determines successful lexical decision in noise J Neurosci 35:3256–3262 doi: 10.1523/JNEUROSCI.3357-14.2015 [DOI] [PMC free article] [PubMed] [Google Scholar]
- Strauss A, Wostmann M, Obleser J (2014) Cortical alpha oscillations as a tool for auditory selective inhibition Front Hum Neurosci 8:350 doi: 10.3389/fnhum.2014.00350 [DOI] [PMC free article] [PubMed] [Google Scholar]
- Tallon-Baudry C, Bertrand O (1999) Oscillatory gamma activity in humans and its role in object representation Trends Cogn Sci 3:151–162 [DOI] [PubMed] [Google Scholar]
- Taulu S, Simola J, Kajola M (2005) Applications of the Signal Space Separation Method IEEE Trans Signal Proc 53:3359–3372 [Google Scholar]
- Thut G, Nietzel A, Brandt SA, Pascual-Leone A (2006) Alpha-band electroencephalographic activity over occipital cortex indexes visuospatial attention bias and predicts visual target detection J Neurosci 26:9494–9502 doi:26/37/9494 [pii] 10.1523/JNEUROSCI.0875-06.2006 [DOI] [PMC free article] [PubMed] [Google Scholar]
- Vinck M, Oostenveld R, van Wingerden M, Battaglia F, Pennartz CM (2011) An improved index of phase-synchronization for electrophysiological data in the presence of volume-conduction, noise and sample-size bias Neuroimage 55:1548–1565 doi: 10.1016/j.neuroimage.2011.01.055 [DOI] [PubMed] [Google Scholar]
- von Stein A, Sarnthein J (2000) Different frequencies for different scales of cortical integration: from local gamma to long range alpha/theta synchronization International journal of psychophysiology : official journal of the International Organization of Psychophysiology 38:301–313 [DOI] [PubMed] [Google Scholar]
- Weisz N, Muller N, Jatzev S, Bertrand O (2014) Oscillatory alpha modulations in right auditory regions reflect the validity of acoustic cues in an auditory spatial attention task Cereb Cortex 24:2579–2590 doi: 10.1093/cercor/bht113 [DOI] [PubMed] [Google Scholar]
- Winer B, Brown D, Michels K (1991) Statistical Principles in Experimental Design. McGrawhill, New York [Google Scholar]
- Woldorff MG, Hillyard SA, Gallen CC, Hampson SR, Bloom FE (1998) Magnetoencephalographic recordings demonstrate attentional modulation of mismatch-related neural activity in human auditory cortex Psychophysiology 35:283–292 [DOI] [PubMed] [Google Scholar]
- Womelsdorf T, Schoffelen JM, Oostenveld R, Singer W, Desimone R, Engel AK, Fries P (2007) Modulation of neuronal interactions through neuronal synchronization Science 316:16091612 doi: 10.1126/science.1139597 [DOI] [PubMed] [Google Scholar]
- Worden MS, Foxe JJ, Wang N, Simpson GV (2000) Anticipatory biasing of visuospatial attention indexed by retinotopically specific alpha-band electroencephalography increases over occipital cortex J Neurosci 20:RC63. [DOI] [PMC free article] [PubMed] [Google Scholar]
- Wöstmann M, Herrmann B, Maess B, Obleser J (2016) Spatiotemporal dynamics of auditory attention synchronize with speech Proc Natl Acad Sci U S A 113:3873–3878 doi: 10.1073/pnas.1523357113 [DOI] [PMC free article] [PubMed] [Google Scholar]
- Wostmann M, Herrmann B, Wilsch A, Obleser J (2015) Neural alpha dynamics in younger and older listeners reflect acoustic challenges and predictive benefits J Neurosci 35:1458–1467 doi: 10.1523/JNEUROSCI.3l250-14.2015 [DOI] [PMC free article] [PubMed] [Google Scholar]
- Wostmann M, Schmitt LM, Obleser J (2019) Does Closing the Eyes Enhance Auditory Attention? Eye Closure Increases Attentional Alpha-Power Modulation but Not Listening Performance J Cogn Neurosci:1–14 doi: 10.1162/jocn_a_01403 [DOI] [PubMed] [Google Scholar]
- Wu CT, Weissman DH, Roberts KC, Woldorff MG (2007) The neural circuitry underlying the executive control of auditory spatial attention Brain Res 1134:187–198 doi: 10.1016/j.brainres.2006.11.088 [DOI] [PMC free article] [PubMed] [Google Scholar]
- Zatorre RJ, Mondor TA, Evans AC (1999) Auditory attention to space and frequency activates similar cerebral systems Neuroimage 10:544–554 doi: 10.1006/nimg.1999.0491 [DOI] [PubMed] [Google Scholar]