

Abstract
During acute caloric deprivation, hunger signaling mechanisms support homeostasis by enhancing incentive for food. There is some evidence (primarily based on non-human experiments) that fasting heightens incentive signaling for non-food reward as well. We hypothesized that, consistent with results from research in rodent and non-human primates, human participants would evidence increased incentive-related brain activity for non-food rewards during fast (relative to satiety), and that this increase would be heightened when available rewards were immediate. To assess these possibilities, healthy participants with BMI between 18 and 29 kg/m2 completed a task which engaged participants in opportunities to win immediate and delayed money (Monetary Incentive Delay Task) during two neuroimaging sessions (one post-prandial, one fasted). Analyses of participants (N = 18 included, BMI 22.12 ± 2.72, age 21.39 ± 3.52) focused on brain activity during the incentive window of the task. Region of Interest (ROI), as well as whole brain analyses, supported the hypothesized increase in incentive signaling during fasting in regions that included caudate and putamen. No evidence of interaction was observed between fasting and the effect of reward immediacy or reward magnitude. Though provisional given the modest sample size, these results suggest that acute fasting can heighten incentive signaling for non-food rewards.
Keywords: Incentive Tracking, Ingestive State, Fasting, Reward, Hunger, fMRI
1. Introduction
Acute fasting increases the salience of food cues [1,2] and the incentive value of food reinforcers[3].This of course serves homeostasis; when energy available for maintaining biological functions is low, a raft of peripheral and central nervous system signaling processes unfold that tend to promote eating [4,5]. Interestingly, the impact of caloric deprivation on incentive appears to partially extend beyond food reward. While it diminishes sexual behavior [6], there is considerable evidence suggesting caloric deprivation generally heightens incentive signaling in the brain. For example, in rodents, food deprivation has long been known to increase willingness to lever press for electrical stimulation of the lateral hypothalamus [7,8], and food restriction augments the hyper-sensitivity to cocaine caused by electrical stimulation [9,10]. This increase in sensitivity may be related to the fact that fasting (relative to ad lib feeding) enhances the increase in dopamine activity in the nucleus accumbens following cocaine intake [11]. In addition to its potentiation of cocaine’s effects, fasting tends to trigger reinstatement of heroin seeking post-extinction [12], an effect that is partially blocked by infusion of leptin, a satiety signaling molecule [13]. Comparable effects of fasting on incentive have been observed in rhesus monkeys, including increased sensitivity to cocaine [14] and to phencyclidine [15]. Collectively, these findings have been interpreted to suggest that food restriction leads to a general sensitization of reward [16].
While it would be surprising if the effects of caloric deprivation observed in other species were wholly absent in humans, evidence in the human literature for increased incentive value of non-food reward during caloric deprivation is neither extensive, nor consistent. On the one hand, heightened incentive for non-food reward is suggested by evidence that fasting in humans causes increased resting rCBF in regions relevant to incentive [17] and greater phasic responses in some of these same regions (including ventral striatum and dorsal anterior caudate) when immediate monetary reward is available[18], as well as consistent with observed hunger-related decrease in the time before abstinent smokers light up [19]. On the other hand, the study that most directly examined this issue in humans did not find evidence that caloric deprivation impacted incentive signaling for non-food reward. Simon et al (2017) [20] examined brain activity during pursuit of both food and non-food reward, in both a fasted and fed state using the Monetary Incentive Delay (MID)Task [21,22]. The MID Task is a well-validated method (see Lutz and Widmer 2014 [23] for review) to isolate brain activity associated with reward pursuit (sometimes referred to as reward “anticipation”, though we use the term “incentive” throughout). Although Simon and colleagues observed heightened incentive-related activity in the ventral striatum when fasted participants pursued food rewards, no state effect was observed when the same fasted participants pursued monetary rewards. Indeed, though not significant, mean incentive signaling in the ventral striatum (VS) was directionally lower for monetary rewards in the fast (relative to fed) state. The authors concluded that the study, “does not support the assumption of a general modality-independent increase of neural reward signaling during a fasted state (pg. 4).”
One possible basis for the inconsistency described above might be an indirect effect of including both food and monetary reinforcers in the same testing sessions. For some purposes, including both kinds of rewards in the same study is a clear design strength. Investigating food-specific increase in incentive value during caloric deficit requires inclusion of both food and non-food reward (an explicit goal of that study). However, including the pursuit of food and money in the same testing sessions may be problematic for assessing the converse (but not mutually exclusive) hypothesis of non-specific increase in incentive value. The reason for this is that reward signaling is in part relative (scaled) to the magnitude of rewards in the experimental environment [24]. Intuitively, the incentive engaged during pursuit of $5 during a test session in which other trials offer $1000 rewards would plausibly be attenuated relative to a context in which other trials offer only 25 cent rewards. Human neuroimaging literature indeed suggests that phasic reward signaling scales with the reward environment [24,25]. If acute fasting increases the incentive value of food relative to other rewards (see, for example, Sibly 1975), then money may be devalued during caloric deprivation in an experimental environment that includes both money and food rewards. Therefore, an increase in incentive signaling for non-food reward during caloric deficit could be masked or even reversed by the inclusion of food rewards, due to the relative scaling of these potential rewards when presented in the same experimental session.
The present study was designed to assess the effect of acute caloric deprivation on incentive in a context that did not include food reward. In addition, we were interested in the potential interaction between fasting and sensitivity to the magnitude and (especially) immediacy of monetary reward. Past work provides some suggestion that caloric deficit may particularly heighten incentive for immediate reward[18,26]. Further, Hariri et al (2005) provided suggestive evidence that greater reward sensitivity in the ventral striatum may be associated with greater preference for immediate over delayed rewards. To address our objectives, we employed a modified MID Task designed to measure incentive for rewards that varied in both these dimensions (reward magnitude, and reward immediacy) as well as a condition with no monetary reward (in which only incentive intrinsic to the task was present). We hypothesized that there would be increased recruitment within the incentive tracking network after fasting, and that this might be especially prominent during incentive for immediate rewards.
2. Methods and Materials
2.1. Participants
Study inclusion criteria required body-mass-index (BMI) between 18 and 29 kg/m2, age range of 18–50 years old, no history of eating disorders, no current use of psychoactive medication, no current effort to lose weight, and no contra-indication for participating in a study with Magnetic Resonance Imaging (MRI). A total of 28 right-handed participants were recruited through flyers placed on campus at the University of Southern California. Of these 28 participants, 27 completed an initial behavioral session used to screen for qualification in the study. Five of the 27 participants were excluded from participating further based on BMI above (n = 3) or below (n = 2) the inclusion range. All 22 of the remaining participants completed their first fMRI session. However, two participants did not complete their second fMRI session leaving 20 participants who completed all sessions of the study. Two of these completers were excluded from analyses due to problems identified during data pre-processing. In particular, behavioral data from one participant indicated failure to respond as instructed, and imaging data from one session of a second participant contained excessive artifact (acquisitions with dramatic changes in brightness and ‘stripes’ along the slice acquisition plane). All participants gave written informed consent, and the experiment was approved by the Institutional Review Board of the University of Southern California. This protocol was not registered. Figure 1 shows the participant selection for the study.
Figure 1:
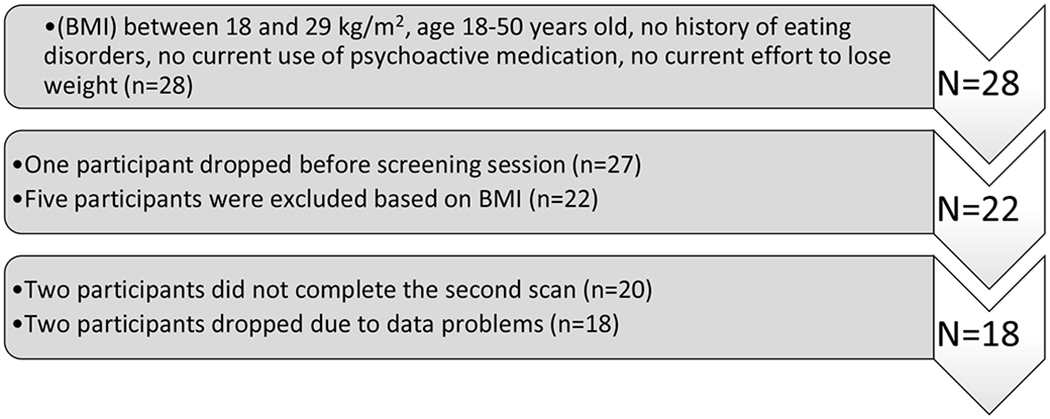
Selection of subjects for the study.
Among the 18 participants included in analyses, the mean age was 21.39 ± 3.52, 10 of the 18 (55.6%) were women, and the mean number of years of education across the sample was 14.83 ± 2.87. At the time of the first imaging session, BMI ranged from 17.92 to 27.41kg/m2 (22.12 ± 2.72). Of note, the participant whose weight was slightly below the BMI inclusion range at the time of the first scanning session was within the range at the study baseline assessment for inclusion. Subject baseline characteristics are presented in Table 1. To reduce variance across sessions related to hormonal change [27] female participants (with one exception) completed both scanning sessions in the window between 15 and 22 days post-start of their most recent menstruation (presumed luteal phase, though not confirmed by bioassay). Due to scheduling constraint, one female participant completed both of her imaging sessions in the presumed follicular phase. All participants received $25 for completion of the baseline session, $20 for each fast, $30 for completion of each fMRI session, and in some cases additional bonus money (between $0 and $25).
Table 1:
Baseline characteristics of the subjects included in the final analyses.
| Sex (n) | Male (8), Female (10) |
| Age (years)* | 21.39 ± 3.52 |
| Years of education * | 14.83 ± 2.87 |
| BMI (kg/m2)* | 22.12 ± 2.72 |
| Ethnicity (n) | Asian(11) ; Caucasian (4); Hispanic(1); African American(1); Other(1) |
Values are means ± SDs
2.2. Ingestive manipulation
On both scanning days of the experiment participants were instructed to arrive following a minimum overnight fast of 12 h. All sessions began at either 11am or 12pm (depending on participant and scanner availability). On the fed day participants began eating approximately 20 minutes after arrival and were given 20 minutes to complete their meal. Scanning began one hour after the scheduled arrival time (approximately 20–30 minutes after eating on the Fed day). On the fed day participants were provided with a personal sized pizza and asked to eat until they felt “comfortably full.” The nutrients consumed varied with the particular pizza, and the amount consumed. However, all participants ate at least half of their pizza on the fed day, and all varieties of pizza were dense in protein and carbohydrates calories. For example, the vegetable topping option is listed by the chain as containing 1070 calories, 50 g of protein, and 154 g of carbohydrates (including 17 g of sugar). Consumption was completed approximately 40 minutes prior to the start of the primary study task reported here. Participants were given a brief questionnaire about their current appetite three times during each session: 1) at the start of the session (prior to eating during the fed day), 2) just before entering the scanner (post-eating if it was the fed day), and 3) upon completing the scanning session. For this report, we consider only responses to the question, “How hungry are you?” (range 0 to 100) which provides a general manipulation check.
2.3. Monetary Incentive Delay (MID) Task
Participants completed two runs of a 75-trial variant of the Monetary Incentive Delay (MID) task paired with fMRI. At the onset of each trial of the MID task, one of five images was presented with equal probability (Figure 2) indicating the potential prize for the trial ($5 Today, $25 Today, $5 in 1 month, $25 in 1 month, or “No prize”). With the possible extrinsic reward displayed on the screen, participants waited for a response target (a prominent “X” in the center of the screen), which appeared between 3.5 and 5.5 seconds after the initial presentation of the possible prize. We refer to this period during which the participant was poised to respond as quickly as they could as the “incentive period.” Immediately after responding, participants received feedback as to whether or not they were “fast enough” or “too slow” on the trial (Figure 2).
Figure 2:

Visualization of a large-immediate reward trial of the intertemporal MID-Task. Each trial began with a fixation cross, which remained on the screen for a mean of 2 seconds (exponential distribution of duration of fixation cross). Fixation was followed by 1 of 5 reward cues for a randomized duration between 3.5–5.5 seconds (“incentive period”). Next a large response target ‘X’ appeared over the reward cue, and participants responded with a button press as quickly as they were able, followed immediately by presentation of feedback indicating success or failure. Winning was kept at approximately 60% to promote engagement, in line with typical task parameters [21].
At the end of each of the sessions, one trial (selected from the four trial types with monetary reward) was randomly selected to be “real”, and if the participant won on that trial, he or she received the specified prize (delivered via Amazon Allowance), after the specified delay. If the participant did not win on the randomly selected trial, no bonus prize was awarded. In this way, participants were incentivized to try to win each round, and the magnitude of the incentive was in part a function of his or her valuation of the available prize for the round, in addition to any general incentive related to the game-like nature of the task. It is important to note that “no prize” in this context refers to the absence of available monetary bonus, and should not be equated with “no incentive”.
As shown in Figure 2, the visual displays of prize incentives made both Amount and Delay salient, with 1 five-dollar bill vs. 5 five-dollar bills for the small and large rewards respectively, and using placement to the fore vs. back along perspective lines to convey whether the reward was immediate (close) vs. one month delayed (far). It should be noted that these images were not comparable on visual dimensions, which limits interpretation of differences in brain activity between rewards (especially in visual cortex). However, because the goals of the study involved investigating direct and interaction effects of ingestive state (rather than main effects of reward) we considered this limitation minor and offset by the gain in engagement from the evocative display of rewards. This variant of the MID Task is optimized for examining the incentive period, but not the reward outcome period. This optimization for investigating incentive only is in keeping with our past utilization of this task [28,29].
2.4. MRI imaging parameters
Neuroimaging data was collected using a 3T Siemens MAGNETOM Tim/Trio scanner at the Dana and David Dornsife Cognitive Neuroscience Imaging Center at the University of Southern California with a 32-channel head-coil. Participants laid supine on a scanner bed, viewing stimuli through a mirror that is mounted on the head coil. Blood oxygen level-dependent (BOLD) response was measured via an echo planar imaging (EPI) sequence with prospective acquisition correction (PACE). Acquisition parameters during the functional acquisition were as follows: TR=2s, TE=25ms, flip angle=90, resolution=3mm3 isotropic, 64 x 64 matrix in FOV=192mm. A total of 41 axial slices, each 3mm in thickness, were acquired in an ascending interleaved fashion to cover the whole brain. The slices were tilted to align with each individual’s anterior commissure - posterior commissure line plane, to minimize signal dropout in the orbitofrontal cortex (Deichmann, Gottfried, Hutton, & Turner, 2003). Anatomical images were collected using a T1-weighted three-dimensional magnetization prepared rapid gradient echo with TI=900ms, TR=1.95s, TE=2260ms, flip angle=90 degrees, resolution=1mm, 256 × 256 matrix in FOV=256mm. This high-resolution structural image was used for alignment and normalization of each individual’s brain into standard MNI space. Subsequently, EPI images were standardized by applying the transformation used to normalize each participant’s high-resolution image.
2.5. Neuroimaging Preprocessing
Preprocessing of fMRI data was carried out utilizing several tools from the Oxford University Centre for Functional MRI of the Brain Software Library (FMRIB)[30–32]. Head movement was corrected in three dimensions using MCFLIRT (Motion Correction using the brain software library’s Linear Image Registration Tool) [33]. Six motion parameters were added into the general linear model (GLM) to explain variance in signal related to head motion. FMRI files were pre-processed using motion correction, high-pass filtering (100 s), and spatial smoothing with a Gaussian kernel of full width at half-maximum = 5 mm. Functional data were first mapped to each participant’s anatomical image and then registered into standard space (Montreal Neurological Institute, MNI) using affine transformation with FMRIB’s Linear Image Registration Tool to the avg152 T1 MNI template.
2.6. Statistical analyses
2.6.1. Power analysis
For within-subject factor comparisons (fast vs fed main effects), eighteen participants provide 80% power to detect effect size d ≥ .70 with p = .05 (threshold for designation as significant). With p = .1 (threshold for “trend” designation), 80% power is available for detection of effect sizes ≥ .61. Power to detect interaction effects (in particular, Ingestive State X Immediacy) is considerably more limited. The relevant study hypothesis here has 2 parts: 1) that incentive signaling will be greater during fast, and 2) that this effect on incentive signaling will be lower when extrinsic rewards are delayed compared to when they are immediate. Put another way, the second part of the interaction hypothesis suggests that the effect of ingestive state on incentive signaling has some degree of specificity to immediate rewards. This framing of the interaction hypothesis as about specificity (we have no basis from prior literature to hypothesize the effect of ingestive state on incentive will actually reverse when the monetary reward is delayed) carries an important negative implication for power. Adequate power to detect interactions of this type requires larger samples. At the limit, even if an observed effect of ingestive state on incentive signaling were completely specific to immediate rewards, power to detect the interaction would require approximately twice the sample as that required to detect the main effect in the immediate reward (unattenuated effect of ingestive state) condition [34]. And given the more realistic possibility of only partial specificity (that is, an ingestive state effect that is smaller but not completely absent for delayed rewards), available power would be even lower. Thus while a precise power estimate in line with study hypothesis cannot be given independent of an estimate of ingestive state effects, it is evident that power to detect the hypothesized interaction effect is low.
2.6.2. Behavioral analyses
Data were analyzed using R statistical software (version 3.2.4). Results are expressed as means ± SD. We submitted our behavioral data to both repeated measures analysis of variance (RM ANOVA) and paired t-test comparison. For hunger manipulation check, a 2 × 3 RM ANOVA with Measurement time (3 levels: upon arrival, before scan and after scan) and Ingestive State (2 levels: fasted and fed states) as within-subject factors. A paired t-test was performed to compare reaction time of trials without available reward in different Ingestive States (2 levels: fasted and fed). A 2 X 2 X 2 RM ANOVA was used to assess main effects of Ingestive State (2 levels: fasted and fed states), Reward Magnitude ($5 vs. $25) and Reward Delay (Today vs. In 30 Days) on RT of trials with available reward. When the assumption of sphericity was violated for the data using RM ANOVA, Greenhouse-Geisser corrected p-values are reported. Trials were excluded from reaction time analyses when a response was made less than 80 msec after target presentation or more than 500 after target presentation though results reported do not change qualitatively when this a priori exclusion rule was dropped.
2.6.3. Imaging data analyses
Data were processed using the fMRI Expert Analysis Tool (FEAT) version 6.0. Our analyses focused on the incentive period, which began with the presentation of the possible prize for the trial, and ended with the participants’ response to the target. Five explanatory variables were used to model the incentive epoch for the trials with reaction time from 80ms to 500ms, corresponding to the five reward conditions (small immediate, large immediate, small delayed, large delayed, no prize). As with analyses of reaction time, trials with very fast (< 80 ms) or very slow (>500 ms) responses were excluded from primary imaging analyses. This was accomplished by modeling these trials separately with a regressor of no interest. (However, including these trials did not substantively change findings.) An additional two explanatory variables (win/loss) in the response/feedback period were added to the general linear model (with convolution). For reason noted above we did not include the outcome phase in our primary analyses [28,29], though did include contrasts of this period in secondary analyses for completeness. Temporal derivatives and temporal filtering were added to increase statistical sensitivity. Inter-trial interval periods were not modeled, and therefore provided the implicit baseline for analyses.
For each participant and each session, eleven contrast maps in both fast and fed conditions were created on the first-level, including each of the 5 reward conditions (small immediate, large immediate, small delayed, large delayed, no prize) relative to implicit baseline, as well as three contrasts relevant to the study hypotheses: 1) overall incentive across reward types (relative to implicit baseline), 2) a magnitude incentive contrast (the 2 large rewards – the 2 small rewards), and 3) an immediacy incentive contrast (the 2 immediate rewards – the 2 delayed rewards). Additional contrasts assessed included win outcome relative to implicit baseline, loss outcome relative to implicit baseline, and finally, (win outcome – loss outcome).
2.6.3.1. Region of interest analyses
For primary analyses, we used a priori ROI masks, selected based on previous published reports with the MID task [21,35]. This included midbrain, insula, supplementary motor area (SMA), putamen, caudate, thalamus and accumbens (all bilateral). Each of these regions was defined using automated atlas maps with probability cut-off of > 50%. The insula and SMA were taken from the probabilistic Harvard-Oxford Cortical Structural Atlas, whereas subcortical structural regions were taken from the probabilistic Harvard-Oxford Subcortical Structural Atlas with the exception of the midbrain, which was defined using the probabilistic template for dopaminergic midbrain nuclei created by Murty and colleagues [36]. Study hypotheses were tested on signal change (beta values from statistical models) for the key contrasts described above using RM ANCOVA with Ingestive state (2 levels: fasted and fed states), Reward Magnitude (large and small), and Reward Immediacy (now and later) as the within-subject factors and with BMI and Sex (and their interaction with ingestive state) included as between-subject covariates. Brain signals from non-rewarded trails were analyzed separately using Repeated measures ANCOVA with Ingestive State (2 levels: fasted and fed states) as the within-subject factor and BMI and Sex (and their interaction with ingestive state) were included as between-subject covariates. ROI analysis included models of signal in the combined regions, as well as analyses of the seven regions in isolation.
2.6.3.2. Whole-brain analyses
In addition to ROI analyses, we report a series of whole brain analyses, which we consider secondary to ROI analyses (as in our prior reports using the MID Task [28,29]). Whole-brain analyses were based on the above model with three primary group level comparisons to test the three primary study hypotheses. These group level contrasts were 1) incentive in general (across conditions) during fast vs. fed state (Incentive Fast – Incentive Fed), 2) the difference between incentive for immediate vs. delayed rewards during fast vs. fed ((Incentive immediate/fast – Incentive delay/fast) - (Incentive immediate/fed – Incentive delay/fed)) and 3) The difference between incentive for large vs. small rewards during fast vs. fed ((Incentive large/fast – Incentive small/fast) – (Incentive large/fed – Incentive small/fed)). The linear-model comparison analysis of the whole brain activation included two levels. At the first level, three contrasts were calculated for each subject in each day. Then the two runs during each study day were combined for each subject using a fixed effects model by forcing the random effects variance to zero in FLAME (FMRIB’s Local Analysis of Mixed Effects) [37]. Finally, permutation- based non-parametric paired t-test (randomize, FSL tool) was applied. In particular, the difference values within-participant were initially calculate using fslmaths and randomized one sample t-test were performed on the these within-participant differences, correcting for multiple comparisons by threshold-free cluster enhancement [38] with p = .05.
3. Results
3.1. Hunger Manipulation Check
A 2 × 3 RM ANOVA of subjective hunger showed a significant main effect of the Measurement Time [F(2,34)= 12.2, p <.001, η2=0.16], a significant main effect of Ingestive State [F(1,17)= 81.8, p <.001, η2=0.48], and significant interactions between Measurement Time and Ingestive State [F(2,34) = 35.3, p < .0001 , η2=0.27] (see Figure 3). Post hoc analysis using the Tukey method showed that there was no significant difference between fast and fed days for the hunger score upon arrival (prior to eating), but there was a significant difference in hunger score just before neuroimaging (after eating on the fed session) (t = 9.247 p<001) as well as just after neuroimaging (t=9.385, p<001), in the expected direction (see Figure 3).
Figure 3:

Three measurements of hunger scores on fast and fed days. In plot, boxes identify medians and inter quartile range, with whiskers extending from the hinge to the largest / smallest value no further than 1.5 * the inter-quartile range (IQR) from the hinge, and outliers included as small filled circles. Time1: Upon arrival (prior to eating during the fed day); Time2: Before scan (post-eating if it was the fed day); Time3: After scan.
3.2. Reaction time analysis
As noted above, reaction times less than 80 ms (38 trials, 0.7%) or greater than 500 ms (178 trials, 3.3%) were excluded from analyses. Individual rates of reaction times less than 80 ms ranged from 0.0% (five participants) to 3.0%. Individual rates of responses greater than 500 ms ranged from 0.3% to 8.7%, with two thirds of participants between 1.0% and 6.1%. The distribution of retained reaction times across trials is presented in (Figure 4).
Figure 4:
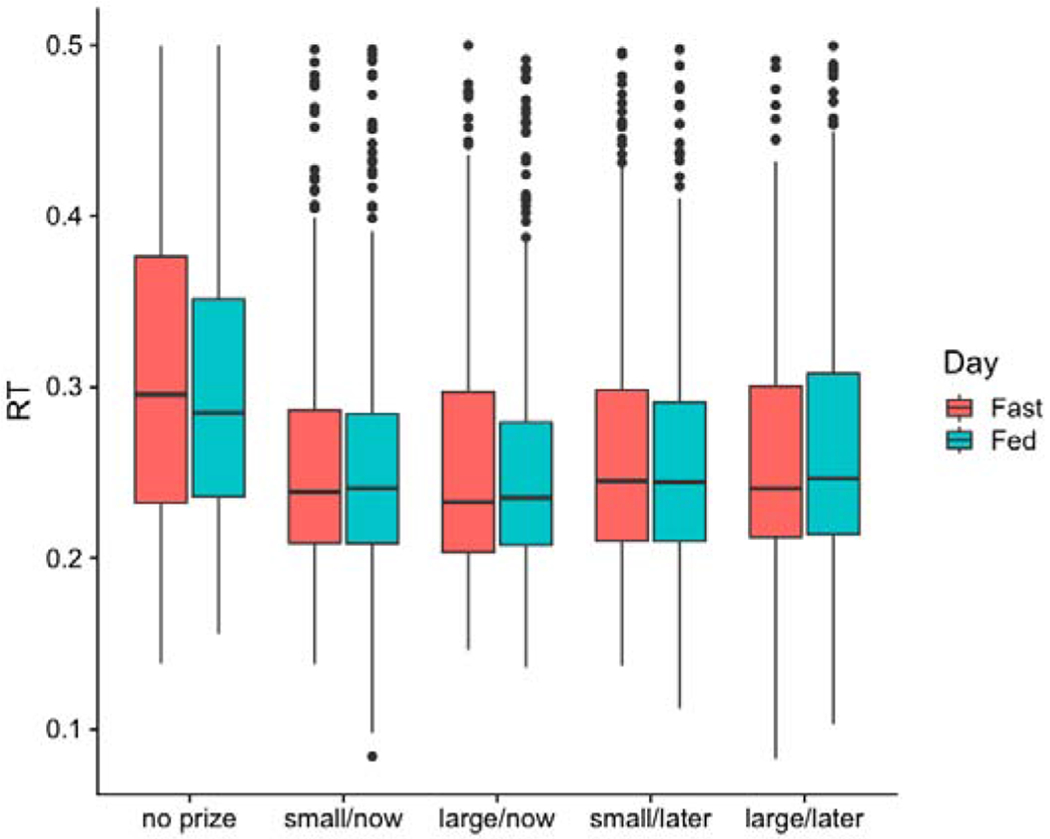
Reaction time data on fast and fed days. In plot, boxes identify medians and inter quartile range, with whiskers extending from the hinge to the largest / smallest value no further than 1.5 * IQR from the hinge, and outliers included as small filled circles.
Because the no-prize condition was dissimilar to the other conditions in its absence of extrinsic incentive, it was analyzed separately. RT during the two ingestive stated for this condition were compared by paired t-test. We did not observe an effect of ingestive State (t(17)=1.22, p =.24).
Next, we examined mean RT in the four extrinsic reward trial types, using a 2 X 2 X 2 repeated-measures ANOVA to assess main effects Ingestive State, Reward Magnitude ($5 vs. $25) and Reward Delay (Today vs. In 30 Days) on RT, as well as interactions between Ingestive State and both Amount and Delay. The RM ANOVA showed a significant main effect of Delay [F(1,17) = 7.10, p =.02, η2=.009], with participants responding faster during Immediate Reward than Delayed Reward trials. There was no main effect of Amount [F(1,17) = .22, p =.64, η2=.0001], nor a main effect of Ingestive State [F(1,17) =.0002, p =.90, η2<.001], nor interaction between Ingestive State and either Amount [F(1,17) =.65, p =.43, η2=.0006] or Delay [F(1,17) =.01, p =.92, η2<.001].
3.3. Imaging analysis
3.3.1. ROI analyses
As described above, ROI analyses included midbrain, insula, SMA, putamen, caudate, thalamus and accumbens (Figure 5).
Figure 5:
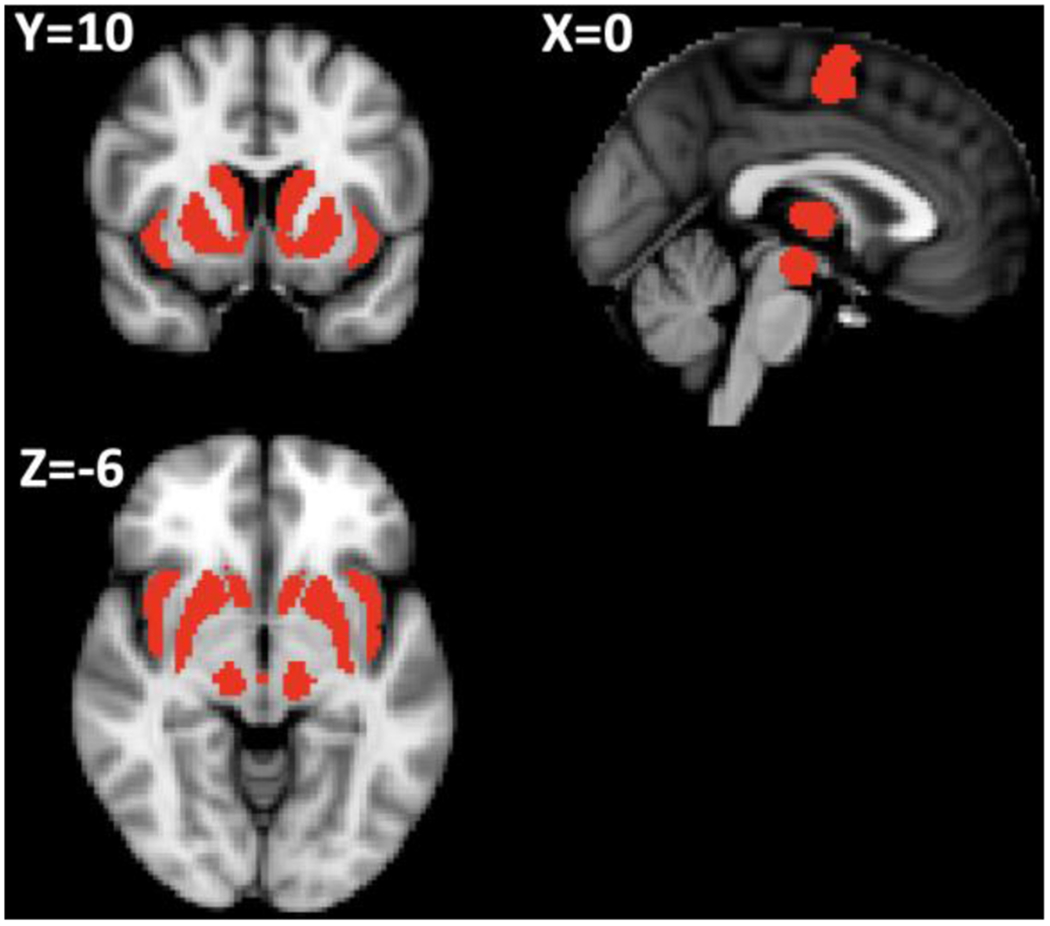
Red areas denote a priori regions expected to track incentive value based on prior work with the task. This mask included midbrain, insula, supplementary motor area (SMA), putamen, caudate, thalamus and accumbens (all bilateral).
Beta values were extracted from this mask (all regions combined in initial analyses) for each of the five incentive EVs (small immediate, large immediate, small delayed, large delayed, no prize), separately for fast and fed sessions, and plotted in Figure 6.
Figure 6 :
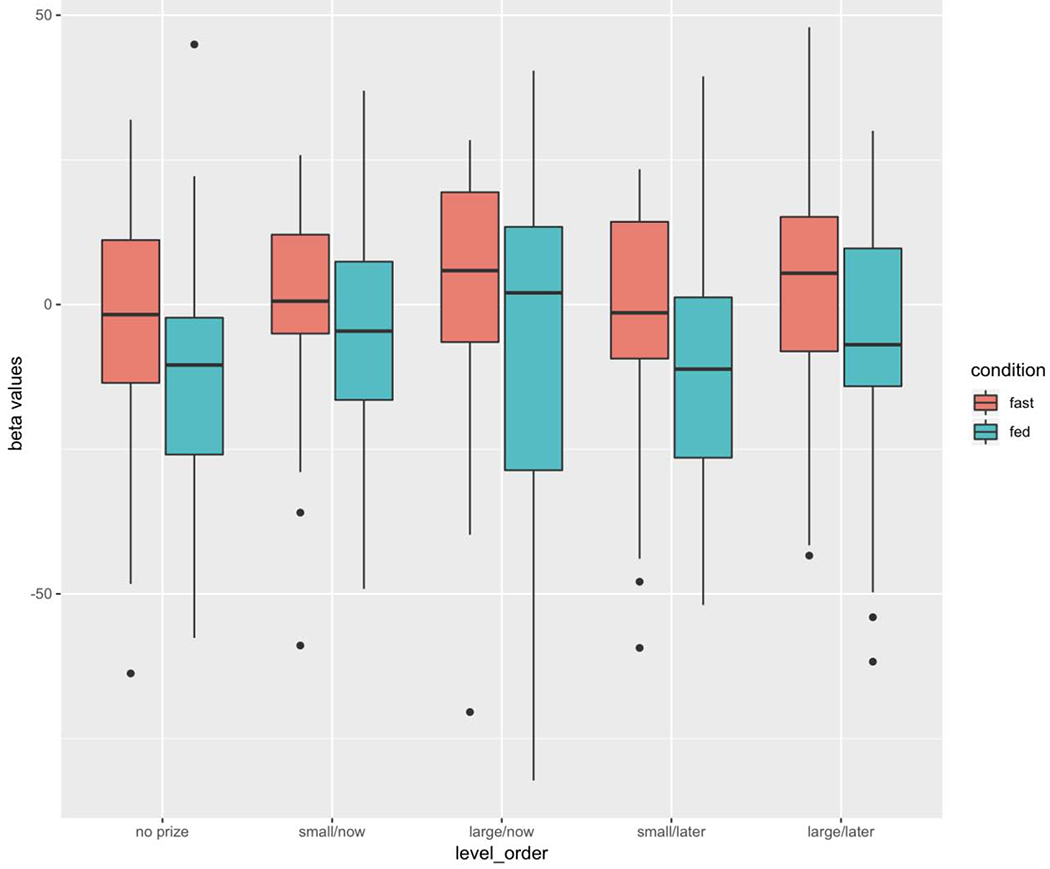
Beta values extracted from the ROI mask, on fast and fed days. In plot, boxes identify medians and inter quartile range, with whiskers extending from the hinge to the largest / smallest value no further than 1.5 * IQR from the hinge, and outliers included as small filled circles.
As with RT analysis above, we first compared the fasted vs fed incentive period signal change in the “No Prize” condition. The Ingestive State difference in signal change during incentive period of no-prize trials was significant (F(1,17) = 11.15, p=0.004, η2=0.07), and was in the expected direction of greater signal increase during the fast condition. No main-effects of BMI or Sex, or interactions between Ingestive State and these variables were observed (p-values >.5).
Next, we analyzed the four monetary prize conditions using a 2 X 2 X 2 RM ANCOVA with BMI and Sex included, to assess main effects Ingestive State (fast vs. fed), Reward Magnitude ($5 vs. $25) and Reward Delay (Today vs. In 30 Days), and all predictor variable interactions, on signal increase within the incentive ROI. We observed a marginally significant main effect of Delay [F(1,17) =4.43, p = 0.051, η2=0.004], with greater signal increase during incentive for Immediate than Delayed rewards. A significant main effect of the Ingestive State was observed (F(1,17) = 8.47, p < 0.01, η2 = 0.049), with greater signal increase during the incentive epoch, across rewards, during the fast day. And There was no significant main effect of Amount (F(1,17) = 1.98, p = 0.18, η2=0.003). Importantly, there was also no significant interaction between Ingestive State and either Amount [F(1,17) =0.05, p =0.83, η2<0.001] or Delay [F(1,17) = 0.86, p =0.37, η2=0.001]. No main-effects of BMI or Sex, or interactions between Ingestive State and these variables were observed (p-values >.2).
Next the same statistical models were used to predict signal in each of the seven individual regions that made up the above combined ROI (midbrain, insula, SMA, putamen, caudate, thalamus and accumbens, each with left and right hemispheres combined). BMI and Sex covariates were included in models of individual regions and no evidence of association was observed in all seven individual regions. Beta values were extracted from each of the regions for each of the five incentive EVs (small immediate, large immediate, small delayed, large delayed, no prize), separately for fast and fed sessions. As above, we first examined the no prize condition. Beta values were significantly greater during the fast condition within the putamen (F(1,17) =12.22, p = 0.003, η2=0.076), midbrain (F(1,17)=5.74, p = 0.03, η2=0.048), accumbens (F(1,17) =3.32, p = 0.09, η2=0.03), thalamus (F(1,17) =6.98, p = 0.02, η2=0.04) and caudate (F(1,17) =17.37, p = 0.007, η2=0.106). Insular activity difference was qualtitatively similar but only at the level of a trend [ F(1,17) =3.32, p = 0.09, η2=0.02)]. No difference was observed in SMA (p-values > .1). In the analysis of accumbens only, a sex difference was observed, with greater signal increase in female participants [ F(1,17) =5.88, p = 0.03, η2=0.058].
Next, we analyzed the four monetary prize conditions using a 2 X 2 X 2 RM ANOVA to assess main effects Ingestive State (fast vs. fed), Reward Magnitude ($5 vs. $25) and Reward Delay (Today vs. In 30 Days), and all predictor variable interactions, on signal increase within the seven ROIs. Incentive period signal was significantly greater during immediate reward trials than delayed reward trials within the SMA (F (1,17) =8.63, p = 0.009, η2=0.006) and with trends in the same direction in insular (F(1,17) =3.91, p =0.06, η2=0.003) and midbrain (F(1,17) =3.29, p =0.088, η2=0.004, all other regions examined (other p-values > .1). Incentive period signal did not significantly differ in any ROI between large and small rewards (p-values > .1), though for all 5 regions the mean difference was in the expected direction. Finally, a main effect of Ingestive State was observes, with greater incentive period signal during the fast condition in caudate (F(1,17) =13.27, p =0.002, η2=0.069), accumben (F(1,17) =5.29, p =0.034, η2=0.058), SMA (F(1,17) =5.452, p =0.032, η2=0.034), thalamus (F(1,17) =5.97, p =0.026, η2=0.031), and putamen (F(1,17) =8.053, p =0.011, η2=0.058), and with trends in the same direction in the insular (F(1,17) =3.93, p = 0.064, η2=0.021) ,and midbrain (F(1,17) =3.89, p =0.065, η2=0.029). No interactions were observed between Ingestive State and either Amount or Delay (p-values > .2).
3.3.2. Whole Brain Analyses
Whole brain analyses were performed to identify any main effects of Ingestive State, and possible interactions between Ingestive State and both Amount, and Delay. Whole-brain data comparison indicated signal increases were higher during the incentive period in fasted (relative to fed) sessions in caudate, putamen, anterior cingulate, and left precentral gyrus (see Figure 7). There were no areas in which signal increase during the incentive epoch was significantly lower on the fasted (relative to fed) day. No significant MRI signal difference was found in comparison of the effect of Delay in the two ingestive states ((Incentive immediate/fast – Incentive delay/fast) - (Incentive immediate/fed – Incentive delay/fed)). Nor were significant signal differences observed in the effect of Amount as a function of ingestive states ((Incentive large/fast – Incentive small/fast) - (Incentive large/fed – Incentive small/fed)). No significant signal difference were found in comparison of the effect of Ingestive State on signal change based on trial outcome (neither for win relative to baseline, loss relative to baseline, or win – loss). However, as noted above, in keeping with our prior use of the task [28,29], optimization was specific to the anticipation period.
Figure 7 :

Whole brain contrast of incentive period (all rewarded trials) during fast - fed conditions based on whole-brain paired-t test. Greater signal increase was observed during the fast condition in several regions including caudate, putamen, anterior cingulate, and left precentral gyrus. The results are based on repeated measures permutation-based nonparametric test (randomize, FSL tool) approach, correcting for multiple comparisons by threshold-free cluster enhancement. p- values <0.05 were considered significant.
4. Discussion
Overall, results provide evidence in support of our hypotheses that there is increased incentive-related brain activity for non-food rewards during fast (relative to satiety). However, we observed no evidence in support of the hypothesis that heightened incentive signaling during fast is particular to immediate rewards. The observed difference between ingestive state was significant in the combined ROI in both monetary rewarded trials, and in the no extrinsic reward condition (which as discussed above, did have incentive intrinsic to the game-like experience, including win-loss feedback). When the seven regions incorporated into the overall ROI were examined individually, significant differences in line with the combined region were observed in the accumbens, caudate, putamen and thalamus. Also, a significant main effect of immediacy was found in SMA with trends in insula and midbrain. Overall, the present results support the hypothesized increase during fasting in non-food incentive signaling. However, we did not observe any support for the hypothesized increase in incentive for immediate (relative to delayed) monetary rewards. Though as noted above, power for testing interaction hypotheses was quite limited.
As noted above, we think these results can be reconciled with Simon and colleagues (2017) report based on the same task with both money and food rewards. The absence of an increase in incentive signaling for money during the fast condition in that study may be explained by the presence of food rewards in the same session. A fasting related increase in incentive signaling for non-food rewards could be obscured or even reversed if 1) there was also a fasting induced increase in incentive signaling for food that was larger, and 2) valuation for rewards scales with the range of rewards offered in an experimental context. As discussed above, both of these propositions are likely true (see Silby 1975 and Breiter et al., 2001). It is also important to note that even absent methodological differences, in relatively small sample-size reports (N = 18 here, and N = 23 in Simon et al.) some inconsistency is expected given a true effect, unless the effect-size is extraordinarily large.
In the non-human literature, it is well established that acute caloric deprivation enhances responding for electrical stimulation in the hypothalamus, and for psychoactive drugs including cocaine, heroin and phencyclidine (See Carr 2002 for review). It is, therefore, not surprising that we observe an increase in incentive signaling in the present experimental context. Although the mechanism responsible for this is not established, one possible contributor is the peptide hormone ghrelin, which is implicated in hunger signaling [39]. Ghrelin binds primarily in the hypothalamus (where it has orexigenic effect), but also in the VTA [40] where it triggers increased dopamine activity (as well as synapse formation) within the nucleus accumbens [41]. While this effect contributes to ghrelin’s stimulation of food seeking [42], it is plausible that stimulation of the mesolimbic dopamine pathway impacts incentive signaling more generally, given its prominent role in reward seeking behavior [43,44]. Other potential mechanisms include insulin, glucose, and glucagon-like peptide-1 (GLP-1), each of which increase in CNS with recent feeding, and each of which has been shown to alter signaling in reward pathways at biologically relevant levels. Microinjections of insulin into the ventral tegmental (VTA) increases reward thresholds (attenuation of reward responsivity) [45] and depress firing among dopamine neurons projecting to striatum [46,47]. Glucose modulates GABA leading to reduction of dopamine release within the VTA and substantia nigra [48], evident in suppression of midbrain dopaminergic neurons associated with hyperglycemia [49]. Differentiation in reward signaling post consumption may also occur indirectly through glucose-related increases in cortical functioning [17] within regions known to inhibit reward signaling[50]. In addition, GLP-1, a potent anorexigenic peptide released after food intake [51] has been shown to decrease reward-seeking behavior in other domains, including drug and alcohol self-administration [52–54].
An important limitation of this study is, as noted above, the small sample size. Small sample studies can lead to inconsistency, and serious problems of low replicability of neuroimaging results [55]. We have made our data accessible using the standardized “Brain Imaging Data Structure” (BIDS) format [56] to facilitate future meta-analyses that may more definitively address this issue. In isolation, these data should be taken as only incremental evidence of the observed effect of satiety on incentive. A second important limitation is the lack of assessment of the aforementioned signaling molecules that may have contributed to observed ingestive effects on non-food incentive (insulin, ghrelin and GLP-1). However, in the absence of a much larger sample, it is unlikely that such measurements would have been able to shed light on underlying mechanisms. A third limitation worth noting is our use of a relatively large BMI inclusion range, which encompassed healthy and overweight participants. Although not apparent in our small sample, it is plausible that response to fast differs as a function of BMI. Thus the high BMI heterogeneity might have obscured statistical associations that would be apparent in a homogenously healthy weight sample, or a homogenously overweight sample. Finally, as noted above, it was apparent that for at least some participants, success vs. failure feedback on each trial (independent of monetary outcomes) was a significant source of incentive. This may be related to the payment scheme used in this version of the MID Task. Unlike the typical instantiation of the task in which smaller amounts of money are used (e.g., $1 and $5 trials) but all monetary reward trials contribute to total rewards that participants receive [20, 21, 22], here participants knew that only one trial from each session would be randomly selected to be “real.” This may have resulted in experiencing the monetary rewards as low stakes, and it is likely that the contribution of game-type incentive in the MID Task is inversely related to the value of the monetary rewards used.
If a participant stood to win no more than a couple pennies, motivation would be largely limited to whatever interest he or she had in performing well, independent of the monetary reward. However, If every monetary prize trial offered thousands of dollars and all were paid out when the response time threshold was met, then incentive associated with the game feedback itself, independent of the money, would likely be negligible. The latter case (or more realistic amounts of money that were still sufficient to dominate interest) would be preferable in two ways. First, it would allow us to compare ingestive state impact on incentive with the no-prize condition as baseline for contrasts (since we could presume minimal incentive regardless of ingestive state). Second, it would dramatically increase the degree to which magnitude and immediacy could be effectively kept under experimental control, thereby strengthening our ability to test secondary study hypotheses. Therefore, we consider the pay-off scheme we used (modest potential prizes, with each trial having a low chance of being selected as real) to be an important limitation.
These limitations notwithstanding, our data lend support for the hypothesized increase in incentive signaling for non-food reward during fasting relative to a postprandial state. Particularly if the effect on signaling generalizes broadly (as suggested by the preclinical literature) the finding suggests a possible ingestive effect on responsivity to environmental reward cues, including those cues that might disrupt maintenance of self-regulation.
Acknowledgement
Financial support was provided by National Institute of Health R21-DA042272 (JM). The funding source had no involvement in the work. The authors have no conflicts of interest to disclose. The authors have no financial relationships relevant to this article to disclose.
Abbreviations
- BMI
Body-mass-index
- EPI
echo-planar imaging
- FEAT
FMRI Expert Analysis Tool
- fMRI
Functional magnetic resonance imaging
- GLP-1
Glucogon-like peptide
- GLM
General linear model
- IQR
Inter-quartile range
- MNI
Montreal Neurological Institute
- MRI
Magnetic resonance imaging
- ROI
Region of interest
- SMA
Supplementary motor area
- VS
Ventral striatum
- VTA
Ventral tegmental
Footnotes
Publisher's Disclaimer: This is a PDF file of an unedited manuscript that has been accepted for publication. As a service to our customers we are providing this early version of the manuscript. The manuscript will undergo copyediting, typesetting, and review of the resulting proof before it is published in its final form. Please note that during the production process errors may be discovered which could affect the content, and all legal disclaimers that apply to the journal pertain.
Declarations of interest: none
References
- [1].Rolls ET. Taste, olfactory, and food texture processing in the brain, and the control of food intake. Physiol Behav 2005;85:45–56. 10.1016/j.physbeh.2005.04.012. [DOI] [PubMed] [Google Scholar]
- [2].Siep N, Roefs A, Roebroeck A, Havermans R, Bonte ML, Jansen A. Hunger is the best spice: an fMRI study of the effects of attention, hunger and calorie content on food reward processing in the amygdala and orbitofrontal cortex. Behav Brain Res 2009;198:149–58. [DOI] [PubMed] [Google Scholar]
- [3].Burger KS, Stice E. Elevated energy intake is correlated with hyperresponsivity in attentional, gustatory, and reward brain regions while anticipating palatable food receipt. Am J Clin Nutr 2013;97:1188–1194. [DOI] [PMC free article] [PubMed] [Google Scholar]
- [4].Meier U, Gressner AM. Endocrine regulation of energy metabolism: review of pathobiochemical and clinical chemical aspects of leptin, ghrelin, adiponectin, and resistin. Clin Chem 2004;50:1511–1525. [DOI] [PubMed] [Google Scholar]
- [5].Saper CB, Chou TC, Elmquist JK. The need to feed: homeostatic and hedonic control of eating. Neuron 2002;36:199–211. [DOI] [PubMed] [Google Scholar]
- [6].Caquineau C, Leng G, Douglas AJ. Sexual behaviour and neuronal activation in the vomeronasal pathway and hypothalamus of food-deprived male rats. J Neuroendocrinol 2012;24:712–723. [DOI] [PubMed] [Google Scholar]
- [7].Brady JV, Boren JJ, Conrad D, Sidman M. The effect of food and water deprivation upon intracranial self-stimulation. J Comp Physiol Psychol 1957;50:134. [DOI] [PubMed] [Google Scholar]
- [8].Carr KD, Simon EJ. Potentiation of reward by hunger is opioid mediated. Brain Res 1984;297:369–373. [DOI] [PubMed] [Google Scholar]
- [9].Carr KD. Augmentation of drug reward by chronic food restriction: behavioral evidence and underlying mechanisms. Physiol Behav 2002;76:353–364. [DOI] [PubMed] [Google Scholar]
- [10].De Vaca SC, Carr KD. Food restriction enhances the central rewarding effect of abused drugs. J Neurosci 1998;18:7502–7510. [DOI] [PMC free article] [PubMed] [Google Scholar]
- [11].Cadoni C, Solinas M, Valentini V, Di Chiara G. Selective psychostimulant sensitization by food restriction: differential changes in accumbens shell and core dopamine. Eur J Neurosci 2003;18:2326–2334. [DOI] [PubMed] [Google Scholar]
- [12].Shalev U, Highfield D, Yap J, Shaham Y. Stress and relapse to drug seeking in rats: studies on the generality of the effect. Psychopharmacology (Berl) 2000;150:337–346. [DOI] [PubMed] [Google Scholar]
- [13].Shalev U, Yap J, Shaham Y. Leptin attenuates acute food deprivation-induced relapse to heroin seeking. J Neurosci 2001;21:RC129–RC129. [DOI] [PMC free article] [PubMed] [Google Scholar]
- [14].Comer SD, Turner DM, Carroll ME. Effects of food deprivation on cocaine base smoking in rhesus monkeys. Psychopharmacology (Berl) 1995;119:127–132. [DOI] [PubMed] [Google Scholar]
- [15].Rodefer JS, Carroll ME. Progressive ratio and behavioral economic evaluation of the reinforcing efficacy of orally delivered phencyclidine and ethanol in monkeys: effects of feeding conditions. Psychopharmacology (Berl) 1996;128:265–273. [DOI] [PubMed] [Google Scholar]
- [16].Piazza PV, Le Moal M. Pathophysiological basis of vulnerability to drug abuse: role of an interaction between stress, glucocorticoids, and dopaminergic neurons. Annu Rev Pharmacol Toxicol 1996;36:359–378. [DOI] [PubMed] [Google Scholar]
- [17].Tataranni PA, Gautier J-F, Chen K, Flecker A, Bandy D, Salbe AD, et al. Neuroanatomical correlates of hunger and satiation in humans using positron emission tomography. Proc Natl Acad Sci 1999;96:4569–4574. [DOI] [PMC free article] [PubMed] [Google Scholar]
- [18].Wierenga CE, Bischoff-Grethe A, Melrose AJ, Irvine Z, Torres L, Bailer UF, et al. Hunger does not motivate reward in women remitted from anorexia nervosa. Biol Psychiatry 2015;77:642–52. [DOI] [PMC free article] [PubMed] [Google Scholar]
- [19].Leeman RF, O’Malley SS, White MA, McKee SA. Nicotine and food deprivation decrease the ability to resist smoking. Psychopharmacology (Berl) 2010;212:25–32. [DOI] [PMC free article] [PubMed] [Google Scholar]
- [20].Simon JJ, Wetzel A, Sinno MH, Skunde M, Bendszus M, Preissl H, et al. Integration of homeostatic signaling and food reward processing in the human brain. JCI Insight 2017;2. [DOI] [PMC free article] [PubMed] [Google Scholar]
- [21].Knutson B, Adams CM, Fong GW, Hommer D. Anticipation of Increasing Monetary Reward Selectively Recruits Nucleus Accumbens. J Neurosci 2001. ;21:1–5. [DOI] [PMC free article] [PubMed] [Google Scholar]
- [22].Knutson B, Westdorp A, Kaiser E, Hommer D. FMRI visualization of brain activity during a monetary incentive delay task. Neuroimage 2000;12:20–27. [DOI] [PubMed] [Google Scholar]
- [23].Lutz K, Widmer M. What can the monetary incentive delay task tell us about the neural processing of reward and punishment. Neurosci Neuroeconomics 2014;3:33–35. [Google Scholar]
- [24].Elliott R, Agnew Z, Deakin JFW. Medial orbitofrontal cortex codes relative rather than absolute value of financial rewards in humans. Eur J Neurosci 2008;27:2213–2218. [DOI] [PubMed] [Google Scholar]
- [25].Breiter HC, Aharon I, Kahneman D, Dale A, Shizgal P. Functional imaging of neural responses to expectancy and experience of monetary gains and losses. Neuron 2001;30:619–639. [DOI] [PubMed] [Google Scholar]
- [26].Wang X-T, Dvorak RD. Sweet future: fluctuating blood glucose levels affect future discounting. Psychol Sci 2010;21:183–188. [DOI] [PubMed] [Google Scholar]
- [27].Ossewaarde L, Van Wingen GA, Kooijman SC, Backstrom T, Fernandez G, Hermans EJ. Changes in functioning of mesolimbic incentive processing circuits during the premenstrual phase. Soc Cogn Affect Neurosci 2010;6:612–620. [DOI] [PMC free article] [PubMed] [Google Scholar]
- [28].Luo S, Ainslie G, Giragosian L, Monterosso JR. Behavioral and neural evidence of incentive bias for immediate rewards relative to preference-matched delayed rewards. J Neurosci 2009;29:14820–14827. [DOI] [PMC free article] [PubMed] [Google Scholar]
- [29].Luo S, Ainslie G, Giragosian L, Monterosso JR. Striatal hyposensitivity to delayed rewards among cigarette smokers. Drug Alcohol Depend 2011;116:18–23. [DOI] [PMC free article] [PubMed] [Google Scholar]
- [30].Jenkinson M, Beckmann CF, Behrens TE, Woolrich MW, Smith SM. Fsl. Neuroimage 2012;62:782–790. [DOI] [PubMed] [Google Scholar]
- [31].Smith SM, Jenkinson M, Woolrich MW, Beckmann CF, Behrens TE, Johansen-Berg H, et al. Advances in functional and structural MR image analysis and implementation as FSL. Neuroimage 2004;23:S208–S219. [DOI] [PubMed] [Google Scholar]
- [32].Woolrich MW, Jbabdi S, Patenaude B, Chappell M, Makni S, Behrens T, et al. Bayesian analysis of neuroimaging data in FSL. Neuroimage 2009;45:S173–S186. [DOI] [PubMed] [Google Scholar]
- [33].Jenkinson M, Bannister P, Brady M, Smith S. Improved optimization for the robust and accurate linear registration and motion correction of brain images. Neuroimage 2002;17:825–841. [DOI] [PubMed] [Google Scholar]
- [34].Perugini M, Gallucci M, Costantini G. A Practical Primer To Power Analysis for Simple Experimental Designs. Int Rev Soc Psychol 2018;31:20 10.5334/irsp.181. [DOI] [Google Scholar]
- [35].Knutson B, Taylor J, Kaufman M, Peterson R, Glover G. Distributed neural representation of expected value. J Neurosci 2005;25:4806–4812. [DOI] [PMC free article] [PubMed] [Google Scholar]
- [36].Murty VP, Shermohammed M, Smith DV, Carter RM, Huettel SA, Adcock RA. Resting state networks distinguish human ventral tegmental area from substantia nigra. Neuroimage 2014;100:580–589. [DOI] [PMC free article] [PubMed] [Google Scholar]
- [37].Beckmann CF, Jenkinson M, Smith SM. General multilevel linear modeling for group analysis in FMRI. Neuroimage 2003;20:1052–1063. [DOI] [PubMed] [Google Scholar]
- [38].Winkler AM, Ridgway GR, Webster MA, Smith SM, Nichols TE. Permutation inference for the general linear model. Neuroimage 2014;92:381–397. [DOI] [PMC free article] [PubMed] [Google Scholar]
- [39].Diepvens K, Häberer D, Westerterp-Plantenga M. Different proteins and biopeptides differently affect satiety and anorexigenic/orexigenic hormones in healthy humans. Int J Obes 2008;32:510. [DOI] [PubMed] [Google Scholar]
- [40].Nogueiras R, Tovar S, Mitchell SE, Rayner DV, Archer ZA, Dieguez C, et al. Regulation of growth hormone secretagogue receptor gene expression in the arcuate nuclei of the rat by leptin and ghrelin. Diabetes 2004;53:2552–2558. [DOI] [PubMed] [Google Scholar]
- [41].Abizaid A, Liu Z-W, Andrews ZB, Shanabrough M, Borok E, Elsworth JD, et al. Ghrelin modulates the activity and synaptic input organization of midbrain dopamine neurons while promoting appetite. J Clin Invest 2006;116:3229–3239. [DOI] [PMC free article] [PubMed] [Google Scholar]
- [42].Müller TD, Nogueiras R, Andermann ML, Andrews ZB, Anker SD, Argente J, et al. Ghrelin. Molecular Metabolism, 4 (6), 437–460. 2015. [DOI] [PMC free article] [PubMed] [Google Scholar]
- [43].Berridge KC. Food reward: brain substrates of wanting and liking. Neurosci Biobehav Rev 1996;20:1–25. [DOI] [PubMed] [Google Scholar]
- [44].Blackburn JR, Pfaus JG, Phillips AG. Dopamine functions in appetitive and defensive behaviours. Prog Neurobiol 1992;39:247–279. [DOI] [PubMed] [Google Scholar]
- [45].Bruijnzeel AW, Corrie LW, Rogers JA, Yamada H. Effects of insulin and leptin in the ventral tegmental area and arcuate hypothalamic nucleus on food intake and brain reward function in female rats. Behav Brain Res 2011;219:254–264. [DOI] [PMC free article] [PubMed] [Google Scholar]
- [46].Labouèbe G, Liu S, Dias C, Zou H, Wong JC, Karunakaran S, et al. Insulin induces long-term depression of ventral tegmental area dopamine neurons via endocannabinoids. Nat Neurosci 2013;16:300. [DOI] [PMC free article] [PubMed] [Google Scholar]
- [47].Mebel DM, Wong JC, Dong YJ, Borgland SL. Insulin in the ventral tegmental area reduces hedonic feeding and suppresses dopamine concentration via increased reuptake. Eur J Neurosci 2012;36:2336–2346. [DOI] [PMC free article] [PubMed] [Google Scholar]
- [48].During MJ, Leone P, Davis KE, Kerr D, Sherwin RS. Glucose modulates rat substantia nigra GABA release in vivo via ATP-sensitive potassium channels. J Clin Invest 1995;95:2403–2408. [DOI] [PMC free article] [PubMed] [Google Scholar]
- [49].Sailer CF, Chiodo LA. Glucose suppresses basal firing and haloperidol-induced increases in the firing rate of central dopaminergic neurons. Science 1980;210:1269–1271. [DOI] [PubMed] [Google Scholar]
- [50].Arnsten AF, Rubia K. Neurobiological circuits regulating attention, cognitive control, motivation, and emotion: disruptions in neurodevelopmental psychiatric disorders. J Am Acad Child Adolesc Psychiatry 2012;51:356–367. [DOI] [PubMed] [Google Scholar]
- [51].Vrang N, Phifer CB, Corkern MM, Berthoud H-R. Gastric distension induces c-Fos in medullary GLP-l/2-containing neurons. Am J Physiol-Regul Integr Comp Physiol 2003;285:R470–R478. [DOI] [PubMed] [Google Scholar]
- [52].Engel JA, Jerlhag E. Role of appetite-regulating peptides in the pathophysiology of addiction: implications for pharmacotherapy. CNS Drugs 2014;28:875–886. [DOI] [PMC free article] [PubMed] [Google Scholar]
- [53].Shirazi RH, Dickson SL, Skibicka KP. Gut peptide GLP-1 and its analogue, Exendin-4, decrease alcohol intake and reward. PloS One 2013;8:e61965. [DOI] [PMC free article] [PubMed] [Google Scholar]
- [54].Skibicka KP. The central GLP-1: implications for food and drug reward. Front Neurosci 2013. ;7:181. [DOI] [PMC free article] [PubMed] [Google Scholar]
- [55].Button KS, Ioannidis JP, Mokrysz C, Nosek BA, Flint J, Robinson ES, et al. Power failure: why small sample size undermines the reliability of neuroscience. Nat Rev Neurosci 2013;14:365. [DOI] [PubMed] [Google Scholar]
- [56].Gorgolewski KJ, Auer T, Calhoun VD, Craddock RC, Das S, Duff EP, et al. The brain imaging data structure, a format for organizing and describing outputs of neuroimaging experiments. Sci Data 2016;3:160044. [DOI] [PMC free article] [PubMed] [Google Scholar]