

Abstract
Little is known about trends in the age of onset of first myocardial infarction. Thus, we examined trends in the age of onset distribution of first myocardial infarction using two population-based datasets from Germany. First, we used German claims data based on an annual case number of approximately 2 million women and men covering the period from 2006 to 2016. Second, we used data from the KORA (Cooperative Health Research in the Region of Augsburg) Myocardial Infarction Registry covering the period from 2000–2016. Analyses were performed by means of quantile regression to estimate trends across the whole distribution of age of onset. Overall, NSample 1 = 69627 and NSample 2 = 9954 first myocardial infarctions were observed. In both samples, we found highly heterogeneous trends in age of onset. In men, we consistently found that age of onset increased before 50 and after 70 but decreased within this age bracket. For women, on the other hand, we consistently found that age of onset decreased for first myocardial infarctions before 70 but increased slightly or remained relatively stable thereafter. Therefore, late myocardial infarctions tended to occur later in life, while regular myocardial infarctions tended to occur earlier. These results suggest that in myocardial infarction, both morbidity compression and morbidity expansion might have occurred at the same time but for different parts of the age at onset distribution.
Subject terms: Cardiology, Epidemiology
Introduction
Myocardial infarction (MI) is one major contributor to general morbidity. Most studies on MI occurrence have focused on disease rates, and MI rates in industrial countries have been observed to be decreasing since the 1970s1–3. Age of onset has been suggested as an additional epidemiological indicator that has been successfully used in research on diseases4–7: For example, it has been examined how the age at onset of stroke has changed over time, how the age at onset of depression has changed over time, how the age at onset of diabetes has changed over time, and how the age at onset of breast cancer has changed over time4,8–10. However, there is not much evidence regarding trends in age at onset in myocardial infarction (MI)11: An American study used Medicare data from 1999 to 200912. Based on 5258 MI cases, the mean age at onset increased over the observation period. Another US-based study with male military personnel reported that the mean age at onset increased by 10 years over a period of 100 years13. These few studies, however, only considered changes in mean age at the upper end of the age scale, thus assuming that such changes may only occur at the upper end of the age distribution.
A shift in the mean age of MI onset in a population is also in accordance with Fries’ hypothesis of morbidity compression14, postulating that by shifting age at onset of disease and disability upward, shorter time periods will be spent in states of impaired health, and a healthy lifetime will be prolonged. However, the compression hypothesis does not make assumptions about the periods of life below the upper end and might thus paint an incomplete picture about population-based morbidity trends. Previous studies suggested that health in older adults seems to be improving the most, while health in comparatively younger age groups seems to be improving less or even deteriorating. For example, while some studies found that cardiovascular risk factors improved over time in Germany, others indicated that this seems to mostly apply to older but not middle-aged adults15,16. In particular, the increasing trends in diabetes and obesity among younger adults imply that while MI morbidity might decrease in older adults, it might actually increase in comparatively younger age groups17–19.
Thus, in the following, we analyse whether changes in age at MI onset occur only at the upper end, as suggested in the earlier studies cited above, or whether such changes can also be found in younger age groups. Analysing the age at onset is important because there exists only insufficient evidence regarding the age at onset in MI and because the age at onset is central to judgements about the existence or absence of a compression of morbidity in myocardial infarction20. The analyses will be performed with two large population-based datasets originating from two geographically distant regions with different social structures but covering overlapping age groups and time periods. This makes it possible to examine whether the same or comparable substantive results can be obtained and considered to validate each other, thus lending higher credibility to our findings. We ask: How has the age of onset of myocardial infarction changed over time?
Methods
Study populations
AOK. The first dataset consisted of pseudonymized claims data from the AOK Niedersachsen (Local Statutory Health Insurance of Lower Saxony) covering the years 2006 to 2015 with an annual population of >2 million insured women and men aged 18 years and older. The data were collected for accounting purposes and comprised basic socio-demographic information and hospital diagnoses. A detailed account of the dataset was published in an earlier paper11. As the proportion of elderly insured and thus the age at onset of diseases increase over time, a sampling procedure was applied to control for this demographic ageing: Random samples of the whole population for all age groups were drawn for every calendar year in such a way that the age distribution of the underlying population is held constant across the years. Then, in this age-standardized population, all new cases with admissions of first MI with ICD-diagnoses ICD-10: I21.0 to I21.9 were used. All analyses were performed with this dataset of first MI diagnoses that controlled for a changing age structure in the population. Due to the large sample size, additional analyses could also be conducted to explore trends in ST-segment elevation myocardial infarctions (STEMIs; I21.0– I21.3) and non-ST-segment elevation myocardial infarctions (NSTEMIs; I21.4).
KORA. The second dataset used data from the population-based KORA (Cooperative Health Research in the Region of Augsburg) Myocardial Infarction Registry, which was implemented as part of the WHO-MONICA (Monitoring Trends and Determinants in Cardiovascular Disease) project21–23. Since 1984, all cases of nonfatal MI and coronary deaths in the German region of Augsburg (the city of Augsburg and the counties Aichach-Friedberg and Augsburg) have been continuously registered for 25–74-year-olds. Most MI cases in the sample were recruited at the region’s major hospital, the university hospital of Augsburg. Additionally, information from death certificates was collected by the three public health departments in the study region. For the present analysis, all adults in the study region with a first MI during an observation period beginning in 2000 were included, while patients with a history of previous MI were excluded. Thus, the KORA sample consists of 9954 adults with a first MI aged 25 to 74 years at the time of MI covering the time from 2000 to 2016. The participants gave written informed consent, and the data collection was approved by the Ethics Committee of the Bavarian Medical Association.
Data analysis
The analyses were performed by means of quantile regression24 to obtain a better understanding of potentially heterogeneous trends by examining changes in age at MI onset within defined age groups, in the present case within the quantiles of the age at onset distributions of the two datasets considered. By using quantile regression, it is possible not only to calculate average trends but also to study how the whole distribution of age at onset may have changed over time. For example, it might be expected that different parts of the population may exhibit different trends, with early-onset MI occurring earlier and late-onset MI occurring later. In this case, average trends may not accurately reflect the underlying mechanisms of change, and analyses might lead to biased conclusions. Quantile regression also avoids several flaws that arise from the use of stratified samples. One might argue that separate regression analyses could be run on age-stratified subsamples of the population that exhibit, for example, early and late onset of MIs. However, segmenting the population in this way results in smaller sample sizes for each stratified regression analysis and may be susceptible to sample selection bias. In contrast, quantile regression uses weights to obtain regression estimates that correspond to trends of different parts of the distribution and has been shown to be robust to outliers and non-normality. Therefore, employing quantile regression increases the power to detect differential trends and minimizes potential bias. In accordance with these benefits, quantile regression has been extensively used across scientific disciplines to study heterogeneous effects25–28.
In the first step, descriptive statistics were performed after dividing the age distribution into nine quantiles (10%, 20%, 30%, 40%, 50%, 60%, 70%, 80%, 90%). Then, quantile regression was used to determine the trends of age at onset for each age quantile. All quantile regressions were controlled for average population age to control for demographic ageing. Quantile regression directly estimates the quantiles across the distribution of age at onset, and it allows a more complete view of existing trends. Finally, we conducted the joint test for equality of slopes that tests whether the regression coefficients significantly differ across quantiles. All analyses were performed separately for women and men. The statistical package R (version 3.5.2) was used for all statistical analyses.
In summary, instead of relying on the accuracy of an “average trend”, quantile regression permits us to examine potentially heterogeneous trends for the whole age distribution of MI onsets. Thus, we examined how the whole distribution of age at onset of myocardial infarction has changed over time. Therefore, this study aims to provide (a) evidence for similar or heterogeneous trends of age at first myocardial infarction, (b) an empirical basis for classifying the onset of myocardial infarctions as early, average or late, and (c) to derive theoretical implications for the concept of morbidity compression. All methods were performed in accordance with the relevant guidelines and regulations.
Results
AOK claims data
Descriptive trends in the development of first MIs are displayed in Tables 1 and 2 and visualized in Fig. 1. Overall, N = 69627 first MIs were observed, N = 41812 in men and N = 27815 in women. The number of cases of MI slightly decreased over time, with n = 6425 MIs in 2006 and n = 5832 MIs in 2016. In men, the mean age at first MI slightly decreased from 67.3 (in 2006) to 66.6 (in 2016). However, wide differences in trends over the whole population emerged (Fig. 1): In the 10% quantile, age at onset (corresponding approximately to age at first MI < 50) increased, while in the 20%-50% quantiles (approx. 50 < age > 70), it decreased. Then, age of onset increased again for the 60%-90% quantiles (approx. age > 70). Via quantile regression, we found that all described trends were significantly replicated, as seen in Fig. 2. Onset ages within the 10%, 60%, 70%, 80%, and 90% quantiles significantly increased over time, while within the 20%, 30%, 40%, and 50% quantiles, onset ages significantly decreased over time. The joint test for equality of slopes was significant and confirmed the heterogeneous trends across quantiles, p < 0.001. Thus, the age of MI onset decreased over time in men between 50 and 70 years of age but increased in men younger than 50 and older than 70.
Table 1.
Characteristics of the two study populations.
| Year | Men | Women | Sex Ratio | ||
|---|---|---|---|---|---|
| # Cases | Average age at onset | # Cases | Average age at onset | ||
| Claims Data (AOK) | |||||
| 2006 | 3661 | 67.29 | 2764 | 76.19 | 1.32 |
| 2007 | 3695 | 67.19 | 2675 | 76.49 | 1.38 |
| 2008 | 3685 | 67.38 | 2581 | 76.46 | 1.43 |
| 2009 | 3552 | 67.43 | 2492 | 76.87 | 1.43 |
| 2010 | 3554 | 67.11 | 2432 | 76.39 | 1.46 |
| 2011 | 3999 | 67.43 | 2666 | 75.78 | 1.50 |
| 2012 | 4082 | 67.45 | 2719 | 75.75 | 1.50 |
| 2013 | 4017 | 67.15 | 2537 | 76.14 | 1.58 |
| 2014 | 3973 | 67.23 | 2427 | 75.41 | 1.64 |
| 2015 | 3909 | 66.76 | 2375 | 75.71 | 1.65 |
| 2016 | 3685 | 66.64 | 2147 | 75.30 | 1.72 |
| Registry Data (KORA) | |||||
| 2000 | 449 | 60.32 | 152 | 65.03 | 2.95 |
| 2001 | 464 | 60.37 | 170 | 63.56 | 2.73 |
| 2002 | 494 | 59.81 | 151 | 63.83 | 3.27 |
| 2003 | 457 | 60.65 | 168 | 64.24 | 2.72 |
| 2004 | 457 | 60.11 | 139 | 65.96 | 3.29 |
| 2005 | 500 | 61.02 | 179 | 62.71 | 2.79 |
| 2006 | 431 | 60.57 | 150 | 63.51 | 2.87 |
| 2007 | 395 | 59.61 | 145 | 63.41 | 2.72 |
| 2008 | 419 | 60.54 | 140 | 64.98 | 2.99 |
| 2009 | 423 | 60.75 | 150 | 63.05 | 2.82 |
| 2010 | 448 | 60.07 | 161 | 62.72 | 2.78 |
| 2011 | 438 | 59.90 | 158 | 65.16 | 2.77 |
| 2012 | 429 | 60.71 | 130 | 62.23 | 3.30 |
| 2013 | 442 | 61.00 | 149 | 63.79 | 2.97 |
| 2014 | 422 | 60.25 | 138 | 61.83 | 3.06 |
| 2015 | 405 | 59.96 | 126 | 61.83 | 3.21 |
| 2016 | 360 | 60.08 | 115 | 62.97 | 3.13 |
Table 2.
Age at First Myocardial Infarction in AOK (N = 69627) by quantiles.
| Year | n | M | SD | Quantiles | ||||||||
|---|---|---|---|---|---|---|---|---|---|---|---|---|
| 10% | 20% | 30% | 40% | 50% | 60% | 70% | 80% | 90% | ||||
| Men (N = 41812) | ||||||||||||
| 2006 | 3661 | 67.29 | 13.00 | 48.56 | 55.29 | 61.14 | 65.81 | 68.99 | 71.72 | 74.85 | 78.27 | 83.38 |
| 2007 | 3695 | 67.19 | 12.80 | 48.99 | 55.30 | 60.20 | 65.37 | 68.81 | 71.70 | 75.08 | 78.51 | 82.93 |
| 2008 | 3685 | 67.38 | 12.81 | 49.07 | 55.37 | 60.23 | 65.73 | 69.19 | 72.16 | 75.17 | 78.65 | 83.06 |
| 2009 | 3552 | 67.43 | 13.20 | 48.59 | 54.78 | 60.00 | 65.52 | 69.46 | 72.50 | 75.79 | 79.17 | 83.54 |
| 2010 | 3554 | 67.11 | 13.07 | 48.76 | 54.54 | 59.59 | 64.79 | 69.09 | 72.11 | 75.27 | 79.06 | 83.27 |
| 2011 | 3999 | 67.43 | 13.23 | 48.64 | 54.52 | 59.67 | 64.65 | 69.70 | 72.89 | 75.98 | 79.42 | 83.69 |
| 2012 | 4082 | 67.45 | 13.16 | 49.25 | 54.65 | 59.84 | 64.22 | 69.46 | 72.98 | 75.96 | 79.55 | 83.60 |
| 2013 | 4017 | 67.15 | 13.13 | 49.11 | 54.57 | 58.97 | 63.56 | 68.36 | 72.71 | 75.83 | 79.40 | 83.89 |
| 2014 | 3973 | 67.23 | 13.18 | 49.88 | 54.80 | 58.84 | 63.30 | 68.08 | 72.82 | 75.97 | 79.43 | 83.93 |
| 2015 | 3909 | 66.76 | 13.17 | 49.13 | 54.12 | 58.84 | 63.13 | 67.27 | 72.12 | 75.49 | 79.08 | 83.40 |
| 2016 | 3685 | 66.64 | 13.19 | 49.51 | 54.41 | 58.47 | 62.41 | 66.47 | 71.43 | 75.73 | 79.12 | 83.31 |
| Women (N = 27815) | ||||||||||||
| 2006 | 2764 | 76.19 | 11.78 | 59.74 | 67.81 | 71.83 | 75.38 | 78.20 | 80.65 | 83.24 | 85.72 | 89.26 |
| 2007 | 2675 | 76.49 | 11.80 | 59.79 | 68.12 | 72.10 | 75.83 | 78.73 | 81.17 | 83.68 | 86.02 | 89.24 |
| 2008 | 2581 | 76.46 | 11.55 | 59.93 | 68.92 | 72.55 | 75.73 | 78.53 | 80.88 | 83.28 | 85.88 | 88.73 |
| 2009 | 2492 | 76.87 | 12.15 | 59.33 | 69.02 | 73.12 | 76.27 | 79.27 | 81.57 | 83.97 | 86.48 | 89.61 |
| 2010 | 2432 | 76.39 | 12.32 | 58.40 | 68.33 | 72.31 | 75.65 | 78.90 | 81.54 | 84.12 | 86.58 | 89.38 |
| 2011 | 2666 | 75.78 | 12.52 | 57.48 | 66.33 | 72.07 | 75.12 | 78.01 | 81.20 | 83.56 | 86.44 | 89.31 |
| 2012 | 2719 | 75.75 | 12.30 | 56.71 | 66.59 | 72.26 | 75.54 | 78.21 | 80.97 | 83.36 | 85.74 | 89.03 |
| 2013 | 2537 | 76.14 | 12.38 | 57.56 | 66.56 | 72.66 | 75.85 | 78.48 | 81.25 | 83.67 | 86.39 | 89.62 |
| 2014 | 2427 | 75.41 | 12.59 | 55.47 | 64.90 | 72.08 | 75.47 | 78.18 | 80.52 | 83.17 | 85.87 | 88.83 |
| 2015 | 2375 | 75.71 | 12.59 | 56.18 | 65.24 | 71.89 | 76.07 | 78.31 | 80.77 | 83.43 | 86.24 | 89.73 |
| 2016 | 2147 | 75.30 | 12.91 | 56.37 | 63.87 | 70.25 | 75.35 | 78.23 | 80.73 | 83.45 | 86.11 | 89.55 |
Figure 1.
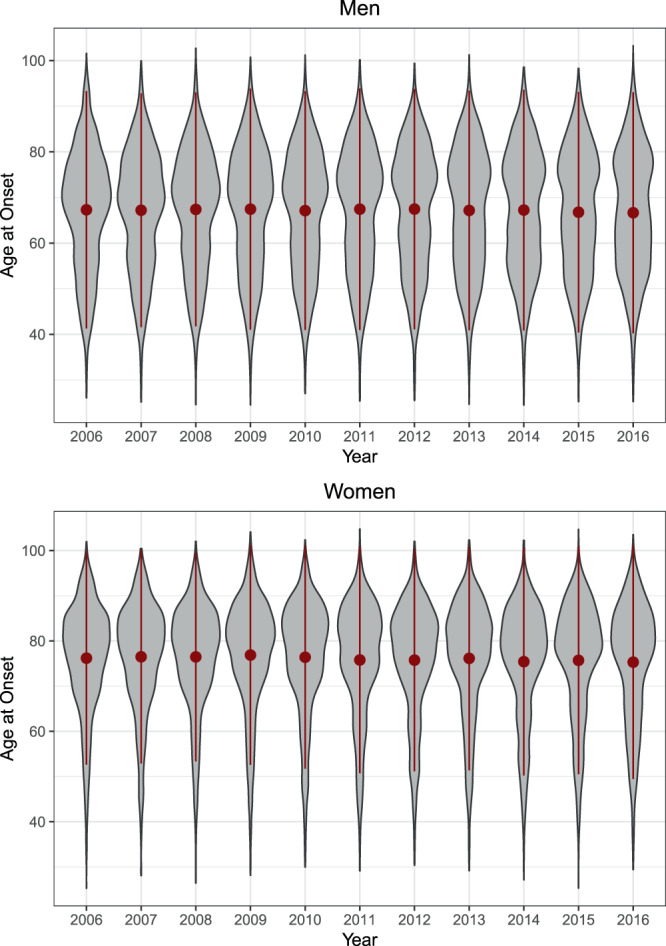
Descriptive trends in age at first myocardial infarction across the lifespan over time via Violin plots (AOK; N = 69627). Red points and lines depict the mean age at onset and the standard deviation of age at onset.
Figure 2.
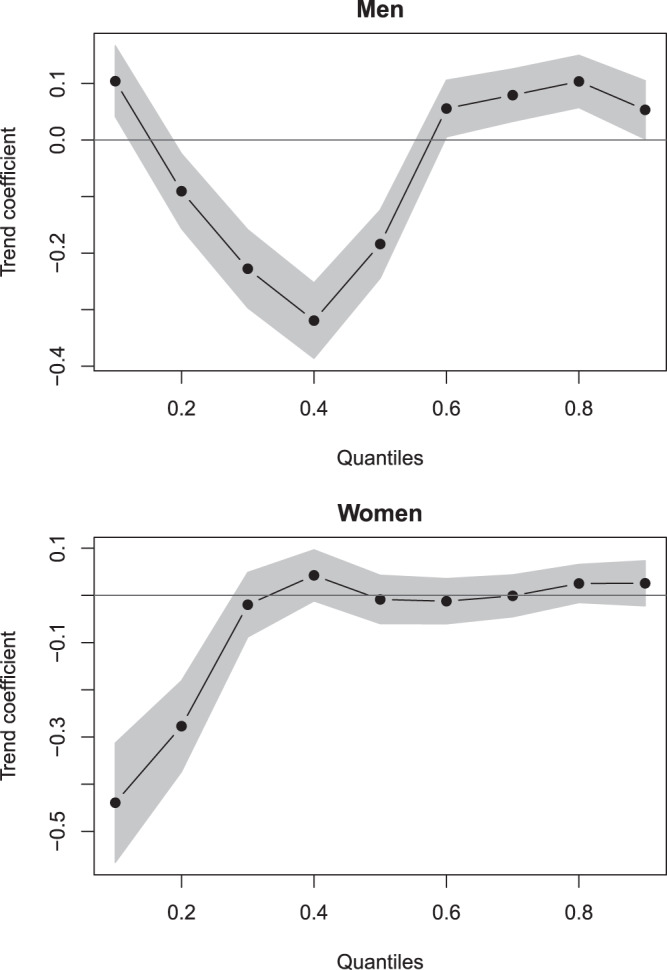
Effects of time on age at first myocardial infarction across quantiles (AOK; N = 69627). Shaded areas depict 95% confidence intervals so that those coefficients with shaded areas not encompassing zero can be considered statistically significant.
In women, the mean age at first MI also slightly decreased from 76.2 (in 2006) to 75.3 (in 2016). Again, wide differences across the distribution emerged (Fig. 1): Within the 10%, 20% and 30% quantiles, age at onset decreased (approx. age < 72), while within the 40%-90% quantiles, it seemed to marginally increase or remained relatively stable (approx. age of onset > 72). Via quantile regression, we found that only the decreasing trends within the 10% and 20% quantiles (approx. age < 70) were significant, as displayed in Fig. 2. The joint test for equality of slopes was significant and confirmed the heterogeneous trends across quantiles, p < 0.001. Therefore, the age of onset in women decreased over time for first MIs before the age of 70 but remained relatively stable thereafter. Additional analyses, summarized in the Appendix, suggest that the age of onset of ST-segment elevation myocardial infarctions (STEMIs) mostly decreased, while differential trends across the lifespan were mostly observed in non-ST-segment elevation myocardial infarctions (NSTEMIs).
KORA
Descriptive trends in age at first MI are displayed in Table 1 and Table 3 and visualized in Fig. 3. Overall, N = 9954 first myocardial infarctions and coronary deaths were recorded, N = 7433 in men and N = 2521 in women. The number of cases of MI slightly decreased over time, with n = 601 MIs in 2000 and n = 475 MIs in 2016.
Table 3.
Age at First Myocardial Infarction in KORA (N = 9954) by age quantiles.
| Year | n | M | SD | Age quantiles | ||||||||
|---|---|---|---|---|---|---|---|---|---|---|---|---|
| 10% | 20% | 30% | 40% | 50% | 60% | 70% | 80% | 90% | ||||
| Men (N = 7433) | ||||||||||||
| 2000 | 449 | 60.32 | 9.89 | 46.00 | 51.00 | 55.00 | 59.00 | 62.00 | 65.00 | 67.00 | 70.00 | 72.00 |
| 2001 | 464 | 60.37 | 9.92 | 46.00 | 51.00 | 56.00 | 59.20 | 62.00 | 64.80 | 67.00 | 70.00 | 72.00 |
| 2002 | 494 | 59.81 | 9.70 | 46.00 | 52.00 | 55.00 | 59.00 | 62.00 | 63.00 | 66.00 | 69.00 | 72.00 |
| 2003 | 457 | 60.65 | 9.75 | 46.60 | 52.00 | 56.00 | 59.00 | 62.00 | 65.00 | 68.00 | 70.00 | 72.00 |
| 2004 | 457 | 60.11 | 9.64 | 46.00 | 52.00 | 55.00 | 60.00 | 62.00 | 64.00 | 66.20 | 69.00 | 71.00 |
| 2005 | 500 | 61.02 | 9.36 | 47.00 | 53.00 | 57.00 | 60.00 | 63.00 | 65.00 | 67.00 | 69.00 | 72.00 |
| 2006 | 431 | 60.57 | 9.57 | 46.00 | 51.00 | 56.00 | 59.00 | 63.00 | 65.00 | 67.00 | 70.00 | 72.00 |
| 2007 | 395 | 59.61 | 9.82 | 46.00 | 51.00 | 55.00 | 58.00 | 61.00 | 64.40 | 67.00 | 69.00 | 71.00 |
| 2008 | 419 | 60.54 | 9.57 | 47.00 | 51.00 | 56.00 | 59.00 | 62.00 | 65.00 | 68.00 | 70.00 | 72.00 |
| 2009 | 423 | 60.75 | 9.62 | 48.00 | 52.00 | 55.60 | 59.00 | 63.00 | 66.00 | 68.00 | 70.00 | 72.00 |
| 2010 | 448 | 60.07 | 10.17 | 45.70 | 51.00 | 54.00 | 58.00 | 61.50 | 65.00 | 68.00 | 70.00 | 72.00 |
| 2011 | 438 | 59.90 | 10.05 | 46.00 | 50.00 | 54.00 | 57.00 | 61.00 | 64.00 | 67.00 | 71.00 | 73.00 |
| 2012 | 429 | 60.71 | 9.81 | 46.00 | 51.00 | 55.00 | 58.20 | 62.00 | 66.00 | 68.00 | 71.00 | 72.00 |
| 2013 | 442 | 61.00 | 9.99 | 47.00 | 52.00 | 56.00 | 60.00 | 62.00 | 65.00 | 68.00 | 71.00 | 73.00 |
| 2014 | 422 | 60.25 | 9.19 | 48.00 | 51.00 | 55.00 | 59.00 | 62.00 | 64.00 | 66.00 | 69.00 | 72.00 |
| 2015 | 405 | 59.96 | 9.82 | 47.00 | 51.00 | 54.00 | 57.00 | 61.00 | 64.00 | 67.00 | 69.00 | 72.60 |
| 2016 | 360 | 60.08 | 8.76 | 48.00 | 52.00 | 55.00 | 57.00 | 61.00 | 63.00 | 66.00 | 68.00 | 72.00 |
| Women (N = 2521) | ||||||||||||
| 2000 | 152 | 65.03 | 8.67 | 54.00 | 60.00 | 63.00 | 65.00 | 67.00 | 69.00 | 71.00 | 72.00 | 73.00 |
| 2001 | 170 | 63.56 | 8.83 | 51.00 | 56.00 | 60.70 | 62.00 | 65.00 | 68.00 | 70.00 | 72.00 | 73.00 |
| 2002 | 151 | 63.83 | 9.07 | 49.00 | 58.00 | 61.00 | 64.00 | 66.00 | 69.00 | 70.00 | 72.00 | 73.00 |
| 2003 | 168 | 64.24 | 8.35 | 53.70 | 58.00 | 60.10 | 64.00 | 67.00 | 68.00 | 70.00 | 72.00 | 73.00 |
| 2004 | 139 | 65.96 | 7.16 | 57.00 | 60.00 | 64.00 | 65.20 | 68.00 | 69.80 | 71.00 | 72.00 | 73.00 |
| 2005 | 179 | 62.71 | 9.42 | 49.00 | 54.00 | 58.00 | 62.00 | 66.00 | 68.00 | 70.00 | 71.00 | 73.00 |
| 2006 | 150 | 63.51 | 9.50 | 49.90 | 55.00 | 60.00 | 65.00 | 66.00 | 68.00 | 69.30 | 72.00 | 74.00 |
| 2007 | 145 | 63.41 | 9.12 | 48.00 | 57.00 | 60.00 | 64.00 | 67.00 | 68.00 | 69.00 | 71.00 | 73.00 |
| 2008 | 140 | 64.98 | 7.96 | 53.90 | 59.00 | 61.70 | 65.00 | 67.00 | 69.00 | 70.00 | 72.20 | 73.00 |
| 2009 | 150 | 63.05 | 9.68 | 48.80 | 54.80 | 60.70 | 63.00 | 66.00 | 68.00 | 70.00 | 71.00 | 72.10 |
| 2010 | 161 | 62.72 | 10.16 | 46.00 | 53.00 | 58.00 | 63.00 | 67.00 | 68.00 | 70.00 | 72.00 | 73.00 |
| 2011 | 158 | 65.16 | 7.98 | 52.00 | 60.00 | 62.00 | 64.00 | 68.00 | 70.00 | 71.00 | 72.00 | 73.00 |
| 2012 | 130 | 62.23 | 9.38 | 48.00 | 52.00 | 58.00 | 62.00 | 64.50 | 66.00 | 69.00 | 72.00 | 73.00 |
| 2013 | 149 | 63.79 | 8.98 | 51.80 | 57.00 | 60.00 | 63.00 | 66.00 | 68.80 | 70.00 | 72.00 | 73.00 |
| 2014 | 138 | 61.83 | 9.55 | 49.00 | 53.00 | 58.00 | 60.80 | 64.00 | 67.00 | 69.00 | 71.00 | 72.30 |
| 2015 | 126 | 61.83 | 11.04 | 46.00 | 52.00 | 57.00 | 62.00 | 65.00 | 68.00 | 70.00 | 71.00 | 73.00 |
| 2016 | 115 | 62.97 | 9.54 | 48.40 | 55.80 | 59.00 | 62.00 | 65.00 | 67.00 | 71.00 | 72.00 | 73.00 |
Figure 3.
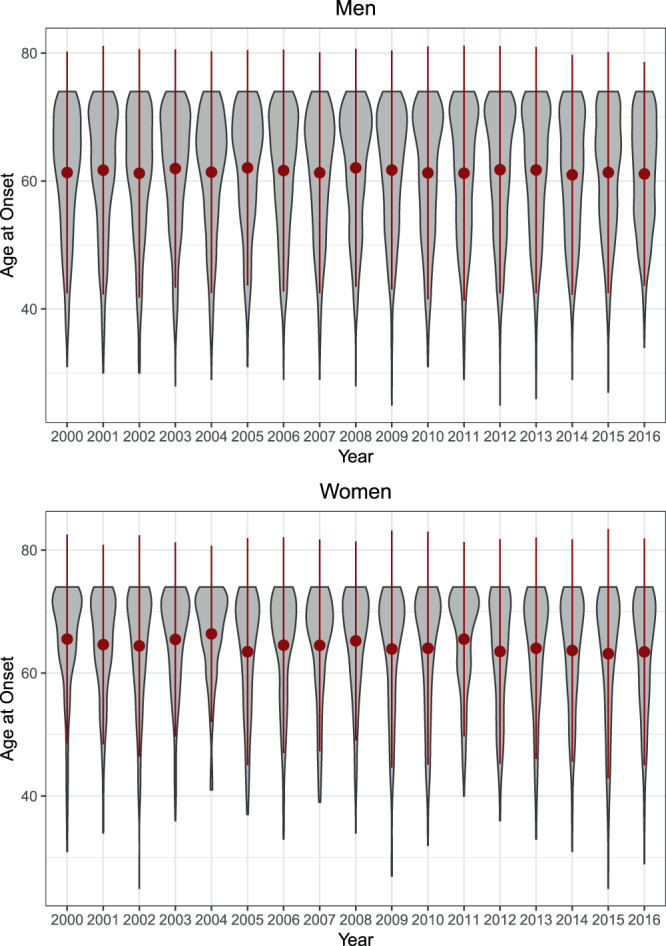
Descriptive trends in age at first myocardial infarction across the lifespan over time via Violin plots (KORA; N = 9954). Thicker areas represent more MIs. Red points and lines depict the mean age at onset and the standard deviation of age at onset.
In men, the mean age at first MI slightly decreased from 60.3 (in 2000) to 60.1 (in 2016). However, the trends in the population differed significantly (Fig. 3): In the 10% and 20% quantiles, age at onset increased (approx. age of onset < 52), while in the 40–80% quantiles, it decreased (approx. age > 55 and < 70). The age at onset in the 30% and 90% quantiles remained relatively constant. When controlling for the ageing population via quantile regression, the trends obtained with the health insurance data were generally replicated, as depicted in Fig. 4. However, only in the 10% quantile (approx. age of onset < 50) did age at onset significantly increase over time, and only in the 40%, 50%, 60%, and 70% quantiles did it significantly decrease over time (approx. age > 55 and <70). The joint test for equality of slopes was significant and thus confirmed the diverging trends across quantiles, p < 0.001. Therefore, in the KORA data, age of onset decreased for first MI in men between 55 and 70 years of age but increased in men younger than 50.
Figure 4.
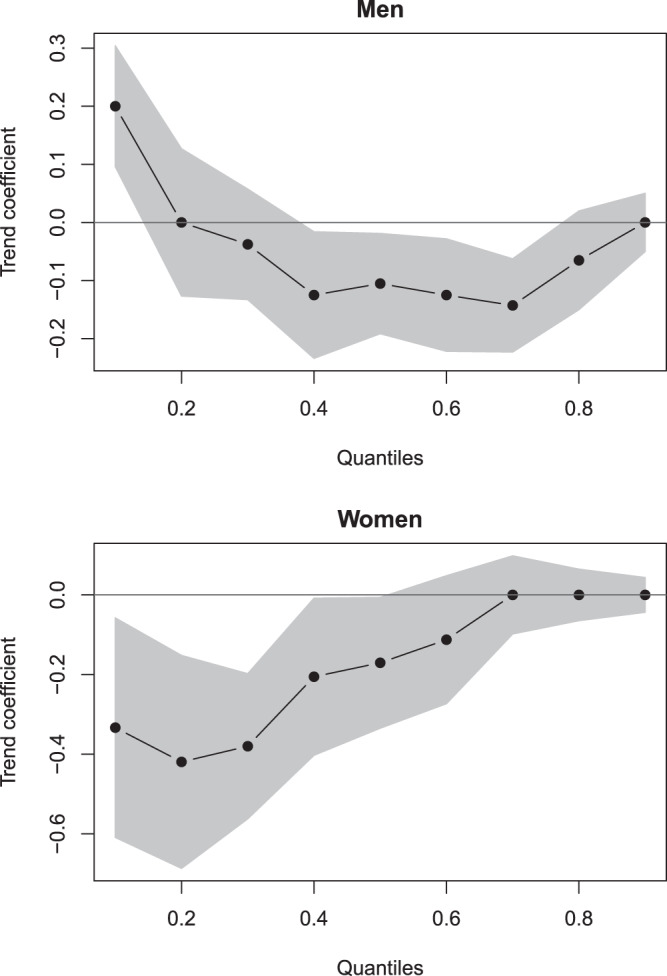
Effects of time on age at first myocardial infarction across quantiles (KORA; N = 9954). Shaded areas depict 95% confidence intervals, so that those coefficients with shaded areas not encompassing zero can be considered statistically significant.
In women, the mean age at first MI decreased from 65.0 (in 2000) to 63.0 (in 2016). Again, there were differences across the distribution (Fig. 3): In the 10%–60% quantiles, age at onset decreased (approx. age of onset < 70), while there were no trends in the 70%, 80% and 90% quantiles (approx. age of onset > 70). When controlling for the ageing population by means of quantile regression, all described trends were replicated, as shown in Fig. 4. However, only the trends in the 10%, 20%, 30%, 40%, and 50% quantiles were statistically significant (age of onset < 68). The joint test for equality of slopes was significant and thus confirmed the diverging trends across quantiles, p = 0.008. Therefore, in the KORA data, age of onset decreased in women for first MI before age 68 but remained relatively stable thereafter.
Discussion
We investigated how the age of onset of myocardial infarction has changed over time. We found that although the mean age of first myocardial infarction did not change much, there were strong diverging trends in the underlying distribution of age at first myocardial infarction. In men, there was a general tendency of age at first MI to increase beyond the age of 70 and below 50, suggesting a compression of MI-related morbidity in this group. Between 50 and 70 years, the mean age at onset, however, decreased, suggesting an expansion of MI-related morbidity. In women, the mean age of onset remained relatively stable or slightly increased for MIs occurring after age 70, while it decreased in the age groups below that age, suggesting an expansion of MI-related morbidity in this age group. However, this finding has to be interpreted against the backdrop of the largest share of onsets taking place far above the age of 70 in women. Therefore, the age at onset of MI showed divergent trends: late myocardial infarctions tended to occur later in life, while regular myocardial infarctions tended to occur earlier in the lifespan.
This is also in line with studies on trends in the age at onset regarding similar diseases. For example, in the case of stroke it has been reported that the mean age increased across time on average, as is the case in our study of MI4. Contrary to this trend that seems to be driven by improvements in older adults, other studies also reported that comparatively younger adults experienced an increasing burden of stroke29. Considering this converging evidence of health improvements in older subpopulations and health deteriorations in comparatively younger adults, it seems likely that shared risk factors between both stroke and MI have changed over time. For example, it seems likely that improvements in the lifestyle of older adults, such as increasing rates of physical activity, have been partly responsible for improved health of older adults. At the same time, trends such as the increasing prevalence of diabetes in younger adults might be responsible for a higher burden of cardiovascular disease in younger adults.
These results bear important implications regarding Fries’ hypothesis of morbidity compression14. There was no uniform development towards postponement of MI onset into higher age groups, as suggested by his hypothesis. Rather, the decreasing mean age at MI onset below 70 can be described as morbidity expansion30. Thus, our results point to two simultaneously existing trends of a compression of morbidity in higher age groups and an expansion of morbidity in younger age groups. The simultaneous existence of both these trends suggests that divergent trends in risk factors might have occurred. The existence of morbidity compression is often argued to result from improved primary prevention and changes in lifestyles in terms of more exercise, consumption of healthier food and decreased smoking rates14,31–33. There is mounting evidence, however, suggesting that while this might be the case in older adults, comparatively younger adults’ lifestyle might have also become unhealthier over time, which might explain the observed effects18.
Although we controlled for changing population age structures in our analyses, neither dataset includes longitudinal behavioural parameters that might permit us to verify potential explanations for the differential development of MI onset in our study populations. This particularly applies to the clinically relevant differentiation between MI with ST-segment elevation (STEMI) and MI with non-ST-segment elevation (NSTEMI). Both are different with respect to their aetiology as well as their short- and long-term prognosis34. The preliminary results reported in the Appendix suggest that the increase in age at onset in higher age groups is mainly visible in ST-elevation myocardial infarction and that the diverging trends are mainly observable in non-ST-elevation myocardial infarction. Thus, future studies should explore the potential mechanisms responsible for the differential trends of MI, possibly by investigating subtypes of MI. Nevertheless, our findings on diverging trends in MI for different age groups are well founded, as they were obtained from two datasets of different geographical origins and collected with different assessment modes.
If these results had been obtained from only a single database, they might be called into question, but they were derived from two very different datasets, lending more credibility to our findings. Although they covered similar age groups, they were collected for different purposes. In Germany, all residents must have health insurance, and in 2011, only 0.2% were uninsured. In Germany, statutory health insurance provides health care coverage for all residents below a fixed income threshold. Individuals above this threshold, government officials and many self-employed are allowed to be privately insured. Consequently, the first dataset consists of routine data for accounting, and the second dataset is register-based for research, depicting women and men from distant geographical areas. The KORA data continuously collected all cases of MI and coronary deaths for 25–74-year-olds in the German region of Augsburg, and the trends can thus be argued to be representative of the region of origin21,22. Claims data, on the other hand, provide large case numbers, but they are more selective with respect to socio-demographic composition. They include a higher proportion of individuals with low incomes and lower occupational positions, but the distributions of age and gender correspond to the population of Lower Saxony and Germany as a whole35.
Notwithstanding that our results were replicated in two samples and that they conform to trends in similar diseases as reported in the literature, future studies should still try to replicate and expand upon our results. For example, although the age at onset has been suggested and used in the literature as one important indicator of disease trends, there are other important metrics which should be investigated by future studies6,36. One avenue for future research could be the use of age-period-cohort models. e.g.17,19,37. Analysing how characteristics of MI are changing across age, time periods and birth cohorts might proof to be one effective way to independently replicate our results.
Thus, in summary, we investigated trends in age at onset in myocardial infarction using two population-based samples from Germany. We found that although there was not much change in the mean age at onset over time, there were large diverging trends across the distribution of age at first myocardial infarction. In both samples, late myocardial infarctions tended to occur later in life, while regular myocardial infarctions tended to occur earlier in the lifespan. This finding suggests the simultaneous existence of two contradicting trends: A compression of MI-related morbidity in higher age groups and an expansion of MI-related morbidity in comparatively younger age groups37. Future studies should explore the robustness of these findings and the mechanisms responsible for these trends.
Supplementary information
Acknowledgements
The work reported in this paper was funded by the Deutsche Forschungsgemeinschaft (DFG) under project number GE1167/15-1 and by the Allgemeine Ortskrankenkasse Niedersachsen (Local Statutory Health Insurance of Lower Saxony, Germany, no funding number assigned) to Siegfried Geyer. The KORA study was initiated and financed by the Helmholtz Zentrum München – German Research Center for Environmental Health, which is funded by the German Federal Ministry of Education and Research (BMBF) and by the State of Bavaria.
Author contributions
Johannes Beller and Siegfried Geyer conceived of the presented idea, performed the statistical analyses and wrote the manuscript. Johann Bauersachs, Andreas Schäfer, Lars Schwettmann, Margit Heier, Annette Peters, and Christa Meisinger provided critical feedback. All authors reviewed the manuscript.
Data availability
The data that support the findings of this study are available from the Helmholtz Zentrum München and the Allgemeine Ortskrankenkasse Niedersachsen, but restrictions apply to the availability of these data, which were used under license for the current study, and so are not publicly available. One can, however, apply for access to the data at the aforementioned institutions.
Competing interests
The authors declare no competing interests.
Footnotes
Publisher’s note Springer Nature remains neutral with regard to jurisdictional claims in published maps and institutional affiliations.
Supplementary information
is available for this paper at 10.1038/s41598-020-66291-4.
References
- 1.Beltrán-Sánchez H, Preston SH, Canudas-Romo V. An integrated approach to cause-of-death analysis: cause-deleted life tables and decompositions of life expectancy. Demographic Research. 2008;19:1323–1350. doi: 10.4054/DemRes.2008.19.35. [DOI] [PMC free article] [PubMed] [Google Scholar]
- 2.Doblhammer G, Kreft D, Dethloff A. Gewonnene Lebensjahre: Langfristige Trends der Sterblichkeit nach Todesursachen in Deutschland und im internationalen Vergleich. Bundesgesundheitsblatt - Gesundheitsforschung - Gesundheitsschutz. 2012;55:448–458. doi: 10.1007/s00103-012-1455-x. [DOI] [PubMed] [Google Scholar]
- 3.Nichols M, Townsend N, Scarborough P, Rayner M. Cardiovascular disease in Europe 2014: epidemiological update. European Heart Journal. 2014;35:2950–2959. doi: 10.1093/eurheartj/ehu299. [DOI] [PubMed] [Google Scholar]
- 4.Shiue I. Age of onset for stroke delayed in the 21st century: What is next? Clinical Neurology and Neurosurgery. 2011;113:725–726. doi: 10.1016/j.clineuro.2011.07.015. [DOI] [PubMed] [Google Scholar]
- 5.Li C, Baek J, Sanchez BN, Morgenstern LB, Lisabeth LD. Temporal trends in age at ischemic stroke onset by ethnicity. Annals of Epidemiology. 2018;28:686–690.e2. doi: 10.1016/j.annepidem.2018.07.010. [DOI] [PMC free article] [PubMed] [Google Scholar]
- 6.Boshuizen H, Greenland S. Average age at first occurrence as an alternative occurrence parameter in epidemiology. International Journal of Epidemiology. 1997;26:867–872. doi: 10.1093/ije/26.4.867. [DOI] [PubMed] [Google Scholar]
- 7.Kang, H.-Y., Lim, S.-J., Suh, H. S. & Liew, D. Estimating the lifetime economic burden of stroke according to the age of onset in South Korea: a cost of illness study. BMC Public Health11 (2011). [DOI] [PMC free article] [PubMed]
- 8.Koopman RJ. Changes in Age at Diagnosis of Type 2 Diabetes Mellitus in the United States, 1988 to 2000. The Annals of Family Medicine. 2005;3:60–63. doi: 10.1370/afm.214. [DOI] [PMC free article] [PubMed] [Google Scholar]
- 9.Bidoli, E. et al. Worldwide Age at Onset of Female Breast Cancer: A 25-Year Population-Based Cancer Registry Study. Scientific Reports9 (2019). [DOI] [PMC free article] [PubMed]
- 10.Lavori PW, et al. Age-period-cohort analysis of secular trends in onset of major depression: Findings in siblings of patients with major affective disorder. Journal of Psychiatric Research. 1987;21:23–35. doi: 10.1016/0022-3956(87)90006-9. [DOI] [PubMed] [Google Scholar]
- 11.Geyer S, Eberhard S, Schmidt BMW, Epping J, Tetzlaff J. Morbidity compression in myocardial infarction 2006 to 2015 in terms of changing rates and age at occurrence: A longitudinal study using claims data from Germany. PLOS ONE. 2018;13:e0202631. doi: 10.1371/journal.pone.0202631. [DOI] [PMC free article] [PubMed] [Google Scholar]
- 12.Molloy GJ, Stamatakis E, Randall G, Hamer M. Marital status, gender and cardiovascular mortality: Behavioural, psychological distress and metabolic explanations. Social Science & Medicine. 2009;69:223–228. doi: 10.1016/j.socscimed.2009.05.010. [DOI] [PMC free article] [PubMed] [Google Scholar]
- 13.Fogel, R. Changes in the Process of Aging During the Twentieth Century: Findings and Procedures of the Early Indicators Project. http://www.nber.org/papers/w9941.pdf10.3386/w9941 (2003).
- 14.Fries JF. Aging, Natural Death, and the Compression of Morbidity. New England Journal of Medicine. 1980;303:130–135. doi: 10.1056/NEJM198007173030304. [DOI] [PubMed] [Google Scholar]
- 15.Finger JD, et al. Time Trends in Cardiometabolic Risk Factors in Adults. Deutsches Aerzteblatt Online. 2016 doi: 10.3238/arztebl.2016.0712. [DOI] [PMC free article] [PubMed] [Google Scholar]
- 16.Finger JD, et al. Time trends in healthy lifestyle among adults in Germany: Results from three national health interview and examination surveys between 1990 and 2011. PLOS ONE. 2019;14:e0222218. doi: 10.1371/journal.pone.0222218. [DOI] [PMC free article] [PubMed] [Google Scholar]
- 17.Diouf I, et al. Evolution of Obesity Prevalence in France: An Age-Period-Cohort Analysis. Epidemiology. 2010;21:360–365. doi: 10.1097/EDE.0b013e3181d5bff5. [DOI] [PMC free article] [PubMed] [Google Scholar]
- 18.Muschik D, et al. Morbidity compression, morbidity expansion, or dynamic equilibrium? The time trend of AOK-insured patients with type 2 diabetes in Lower Saxony, Germany. Journal of Public Health. 2017;25:19–28. doi: 10.1007/s10389-016-0756-1. [DOI] [Google Scholar]
- 19.Reither EN, Hauser RM, Yang Y. Do birth cohorts matter? Age-period-cohort analyses of the obesity epidemic in the United States. Social Science & Medicine. 2009;69:1439–1448. doi: 10.1016/j.socscimed.2009.08.040. [DOI] [PMC free article] [PubMed] [Google Scholar]
- 20.Geyer S. Morbidity compression: a promising and well-established concept? International Journal of Public Health. 2016;61:727–728. doi: 10.1007/s00038-016-0853-5. [DOI] [PubMed] [Google Scholar]
- 21.Holle R, Happich M, Löwel H, Wichmann H. KORA - A Research Platform for Population Based Health Research. Das Gesundheitswesen. 2005;67:19–25. doi: 10.1055/s-2005-858235. [DOI] [PubMed] [Google Scholar]
- 22.Löwel H, Meisinger C, Heier M, Hörmann A. The Population-Based Acute Myocardial Infarction (AMI) Registry of the MONICA/KORA Study Region of Augsburg. Das Gesundheitswesen. 2005;67:31–37. doi: 10.1055/s-2005-858241. [DOI] [PubMed] [Google Scholar]
- 23.Meisinger C, Peters A, Linseisen J. Vom MONICA-Projekt über KORA zur NAKO-Studie: Vom praktischen Nutzen von Bevölkerungsstudien in der Region Augsburg. Das Gesundheitswesen. 2016;78:84–90. doi: 10.1055/s-0041-110916. [DOI] [PubMed] [Google Scholar]
- 24.Koenker R, Bassett G. Regression Quantiles. Econometrica. 1978;46:33. doi: 10.2307/1913643. [DOI] [Google Scholar]
- 25.Aburto TC, Poti JM, Popkin BM. Patterns and trends in the intake distribution of manufactured and homemade sugar-sweetened beverages in pre-tax Mexico, 1999–2012. Public Health Nutrition. 2018;21:3296–3306. doi: 10.1017/S1368980018002677. [DOI] [PMC free article] [PubMed] [Google Scholar]
- 26.Koenker R. Quantile Regression: 40 Years On. Annual Review of Economics. 2017;9:155–176. doi: 10.1146/annurev-economics-063016-103651. [DOI] [Google Scholar]
- 27.Medford A, Christensen K, Skytthe A, Vaupel JW. A Cohort Comparison of Lifespan After Age 100 in Denmark and Sweden: Are Only the Oldest Getting Older? Demography. 2019;56:665–677. doi: 10.1007/s13524-018-0755-7. [DOI] [PMC free article] [PubMed] [Google Scholar]
- 28.Williams JA, Zimmerman FJ, Bell JF. Norms and Trends of Sleep Time Among US Children and Adolescents. JAMA Pediatrics. 2013;167:55. doi: 10.1001/jamapediatrics.2013.423. [DOI] [PMC free article] [PubMed] [Google Scholar]
- 29.Béjot, Y., Delpont, B. & Giroud, M. Rising Stroke Incidence in Young Adults: More Epidemiological Evidence, More Questions to Be Answered. Journal of the American Heart Association5 (2016). [DOI] [PMC free article] [PubMed]
- 30.Gruenberg EM. The Failures of Success. The Milbank Memorial Fund Quarterly. Health and Society. 1977;55:3. doi: 10.2307/3349592. [DOI] [PubMed] [Google Scholar]
- 31.Fries JF, Bruce B, Chakravarty E. Compression of Morbidity 1980–2011: A Focused Review of Paradigms and Progress. Journal of Aging Research. 2011;2011:1–10. doi: 10.4061/2011/261702. [DOI] [PMC free article] [PubMed] [Google Scholar]
- 32.Gehlich, K. H. et al. Consumption of fruits and vegetables: improved physical health, mental health, physical functioning and cognitive health in older adults from 11 European countries. Aging & Mental Health 1–8, 10.1080/13607863.2019.1571011 (2019). [DOI] [PubMed]
- 33.Sperlich, S., Beller, J., Epping, J., Tetzlaff, J. & Geyer, S. Trends in self-rated health among the elderly population in Germany from 1995 to 2015 – the influence of temporal change in leisure time physical activity. BMC Public Health 20 (2020). [DOI] [PMC free article] [PubMed]
- 34.Plakht Y, Gilutz H, Shiyovich A. Temporal trends in acute myocardial infarction: What about survival of hospital survivors? Disparities between STEMI & NSTEMI remain. Soroka acute myocardial infarction II (SAMI-II) project. International Journal of Cardiology. 2016;203:1073–1081. doi: 10.1016/j.ijcard.2015.11.072. [DOI] [PubMed] [Google Scholar]
- 35.Jaunzeme J, Eberhard S, Geyer S. Wie „repräsentativ“ sind GKV-Daten?: Demografische und soziale Unterschiede und Ähnlichkeiten zwischen einer GKV-Versichertenpopulation, der Bevölkerung Niedersachsens sowie der Bundesrepublik am Beispiel der AOK Niedersachsen. Bundesgesundheitsblatt - Gesundheitsforschung - Gesundheitsschutz. 2013;56:447–454. doi: 10.1007/s00103-012-1626-9. [DOI] [PubMed] [Google Scholar]
- 36.Brinks, R., Landwehr, S. & Waldeyer, R. Age of onset in chronic diseases: new method and application to dementia in Germany. Population Health Metrics11 (2013). [DOI] [PMC free article] [PubMed]
- 37.Beller J, et al. Trends in grip strength: Age, period, and cohort effects on grip strength in older adults from Germany, Sweden, and Spain. SSM - Population Health. 2019;9:100456. doi: 10.1016/j.ssmph.2019.100456. [DOI] [PMC free article] [PubMed] [Google Scholar]
Associated Data
This section collects any data citations, data availability statements, or supplementary materials included in this article.
Supplementary Materials
Data Availability Statement
The data that support the findings of this study are available from the Helmholtz Zentrum München and the Allgemeine Ortskrankenkasse Niedersachsen, but restrictions apply to the availability of these data, which were used under license for the current study, and so are not publicly available. One can, however, apply for access to the data at the aforementioned institutions.