

Abstract
Background
Low muscle radiodensity is associated with mortality in a variety of cancer types. Biochemical and morphological correlates are unknown. We aimed to evaluate triglyceride (TG) content and location as a function of computed tomography (CT)‐derived measures of skeletal muscle radiodensity in cancer patients.
Methods
Rectus abdominis (RA) biopsies were collected during cancer surgery from 75 patients diagnosed with cancer. Thin‐layer chromatography and gas chromatography were used for quantification of TG content of the muscle. Axial CT images of lumbar vertebra were used to measure muscle radiodensity. Oil Red O staining was used to determine the location of neutral lipids in frozen muscle sections.
Results
There was wide variation in RA radiodensity in repeated measures (CV% ranged from 3 to 55% based on 10 serial images) as well as within one slice (CV% ranged from 6 to 61% based on 10 subregions). RA radiodensity and total lumbar muscle radiodensity were inversely associated with TG content of RA (r = −0.396, P < 0.001, and r = −0.355, P = 0.002, respectively). Of the total percentage area of muscle staining positive for neutral lipid, 54 ± 17% was present as extramyocellular lipids (range 23.5–77.8%) and 46 ± 17% (range 22.2–76.5%) present as intramyocellular lipid droplets.
Conclusions
Repeated measures revealed wide variation in radiodensity of RA muscle, both vertically and horizontally. Low muscle radiodensity reflects high level of TG in patients with cancer. Non‐uniform distribution of intramyocellular and extramyocellular lipids was evident using light microscopy. These results warrant investigation of mechanisms resulting in lipid deposition in muscles of cancer patients.
Keywords: Fat infiltration, Hounsfield units, Muscle attenuation, Myosteatosis, Rectus abdominis, Skeletal muscle
Introduction
Computed tomography (CT) imaging has recently revealed that a reduced level of muscle radiodensity is associated with shorter survival and systemic inflammation in cancer patients.1, 2, 3, 4, 5, 6 Radiodensity is measured in Hounsfield units (HU), which is a linear transformation of the attenuation coefficient, where the radiodensity of distilled water at standard pressure and temperature is defined as 0 HU and the radiodensity of air at standard temperature and pressure is defined as −1000 HU.7, 8 Reduced muscle radiodensity has also been associated with insulin resistance,9, 10 mitochondrial dysfunction,11 decrease in contractile force of the muscle,12 low aerobic capacity,9 and impaired lipolytic response.13
The presence of abnormal levels of lipid in skeletal muscle has been associated with aging,14, 15 frailty,16 chronic back pain,17, 18 diabetes,19, 20, 21, 22 obesity,19, 22, 23 chronic obstructive pulmonary disease,24 and cancer.25 Lipid content has been reported in variety of muscle groups, including soleus,26, 27, 28 tibialis anterior,26, 28 vastus lateralis,29, 30 and mid‐thigh9, 31, 32 and is noted for its non‐uniform distribution across the length of a muscle.33 Even in healthy muscle, lipid depots are clustered in certain areas,34, 35 notably in the vascularized areas of the intermuscular connective tissue.36 On this basis, it was expected that lipids would not be uniformly distributed in the muscles of cancer patients and there would be variation in muscle radiodensity within the same muscle group.
Based on a study by Goodpaster et al., 32 in which the relationship of mid‐thigh muscle radiodensity and triglyceride (TG) content in healthy and diabetic patients was reported, it has been assumed that low muscle radiodensity is related to high TG content of rectus abdominis (RA). However, this relationship between radiodensity and TG content must be re‐examined in cancer patients for a number of reasons. First, body composition studies in cancer patients are typically performed using CT images acquired in the lumbar region axial images at the third lumbar vertebra (L3)]. The physicochemical properties of lumbar muscles may differ substantially from muscles of the limb. Second, in the report from Goodpaster and coworkers, muscle radiodensity was reported as mean radiodensity from all pixels within the range of 0–100 HU at mid‐thigh cross section,32 whereas in the oncology setting, standardized measures of muscle between −29 and 150 HU are widely applied.37
Skeletal muscles contain lipid depots found deep in the fascia and within muscles, referred to as extramyocellular lipid (EMCL) as well as lipid droplets inside muscle fibres, referred to as intramyocellular lipid (IMCL). IMCL is associated with insulin resistance, inflammation, and functional deficit in skeletal muscle.38, 39 EMCL can originate from adipogenic differentiation of stem cell populations of skeletal muscle.40 In cancer patients, it is not known whether lipids are located inside muscle fibres as IMCL or adjacent to the muscle fibres within adipocytes as EMCL. The aetiology of each lipid depot is different; therefore, characterization of location of lipid deposition in muscles is important.
A number of studies have used RA biopsies in cancer patients to delineate biological features associated with low muscle mass and radiodensity.41, 42, 43, 44 The primary aim of this study was to gain an appreciation of the variation in muscle radiodensity within the RA. Our collateral aim was to investigate the association between the clinically derived measure of muscle radiodensity and TG content in the RA of cancer patients. Finally, we sought to understand how lipid content was distributed in the intramyocellular and extramyocellular compartments.
Materials and methods
Ethics statement
The study was approved by the Health Research Ethics Board of Alberta—Cancer Committee. Patients undergoing elective abdominal surgery were consecutively approached to participate in tumour and tissue banking at a hepatopancreatobiliary surgical service in Alberta, Canada. Muscle biopsies were obtained from the University of Calgary Hepatopancreaticobiliary/Gastrointestinal Tumor Bank. Three per cent of approached patients declined participation. Patients provided written informed consent for muscle biopsy and tissue banking. Release of 75 samples from the bank for analysis, as well as patient information (demographic, clinical, and operative data) from medical records, was performed under the auspices of Protocol ETH‐21709: The Molecular Profile of Cancer Cachexia.
Subjects and muscle biopsies
The study cohort and conditions for acquisition of muscle samples have been described previously.43 Briefly, RA biopsies (0.5–3 g) were collected from cancer patients (>18 years old) undergoing open abdominal surgery scheduled as part of their clinical care. Biopsies were collected at the start of surgery using sharp dissection and without the use of electrocautery. Samples were processed under sterile conditions. Visible adipose and connective tissues were trimmed. One piece of biopsy was immediately frozen in liquid nitrogen and stored at −80°C. Another piece was frozen in isopentane cooled at −160°C in liquid nitrogen and stored at −80°C for cryostat sectioning and Oil Red O (ORO) staining and morphological analysis. Diagnosis was confirmed before including patients in current study. Age and cancer type were abstracted from medical charts.
Computed tomography image analysis
Pre‐operative CT scans completed with a spiral CT scanner for initial cancer staging and surgical planning were used to quantify skeletal muscle area and radiodensity.45, 46 Images were analysed using SliceOmatic® V4.2 software with CT image parameters that include contrast, 5 mm slice thickness, 120 kVP, and 290 mA. Total skeletal muscle area (cm2) was evaluated on an axial single image at L3 using Hounsfield unit (HU) thresholds of −29 to 150 for skeletal muscle.45 The sum of skeletal cross‐sectional muscle areas was normalized for stature (m2) and reported as skeletal muscle index (cm2/m2). Muscle radiodensity was assessed as the mean value for the full range of −29 to +150 HU. Mean lumbar muscle radiodensity is reported for the entire muscle area (quadratus lumborum, psoas, erector spinae, external obliques, transverse abdominis, internal obliques, and RA) and RA alone within the L3 image. Mean time period between CT image and biopsy collection was 35 ± 59 days. To examine the variation in muscle radiodensity within RA, a series of 10 vertical slices at 5 mm intervals from each other were analysed for all patients. To examine the variation within same slice of RA, muscle radiodensity was measured at 10 different regions of interest in the single‐image slice in 13 patients. Ten different regions of interest were selected in the single‐image slice. The area near the boundary of the muscles was avoided to ensure that subcutaneous, visceral adipose, tissue and intramuscular fat area were excluded.
Triglyceride content of rectus abdominis
Triglyceride content of each muscle biopsy was analysed in duplicate. Biopsy (≈50 mg) was ground using a frozen pestle and mortar without letting the muscle tissue thaw. Ground tissue was homogenized in 1.6 mL of calcium chloride (CaCl2; 0.025%) solution with glass beads (0.5 mm diameter; FastPrep®‐24, MP Biomedicals, Santa Ana, CA, USA) in 20 s intervals for 1 min total. Samples were placed on ice for at least 15 s between each homogenization interval. A modified Folch method was used to extract lipids using chloroform/methanol (2:1, v/v) as previously described.47, 48 The TG fraction was isolated on G‐plates, and the TG band was identified and scraped from G‐plates. An internal standard C15:0 (10.2 mg per 100 mL of hexane) was added, followed by saponification and methylation. Fatty acid composition was determined using gas chromatography–flame ionization detector analysis on a Varian 3900 (Varian Instruments, Georgetown, ON, Canada). Fatty acids were separated between 6 and 24 carbon chain lengths and identified using a fatty acid standard of known composition (GLC‐82 and GLC‐502, Nu‐Chek‐Prep, USA). Quantity of fatty acids within the TG fractions was calculated by comparison with the known concentration of the internal standard, and sum of all fatty acids was reported as total TG. The coefficient of variance was <5%.
Immunofluorescence: Oil Red O
Tissues were cryosectioned transversely (10 μm thick) and stained for neutral lipid content using ORO as previously described.49 Primary and secondary antibodies are described in the supplementary materials (Supporting Information, Table S1 ). Laminin staining and dystrophin staining were used to define muscle cell membranes, aiding in lipid location. Briefly, sections were fixed with 10% formalin, followed by incubation with primary antibodies, laminin (1:200) and dystrophin (1:25), and secondary antibody, Alexa Fluor 488. Sections were immersed in ORO for 30 min at room temperature. Muscle sections were visualized with a spinning disk confocal microscope (Quorum Wave FX Spinning Disc Confocal System, Quorum Technologies). An Electron‐Multiplying Charge‐Coupled Device cooled camera (Hamamatsu; Quorum Technologies, Guelph, 80 ON, Canada) and Volocity 6.3 software (PerkinElmer, Waltham, MA, USA) were used to capture and analyse all images. Visualization and quantification were performed as previously described.50, 51 Z‐stacked images captured tissue sections using a 20×/0.85 oil lens and were assembled together and plane merged to create a composite image that enabled the visualization of a whole and clear tissue cross section. A software script was established to identify muscle fibres using intensity of the laminin/dystrophin stain. Neutral lipids were quantified by establishing thresholds for the intensity of ORO staining and calculating the number of red pixels in relation to μm2 of the section analysed. Once thresholds were set, quantitation then proceeded by Volocity software. The total area stained with ORO was reported as a percentage of the total area of tissue analysed. Intramyocellular and extramyocellular lipids were defined based on whether ORO stain was present inside or outside muscle fibre boundaries delimited by laminin/dystrophin staining.
Immunofluorescence: fibre types
Muscle serial sections (10 μm) were cryosectioned (cryostat Leica model CM300) transversely at −22°C and stored at −80°C until staining. Myosin heavy chain (MyHC) I, IID, and IIA were determined as previously described.52 Primary and secondary antibodies are described in Supporting Information, Table S2. After the secondary antibody application, a nuclear stain (4′,6‐diamidino‐2‐phenylindole, DAPI) was added for 2 min and washed. Slides (ApexTM superior adhesive slides, Leica Biosystems) were mounted, covered, and let dry for 12 h. Images for tissue sections were acquired using a 20×/0.85 oil lens with a spinning disk confocal microscope (Quorum Wave FX Spinning Disc Confocal System, Quorum technologies). Individual Z‐stacked images were assembled to create a composite image of a whole‐tissue cross section. Tissue images were captured and analysed with Volocity 6.3 software (PerkinElmer). A software script was established to identify muscle fibres types (I, I/IIA, IIA, IIA/D, and D) using intensity of the MyHC stains and quantified automatically by the software.
Statistical analysis
Descriptive statistics were reported as mean ± standard deviation. Categorical data were presented as counts with percentages. Shapiro–Wilk test was used to test for normality. TG data were not normally distributed, so non‐parametric tests were used for analysis. Comparisons between groups were conducted using Mann–Whitney U test and χ 2 test for categorical variables. For the association between TG content of RA and muscle radiodensity, Spearman's rho (non‐parametric test) was used because TG content data were not normally distributed. Least significant change was determined by international standards as set by the International Society for Clinical Densitometry.53 Statistical significance was reported when P‐value <0.05. Correlation coefficients are referred to as high (>0.5), moderate (0.3–0.5), and low (<0.3). All statistical analyses were performed using IBM SPSS® software, Version 20 (Chicago, IL, USA) for Windows.
Results
Patient characteristics
Patient characteristics are shown in Table 1. The study population consisted of 58 (77%) male patients and 17 (23%) female patients with a mean age of 63.2 ± 10.9 years and mean body mass index of 25.0 ± 10.6 kg/m2. There was significant difference in mean skeletal muscle index, muscle radiodensity, cross‐sectional area of subcutaneous adipose tissue, and TG content of RA between male and female patients (Table 1). Colorectal cancer was the most common cancer type, comprising 44% of the population followed by pancreatic cancer (29%). Almost a quarter of the patients had metastatic disease. Hypertension (37%) was the most common co‐morbidity followed by diabetes (17%) and cardiovascular disease (17%).
Table 1.
Characteristics of patients with cancer
| Male (n = 58) | Female (n = 17) | All patients (n = 75) | P‐value | |
|---|---|---|---|---|
| Age (years), mean ± SD | 62.6 ± 11.4 | 66.2 ± 7.0 | 63.2 ± 10.9 | NS |
| Tumour type, N (%) | ||||
| Colorectal | 26(45) | 7(41) | 33(44) | NS |
| Pancreatic | 18(31) | 4(31) | 22(29) | NS |
| Other gastrointestinala | 15(25) | 5(29) | 20(27) | NS |
| Presence of metastasis, N (%) | 12(20) | 8(47) | 20(26) | NS |
| BMIb (kg/m2), mean ± SD | 24.9 ± 10.1 | 25.4 ± 12.7 | 25.0 ± 10.6 | NS |
| CT image measures at L3 | ||||
| Skeletal muscle index (cm2/m2) | 49.4 ± 8.1 | 41.0 ± 6.3 | 47.9 ± 8.7 | 0.001 |
| Muscle radiodensity (HU) | 33.2 ± 9.3 | 26.7 ± 8.3 | 31.9 ± 9.3 | 0.009 |
| Subcutaneous adipose tissue (cm2) | 186.7 ± 102.2 | 308.8 ± 176.6 | 205.9 ± 131.3 | 0.003 |
| Visceral adipose tissue (cm2) | 196.7 ± 92.6 | 165.5 ± 70.1 | 173.6 ± 96.1 | NS |
| Co‐morbidities, N (%) | ||||
| Diabetes type II | 9(13) | 4(24) | 13(17) | NS |
| Hypertension | 20(29) | 8(47) | 28(37) | NS |
| Cardiovascular disease | 12(18) | 1(6) | 13(17) | NS |
| Dyslipidaemia | 9(15) | 4(24) | 13(17) | NS |
| Smoking habit, N (%) | 8(14) | 3(18) | 11(15) | NS |
BMI, body mass index; SD, standard deviation.
Values are mean ± SD, except for categorical variable, where numbers in each category are shown. Skeletal muscle index was measured by normalizing cross‐sectional muscle area for height, and muscle radiodensity was measured as the average Hounsfield units (HU) of the total skeletal muscle area on a single cross‐sectional computed tomography (CT) image at the level of the third lumbar vertebra (L3).
Small bowel, bile duct, liver, appendix, stomach, and gall bladder.
Missing data: BMI, n = 9.
Variation in muscle radiodensity within rectus abdominis
Analysis of RA at 10 slices and 10 regions is illustrated in Figure 1A and 1B. The variation in RA radiodensity within 10 distinct slices at 5 mm interval is illustrated in Figure 2A. The narrowest within‐subject range of RA radiodensity in 10 slices was 4 HU, and the highest was 18 HU (CV% ranged from 3 to 55% based on 10 serial images). The variation in RA radiodensity within 10 regions of interest in the same CT image slice of 13 patients is illustrated in Figure 2B. The least significant change was calculated for 10 slices and was found to be 8.65 HU. The narrowest within‐subject range of RA radiodensity in 10 regions of interest was 10 HU, and the highest was 70 HU (CV% ranged from 6 to 61% based on 10 subregions).
Figure 1.

Illustration of variability in radiodensity of rectus abdominis. (A) Variation of rectus abdominis radiodensity in 10 vertical computed tomography (CT) images (5 mm intervals). Zoomed image of rectus abdominis illustrates 10 slices of rectus abdominis and muscle radiodensity at each slice. (B) Within‐image variability of rectus abdominis radiodensity in10 regional measures. Each patient's CT image at the third lumbar was analysed. Red colour shows the muscle area. Regions of interest in rectus abdominis were manually selected and are shown in blue circles in the zoomed CT image (A1–A10). Table shows values of radiodensity at each region of interest.
Figure 2.

Variation in mean rectus abdominis radiodensity across the muscle. (A) Percentage coefficient of variation in mean rectus abdominis radiodensity of 10 distinct slices with an interval of 5 mm in 19 patients. Each point in the figure represents a patient. Male to female in this subset of patients was 15/4. Coefficient of variation widely varied in male and female patients with a range of 3 to 47% and 11 to 55%, respectively. (B) Percentage coefficient of variation in muscle radiodensity in 10 regions of interest within the same computed tomography image slice of rectus abdominis in 13 patients. Each point in the figure represents a patient. Male to female in this subset of patients was 11/2. Coefficient of variation widely varied in male and female patients with a range of 6 to 61% and 20 to 42%, respectively.
Triglyceride content of muscle was associated with rectus abdominis and total muscle radiodensity at the third lumbar vertebra
Radiodensity of RA at L3, total lumbar muscle radiodensity at L3, and TG content of RA biopsy were analysed for 75 patients. Radiodensity of RA at L3 ranged from −10.8 to 50.6 HU, total lumbar muscle radiodensity at L3 ranged from 7.1 to 54.4 HU, and TG content of RA ranged from 0.7 to 88.7 μg/mg.
Rectus abdominis radiodensity was moderately negatively associated with TG content of the muscle [r = −0.396, P < 0.001 (N = 75)] (Figure 3A). Similarly, there was a moderate negative association between TG content and total lumbar muscle radiodensity [r = −0.355 P = 0.002 (N = 75)] (Figure 3B). These results suggest that both mean muscle radiodensity at L3 and RA are associated with TG content of the muscle in cancer patients. An association between TG content and percentage area of ORO was observed (r = 0.62, P = 0.002). No significant association was found between percentage ORO area in the muscle section and muscle radiodensity (r = −0.24, P = 0.31).
Figure 3.

Association between muscle radiodensity and triglyceride (TG) content of rectus abdominis (RA). (A) Association between mean RA radiodensity at the third lumbar (L3) region and total TG content, r = −0.396, P < 0.001 (N = 75). Muscle radiodensity of RA was determined at L3 slice of computed tomography (CT) images obtained from medical records of the patients. (B) Association between total mean lumbar muscle radiodensity at L3 and total TG content measured in RA biopsy, r = −0.355, P = 0.002 (N = 75). Total muscle radiodensity was analysed at L3 slice of CT images. TG content was analysed by biochemical extraction followed by quantitative gas chromatography. Spearman's rho analysis was used to determine the associations. In male patients, correlation between TG content of RA and muscle radiodensity of RA or at L3 was weak but significant, r = −0.230, P < 0.048, and r = −0.285, P < 0.030, respectively. Similarly, in female patients, weak significant association was observed between TG content of RA and total muscle radiodensity at L3 (r = −0.201, P < 0.04), but strong significant association was observed between TG content and muscle radiodensity of RA (r = −0.581, P < 0.014).
Location of neutral lipid in rectus abdominis muscle
A variable pattern of neutral lipids was observed in the muscle sections by the use of ORO staining (Figure 4). Fibres with >50% of total area stained with neutral lipids were observed (Figure 4A). While this was generally uniformly distributed across each fibre, some regions showed focal deposition of lipid droplets near cell membrane (Figure 4B). Perivascular deposition of adipocytes was also exhibited in muscle sections (Figure 4C).
Figure 4.

Neutral lipid staining revealed different lipid distribution patterns in muscle fibres of cancer patients. (A) Variation in lipid deposition inside muscle fibre. (i) and (ii) are muscle sections of two patients stained with laminin and dystrophin (green) for cell membrane and Oil Red O (ORO) (bright red) for neutral lipids. Zoomed images show variation in per cent area of neutral lipids within fibres. Scale bars, 45 μm. (B) Lipid droplets in the area near the cell membrane. (i) and (ii) are muscle sections of two patients stained with laminin and dystrophin (green) for cell membrane and ORO (bright red) for neutral lipids. Zoomed images show deposition of lipid droplets in the area around the cell membrane. Scale bars, 45 μm. (C) Adipocytes in the perivascular area of the muscle. (i) and (ii) are muscle sections of two patients stained with laminin and dystrophin (green) for cell membrane and ORO (bright red) for neutral lipids. Scale bars, 140 μm.
Total area stained for neutral lipids in muscle section was on average 13% (4 to 30%). Out of the total lipid area, mean proportion of IMCL and EMCL areas were 46 and 54%, respectively. Even though almost equal proportions of IMCL and EMCL overall were observed, the ranges of percentage area were wide. IMCL area ranged from 22 to 76%; likewise, EMCL area range from 24 to 78% (Figure 5), and this was not associated with radiodensity measures and TG content of the muscle. Figure 6 illustrates variation in IMCL and EMCL in muscle sections of four cancer patients. Subjects 1 and 2 with similar percentage of neutral lipid area and TG content of RA showed variation in lipid distribution pattern. Subject 1 had higher IMCL (62%) and lower EMCL (38%), and Subject 2 had a similar percentage of IMCL and EMCL, 56 and 44%, respectively. Similarly, Subjects 3 and 4 with a similar percentage of total neutral lipid area and TG content of RA showed variation in lipid distribution pattern of IMCL and EMCL depots. These results show that distribution of IMCL and EMCL is heterogeneous even at the same level of TG and neutral lipid stain. Per cent area of IMCL and fibre types were not associated.
Figure 5.
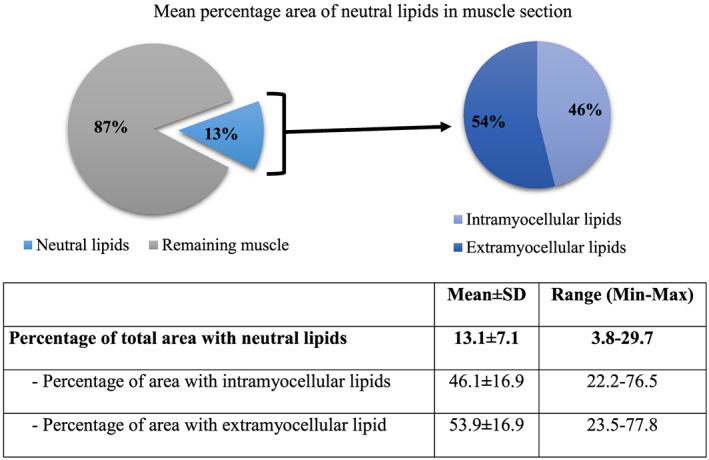
Mean percentage area of neutral lipids in muscle section analysed using Oil Red O staining in 22 patients. Total area stained for neutral lipids in muscle section was on average 13% (4 to 30%). Out of the total lipid area, the mean proportion of intramyocellular lipid and extramyocellular lipid areas were 46 and 54%, respectively. There were no significant differences in percentage neutral lipid area between male and female patients.
Figure 6.

Variation in intramyocellular lipid (IMCL) and extramyocellular lipid (EMCL) percentage areas. Subjects 1 and 2 have similar neutral lipid area but different IMCL : EMCL area. Similarly, Subject 3 and 4 have similar neutral lipid area but different IMCL: EMCL area. Scale bars, 90 μm. RA, rectus abdominis; TG, triglyceride.
Discussion
Computed tomography imaging is commonly used by our research group1, 37, 43, 44, 54, 55 and others2, 3, 4, 5 to investigate associations between muscle radiodensity and clinical outcomes in cancer patients. Low muscle radiodensity in people with cancer is assumed to reflect lipid infiltration. This is the first study to report variation in RA radiodensity within the same slice of CT image and also across the length of RA. We also found an association between RA/total lumbar radiodensity at L3 and TG content of biopsies in cancer patients. Furthermore, neutral lipid staining revealed heterogeneous distribution of IMCL and EMCL.
The purpose of this study was to assess the variability of radiodensity within RA. Analysis of radiodensity across the length and breadth of RA revealed wide variation within the same subject confirming non‐uniform distribution of lipids in the muscle.34, 56, 57 Generally, research studies in oncology settings followed the lead of Shen et al. to use a single CT image at L3 as muscle area at this level strongly correlates with whole‐body volume of muscle.45, 58 Muscle radiodensity is also measured at L3, but it does not represent spatial patterning and volume distribution of lipid in the whole muscle.
An increasing number of investigators are collecting RA biopsies to study biological features of muscles of cancer patients.41, 42, 43, 44 In practice, RA biopsies collected during surgery will vary depending on the site of incision. Thus, the biopsy is possibly from a different area of the abdomen than the area of muscle radiodensity evaluation. Also, the biopsy is small relative to the area being evaluated for radiodensity, and the pattern of lipid deposition is heterogeneous. Collectively, these sources of variation explain the moderate correlation between RA radiodensity at L3 or total lumbar muscle radiodensity at L3 and TG content of the biopsy in our study. This also explains why there was no significant correlation between neutral lipid content measured by ORO staining and muscle radiodensity, in contrast to Goodpaster et al.32 A recent study did not find an association between muscle radiodensity and muscle protein content in gastrointestinal cancer patients, also potentially explained by a relatively small muscle biopsy compared with the area analysed for muscle radiodensity.59 Changes in muscle protein and extracellular water content might also affect muscle radiodensity.32
Fat is distributed hetrogeneously in and around the muscle. This heterogeneous distribution contributes to sampling bias as can be seen at macroscopic level using CT images. Variation in radiodensity and uneven distribution of lipid depots in the muscle suggest that when investigating muscle at tissue level and fatty infiltration is a measure of interest, precise quantification of amount of lipid in the biopsy is helpful.
Nagao et al.60 first observed an association between muscle radiodensity and accumulation of fat in infants while investigating techniques for diagnosis of neuromuscular disorders. CT imaging and histochemical analysis has been previously used to exhibit changes in lipid content of leg and thigh muscles in people with obesity and Duchenne muscular dystrophy compared with controls.57, 61 In the present study, it has been demonstrated that RA radiodensity is indicative of its TG content measured biochemically. This is in line with Goodpaster's observation of a negative association between mid‐thigh muscle radiodensity and TG content of vastus lateralis biopsy in healthy volunteers and diabetic patients.32 However, that study reported stronger association (r = −0.580) as compared with our observation (r = −0.396). In the prior study, all subjects had muscle radiodensity greater than 25 HU with TG content in the range of 4 and 26 μg/mg. The healthy and diabetic individuals studied were between 25 and 49 years of age. In our study, more than half of the patients had RA radiodensity less than <25 HU with a wider TG content between 0.7 and 88 μg/mg. This could reflect older age of cancer patients (average age of 63 years). We also observed that total lumbar muscle radiodensity at L3, the most commonly analysed CT image cross section for radiodensity that associate to outcomes, is also indicative of total TG content of the muscle. The latter findings should be interpreted with some caution because total muscle radiodensity values at L3 are mixtures of radiodensity values of different muscle groups (i.e. quadratus lumborum, psoas, erector spinae, external obliques, transverse abdominis, internal obliques, and RA) and TG content was analysed for RA only as this is the most common biopsied muscle in cancer patients.41, 42, 43
In the current study, the location of lipids in and around the muscle fibres was characterized. Heterogeneous distribution of EMCL and IMCL was observed in the muscle sections. Wide variation in the distribution of lipids within and between muscle fibres suggests that pathways associated with both IMCL and EMCL need to be resolved to delve into the mechanism of fatty infiltration. IMCL is a dynamic pool of lipids in muscle fibre and an important substrate for exercise in endurance athletes.62 Excess IMCL deposition has been associated with insulin resistance, obesity, inflammation, and muscle dysfunction.63 Insulin resistance has been associated with predominant deposition of IMCL near cell membrane, large lipid droplet size,21, 62 and lipid droplet number.64 EMCL is an accumulation of adipocytes around the muscle fibres and can originate from stem cell populations residing in skeletal muscle.63 The most well‐defined stem cell population in skeletal muscle are satellite cells.65 However, whether satellite cells adopt adipogenic fate is under debate.66, 67 Fibrogenic/adipogenic progenitors, multipotent mesenchymal progenitors, and PW1+ interstitial cells are potential stem cells populations that can contribute to adipocyte development in skeletal muscle.40, 68
Computed tomography imaging is an important non‐invasive and opportunistic tool in studying lipid infiltration in the muscle in cancer patients. The present study supports the claim made by several studies that low muscle radiodensity is indicative of increased lipid content. However, wide variation in muscle radiodensity demonstrates a cautionary note for future studies using this measure. The reproducibility of muscle radiodensity measure needs to be determined before using it for any analysis. When investigating muscle characteristics at tissue level, biochemical TG extraction and histological ORO staining are more comprehensive and are representative of amount and location of lipid depots. More work is required to understand mechanisms that contribute to muscle lipid accumulation and its effects on muscle physiology.
Conflict of interest
None declared.
Funding
Funding for this project is from the Canadian Institutes of Health Research (CIHR) operating grants awarded to V.C.M and V.E.B. A.S.B. is the holder of the Alberta Innovates Technology Futures (AITF) award at the University of Alberta, Canada. A.A.‐B. is a recipient of the Doctoral Fellowship from the Consejo Nacional de Ciencia y Tecnología (CONACyT) of Mexico. Images for immunofluorescence experiments were taken at the facilities of the Cell Imaging Centre, Faculty of Medicine and Dentistry, University of Alberta, Canada.
Supporting information
Table S1: Antibody information used for immunofluorescence experiments: Oil red O
Table S2: Antibody information used for immunofluorescence experiments: muscle fiber types
Acknowledgements
A.S.B. contributed to data analyses, had full access to all the data in the study, and take responsibility for the integrity of the data and the accuracy of the data analysis. A.S.B. contributed to conceptualization, design, analysis, writing, and interpretation. A.D.‐H. contributed to CT image analysis and experimental optimization. A.A.‐B. and K.M. contributed to experimental optimization and image analysis. D.B., T.M., and O.F.B. contributed to patient recruitment, biopsy, and clinical data collection. M.T.C. and C.T.P. contributed to interpretation and editing. V.C.M. and V.E.B contributed to conceptualization, design, analysis, interpretation, and editing. All authors of this research paper have approved the final version submitted. The authors certify that they comply with the ethical guidelines for authorship and publishing of the Journal of Cachexia, Sarcopenia and Muscle.69
Bhullar A. S., Anoveros‐Barrera A., Dunichand‐Hoedl A., Martins K., Bigam D., Khadaroo R. G., McMullen T., Bathe O. F., Putman C. T., Clandinin M. T., Baracos V. E., and Mazurak V. C. (2020) Lipid is heterogeneously distributed in muscle and associates with low radiodensity in cancer patients, Journal of Cachexia, Sarcopenia and Muscle, 11, 735–747. 10.1002/jcsm.12533.
References
- 1. Martin L, Birdsell L, MacDonald N, Reiman T, Clandinin MT, McCargar LJ, et al. Cancer cachexia in the age of obesity: skeletal muscle depletion is a powerful prognostic factor, independent of body mass index. J Clin Oncol. 2013;31:1539–1547. [DOI] [PubMed] [Google Scholar]
- 2. Malietzis G, Johns N, Al‐Hassi HO, Knight SC, Kennedy RH, Fearon KC, et al. Low muscularity and myosteatosis is related to the host systemic inflammatory response in patients undergoing surgery for colorectal cancer. Ann Surg. 2016;263:320–325. [DOI] [PubMed] [Google Scholar]
- 3. van Vugt JL, Gaspersz MP, Vugts J, Buettner S, Levolger S, de Bruin RW, et al. Low skeletal muscle density is associated with early death in patients with perihilar cholangiocarcinoma regardless of subsequent treatment. Dig Surg 2019;36:144–152. [DOI] [PMC free article] [PubMed] [Google Scholar]
- 4. Hayashi N, Ando Y, Gyawali B, Shimokata T, Maeda O, Fukaya M, et al. Low skeletal muscle density is associated with poor survival in patients who receive chemotherapy for metastatic gastric cancer. Oncol Rep. 2016;35:1727–1731. [DOI] [PubMed] [Google Scholar]
- 5. Rollins KE, Tewari N, Ackner A, Awwad A, Madhusudan S, Macdonald IA, et al. The impact of sarcopenia and myosteatosis on outcomes of unresectable pancreatic cancer or distal cholangiocarcinoma. Clin Nutr. 2016;35:1103–1109. [DOI] [PubMed] [Google Scholar]
- 6. Rier HN, Jager A, Sleijfer S, van Rosmalen J, Kock MCJM, Levin M‐D. Low muscle attenuation is a prognostic factor for survival in metastatic breast cancer patients treated with first line palliative chemotherapy. Breast. 2017;31:9–15. [DOI] [PubMed] [Google Scholar]
- 7. Heymsfield SB, Wang Z, Baumgartner RN, Ross R. Human body composition: advances in models and methods. Annu Rev Nutr. 1997;17:527–558. [DOI] [PubMed] [Google Scholar]
- 8. Larson‐Meyer DE, Ravussin E, Newcomer BR, Smith SR, Kelley DE, Heilbronn LK. Muscle‐associated triglyceride measured by computed tomography and magnetic resonance spectroscopy* . Obesity. 2008;14:73–87. [DOI] [PMC free article] [PubMed] [Google Scholar]
- 9. Goodpaster BH, Thaete FL, Simoneau JA, Kelley DE. Subcutaneous abdominal fat and thigh muscle composition predict insulin sensitivity independently of visceral fat. Diabetes. 1997;46:1579–1585. [DOI] [PubMed] [Google Scholar]
- 10. Maltais A, Alméras N, Lemieux I, Tremblay A, Bergeron J, Poirier P, et al. Trunk muscle quality assessed by computed tomography: association with adiposity indices and glucose tolerance in men. Metabolism. 2018;85:205–212. [DOI] [PubMed] [Google Scholar]
- 11. Simoneau JA, Colberg SR, Thaete FL, Kelley DE. Skeletal muscle glycolytic and oxidative enzyme capacities are determinants of insulin sensitivity and muscle composition in obese women. FASEB J. 1995;9:273–278. [PubMed] [Google Scholar]
- 12. Nordal HJ, Dietrichson P, Eldevik P, Grønseth K. Fat infiltration, atrophy and hypertrophy of skeletal muscles demonstrated by X‐ray computed tomography in neurological patients. Acta Neurol Scand. 1988;77:115–122. [DOI] [PubMed] [Google Scholar]
- 13. Kelley DE, Goodpaster B, Wing RR, Simoneau J‐A. Skeletal muscle fatty acid metabolism in association with insulin resistance, obesity, and weight loss. Am J Physiol Metab. 1999;277:E1130–E1141. [DOI] [PubMed] [Google Scholar]
- 14. Marcus RL, Addison O, Kidde JP, Dibble LE, Lastayo PC. Skeletal muscle fat infiltration: impact of age, inactivity, and exercise. J Nutr Health Aging. 2010;14:362–366. [DOI] [PMC free article] [PubMed] [Google Scholar]
- 15. Reinders I, Murphy RA, Brouwer IA, Visser M, Launer L, Siggeirsdottir K, et al. Muscle quality and myosteatosis: novel associations with mortality risk: the Age, Gene/Environment Susceptibility (AGES)‐Reykjavik Study. Am J Epidemiol. 2015;183:53–60. [DOI] [PMC free article] [PubMed] [Google Scholar]
- 16. Idoate F, Cadore EL, Casas‐Herrero A, Zambom‐Ferraresi F, Marcellán T, de Gordoa AR, et al. Adipose tissue compartments, muscle mass, muscle fat infiltration, and coronary calcium in institutionalized frail nonagenarians. Eur Radiol. 2015;25:2163–2175. [DOI] [PubMed] [Google Scholar]
- 17. Goubert D, Meeus M, Willems T, De Pauw R, Coppieters I, Crombez G, et al. The association between back muscle characteristics and pressure pain sensitivity in low back pain patients. Scand J pain. 2018;18:281–293. [DOI] [PubMed] [Google Scholar]
- 18. Teichtahl AJ, Urquhart DM, Wang Y, Wluka AE, Wijethilake P, O'Sullivan R, et al. Fat infiltration of paraspinal muscles is associated with low back pain, disability, and structural abnormalities in community‐based adults. Spine J. 2015;15:1593–1601. [DOI] [PubMed] [Google Scholar]
- 19. Hilton TN, Tuttle LJ, Bohnert KL, Mueller MJ, Sinacore DR. Excessive adipose tissue infiltration in skeletal muscle in individuals with obesity, diabetes mellitus, and peripheral neuropathy: association with performance and function. Phys Ther. 2008;88:1336–1344. [DOI] [PMC free article] [PubMed] [Google Scholar]
- 20. Kelley DE, Goodpaster BH, Storlien L. Muscle triglyceride and insulin resistance. Annu Rev Nutr. 2002;22:325–346. [DOI] [PubMed] [Google Scholar]
- 21. Goodpaster BH, Thaete FL, Kelley DE. Composition of skeletal muscle evaluated with computed tomography. Ann New York Acad Sci Vol 904, Vivo Body Compos Stud pages 18–24, May 2000 2000;18–24. [DOI] [PubMed] [Google Scholar]
- 22. Goodpaster BH, Wolf D. Skeletal muscle lipid accumulation in obesity, insulin resistance, and type 2 diabetes. Pediatr Diabetes. 2004;5:219–226. [DOI] [PubMed] [Google Scholar]
- 23. Khan IM, Dai Perrard X‐Y, Brunner G, Lui H, Sparks LM, Smith SR, et al. Intermuscular and perimuscular fat expansion in obesity correlates with skeletal muscle T cell and macrophage infiltration and insulin resistance. Int J Obes (Lond). 2015;39:1607–1618. [DOI] [PMC free article] [PubMed] [Google Scholar]
- 24. Robles PG, Sussman MS, Naraghi A, Brooks D, Goldstein RS, White LM, et al. Intramuscular fat infiltration contributes to impaired muscle function in COPD. Med Sci Sports Exerc. 2015;47:1334–1341. [DOI] [PubMed] [Google Scholar]
- 25. Stephens NA, Skipworth RJEJERJE, MacDonald AJAJ, Greig CACA, Ross JAJA, Fearon KCHKCH. Intramyocellular lipid droplets increase with progression of cachexia in cancer patients. J Cachexia Sarcopenia Muscle. 2011;2:111–117. [DOI] [PMC free article] [PubMed] [Google Scholar]
- 26. Jacob S, Machann J, Rett K, Brechtel K, Volk A, Renn W, et al. Association of increased intramyocellular lipid content with insulin resistance in lean nondiabetic offspring of type 2 diabetic subjects. Diabetes. 1999;48:1113–1119. [DOI] [PubMed] [Google Scholar]
- 27. Perseghin G, Scifo P, De Cobelli F, Pagliato E, Battezzati A, Arcelloni C, et al. Intramyocellular triglyceride content is a determinant of in vivo insulin resistance in humans: a 1H–13C nuclear magnetic resonance spectroscopy assessment in offspring of type 2 diabetic parents. Diabetes. 1999;48:1600–1606. [DOI] [PubMed] [Google Scholar]
- 28. Sinha R, Dufour S, Petersen KF, LeBon V, Enoksson S, Ma YZ, et al. Assessment of skeletal muscle triglyceride content by 1H nuclear magnetic resonance spectroscopy in lean and obese adolescents: relationships to insulin sensitivity, total body fat, and central adiposity. Diabetes. 2002;51:1022–1027. [DOI] [PubMed] [Google Scholar]
- 29. Goodpaster BH, He J, Watkins S, Kelley DE. Skeletal muscle lipid content and insulin resistance: evidence for a paradox in endurance‐trained athletes. J Clin Endocrinol Metab. 2001;86:5755–5761. [DOI] [PubMed] [Google Scholar]
- 30. Pan DA, Lillioja S, Kriketos AD, Milner MR, Baur LA, Bogardus C, et al. Skeletal muscle triglyceride levels are inversely related to insulin action. Diabetes. 1997;46:983–988. [DOI] [PubMed] [Google Scholar]
- 31. Goodpaster BH, Katsiaras A, Kelley DE. Enhanced fat oxidation through physical activity is associated with improvements in insulin sensitivity in obesity. Diabetes. 2003;52:2191–2197. [DOI] [PubMed] [Google Scholar]
- 32. Goodpaster BH, Kelley DE, Thaete FL, He J, Ross R. Skeletal muscle attenuation determined by computed tomography is associated with skeletal muscle lipid content. J Appl Physiol. 2000;89:104–110. [DOI] [PubMed] [Google Scholar]
- 33. Wendling PS, Peters SJ, Heigenhauser GJ, Spriet LL. Variability of triacylglycerol content in human skeletal muscle biopsy samples. J Appl Physiol. 1996;81:1150–1155. [DOI] [PubMed] [Google Scholar]
- 34. Vermathen P, Kreis R, Boesch C. Distribution of intramyocellular lipids in human calf muscles as determined by MR spectroscopic imaging. Magn Reson Med. 2004;51:253–262. [DOI] [PubMed] [Google Scholar]
- 35. Hwang J‐H, Pan JW, Heydari S, Hetherington HP, Stein DT. Regional differences in intramyocellular lipids in humans observed by in vivo 1H‐MR spectroscopic imaging. J Appl Physiol. 2001;90:1267–1274. [DOI] [PubMed] [Google Scholar]
- 36. Yudkin JS, Eringa E, Stehouwer CDA. “Vasocrine” signalling from perivascular fat: a mechanism linking insulin resistance to vascular disease. Lancet. 2005;365:1817–1820. [DOI] [PubMed] [Google Scholar]
- 37. Aubrey J, Esfandiari N, Baracos VE, Buteau FA, Frenette J, Putman CT, et al. Measurement of skeletal muscle radiation attenuation and basis of its biological variation. Acta Physiol (Oxf). 2014;210:489–497. [DOI] [PMC free article] [PubMed] [Google Scholar]
- 38. Coen PM, Goodpaster BH. Role of intramyocelluar lipids in human health. Trends Endocrinol Metab. 2012;23:391–398. [DOI] [PMC free article] [PubMed] [Google Scholar]
- 39. Rivas DA, McDonald DJ, Rice NP, Haran PH, Dolnikowski GG, Fielding RA. Diminished anabolic signaling response to insulin induced by intramuscular lipid accumulation is associated with inflammation in aging but not obesity. Am J Physiol Regul Integr Comp Physiol. 2016;310:R561–R569. [DOI] [PMC free article] [PubMed] [Google Scholar]
- 40. Uezumi A, Fukada S, Yamamoto N, Ikemoto‐Uezumi M, Nakatani M, Morita M, et al. Identification and characterization of PDGFRα + mesenchymal progenitors in human skeletal muscle. Cell Death Dis 2014;5:e1186. [DOI] [PMC free article] [PubMed] [Google Scholar]
- 41. Narasimhan A, Greiner R, Bathe OFF, Baracos V, Damaraju S. Differentially expressed alternatively spliced genes in skeletal muscle from cancer patients with cachexia. J Cachexia Sarcopenia Muscle. 2018;9:60–70. [DOI] [PMC free article] [PubMed] [Google Scholar]
- 42. Johns N, Hatakeyama S, Stephens NA, Degen M, Degen S, Frieauff W, et al. Clinical classification of cancer cachexia: phenotypic correlates in human skeletal muscle. PLoS One. 2014;9:1–14. [DOI] [PMC free article] [PubMed] [Google Scholar]
- 43. Stretch C, Khan S, Asgarian N, Eisner R, Vaisipour S, Damaraju S, et al. Effects of sample size on differential gene expression, rank order and prediction accuracy of a gene signature. PLoS One 2013;8:e65380. [DOI] [PMC free article] [PubMed] [Google Scholar]
- 44. Stretch C, Aubin J‐M, Mickiewicz B, Leugner D, Al‐manasra T, Tobola E, et al. Sarcopenia and myosteatosis are accompanied by distinct biological profiles in patients with pancreatic and periampullary adenocarcinomas. Ahmad A, ed. PLoS One 2018;13:e0196235. [DOI] [PMC free article] [PubMed] [Google Scholar]
- 45. Mourtzakis M, Prado CMM, Lieffers JR, Reiman T, McCargar LJ, Baracos VE. A practical and precise approach to quantification of body composition in cancer patients using computed tomography images acquired during routine care. Appl Physiol Nutr Metab. 2008;33:997–1006. [DOI] [PubMed] [Google Scholar]
- 46. Prado CMM, Lieffers JR, McCargar LJ, Reiman T, Sawyer MB, Martin L, et al. Prevalence and clinical implications of sarcopenic obesity in patients with solid tumours of the respiratory and gastrointestinal tracts: a population‐based study. Lancet Oncol. 2008;9:629–635. [DOI] [PubMed] [Google Scholar]
- 47. Murphy RA, Mourtzakis M, Chu QS, Reiman T, Mazurak VC. Skeletal muscle depletion is associated with reduced plasma (n‐3) fatty acids in non‐small cell lung cancer patients 1–3. J Nutr. 2010;140:1602–1606. [DOI] [PubMed] [Google Scholar]
- 48. Pratt VC, Tredget EE, Clandinin MT, Field CJ. Fatty acid content of plasma lipids and erythrocyte phospholipids are altered following burn injury. Lipids. 2001;36:675–682. [DOI] [PubMed] [Google Scholar]
- 49. Koopman R, Schaart G, Hesselink MK. Optimisation of Oil Red O staining permits combination with immunofluorescence and automated quantification of lipids. Histochem Cell Biol. 2001;116:63–68. [DOI] [PubMed] [Google Scholar]
- 50. Biltz NK, Meyer GA. A novel method for the quantification of fatty infiltration in skeletal muscle. Skelet Muscle. 2017;7:1–13. [DOI] [PMC free article] [PubMed] [Google Scholar]
- 51. Mehlem A, Hagberg CE, Muhl L, Eriksson U, Falkevall A. Imaging of neutral lipids by Oil Red O for analyzing the metabolic status in health and disease. 2013;8:1149–1154. [DOI] [PubMed] [Google Scholar]
- 52. Gallo M, Gordon T, Syrotuik D, Shu Y, Tyreman N, MacLean I, et al. Effects of long‐term creatine feeding and running on isometric functional measures and myosin heavy chain content of rat skeletal muscles. Pflügers Arch—Eur J Physiol 2006;452:744–755. [DOI] [PubMed] [Google Scholar]
- 53. Nelson L, Gulenchyn KY, Atthey M, Webber CE. Is a fixed value for the least significant change appropriate? J Clin Densitom. 2010;13:18–23. [DOI] [PubMed] [Google Scholar]
- 54. Esfandiari N, Ghosh S, Prado CMM, Martin L, Mazurak V, Baracos VE. Age, obesity, sarcopenia, and proximity to death explain reduced mean muscle attenuation in patients with advanced cancer. J frailty aging. 2014;3:3–8. [DOI] [PubMed] [Google Scholar]
- 55. Xiao J, Caan BJ, Weltzien E, Cespedes Feliciano EM, Kroenke CH, Meyerhardt JA, et al. Associations of pre‐existing co‐morbidities with skeletal muscle mass and radiodensity in patients with non‐metastatic colorectal cancer. J Cachexia Sarcopenia Muscle 2018;9:654–663. [DOI] [PMC free article] [PubMed] [Google Scholar]
- 56. Vidt ME, Santago AC 2nd, Tuohy CJ, Poehling GG, Freehill MT, Kraft RA, et al. Assessments of fatty infiltration and muscle atrophy from a single magnetic resonance image slice are not predictive of 3‐dimensional measurements. Arthroscopy. 2016;32:128–139. [DOI] [PMC free article] [PubMed] [Google Scholar]
- 57. Goodpaster BH, Theriault R, Watkins SC, Kelley DE. Intramuscular lipid content is increased in obesity and decreased by weight loss. Metabolism. 2000;49:467–472. [DOI] [PubMed] [Google Scholar]
- 58. Shen W, Punyanitya M, Wang Z, Gallagher D, St.‐Onge MP, Albu J, et al. Total body skeletal muscle and adipose tissue volumes: estimation from a single abdominal cross‐sectional image. J Appl Physiol. 2004;97:2333–2338. [DOI] [PubMed] [Google Scholar]
- 59. Ramage MII, Johns N, Deans CD, Ross JA, Preston T, Skipworth RJ, et al. The relationship between muscle protein content and CT‐derived muscle radio‐density in patients with upper GI cancer. Clin Nutr. 2018;37:752–754. [DOI] [PubMed] [Google Scholar]
- 60. Nagao H, Morimoto T, Takahashi M, Habara S, Nagai H, Matsuda H. Computed tomography (CT) of the skeletal muscle in neuromuscular disorders: a comparison of CT with histological findings. No to hattatsu = Brain Dev 1987;19:216–221. [PubMed] [Google Scholar]
- 61. Jones DA, Round JM, Edwards RHT, Grindwood SR, Tofts PS. Size and composition of the calf and quadriceps muscles in Duchenne muscular dystrophy: a tomographic and histochemical study. J Neurol Sci. 1983;60:307–322. [DOI] [PubMed] [Google Scholar]
- 62. Daemen S, Gemmink A, Brouwers B, Meex RC, Huntjens PR, Schaart G, et al. Distinct lipid droplet characteristics and distribution unmask the apparent contradiction of the athlete's paradox. Mol Metab. 2018;17:71–81. [DOI] [PMC free article] [PubMed] [Google Scholar]
- 63. Hamrick MW, McGee‐Lawrence ME, Frechette DM. Fatty infiltration of skeletal muscle: mechanisms and comparisons with bone marrow adiposity. Front Endocrinol (Lausanne). 2016;7:1–7. [DOI] [PMC free article] [PubMed] [Google Scholar]
- 64. Tarnopolsky MA, Rennie CD, Robertshaw HA, Fedak‐Tarnopolsky SN, Devries MC, Hamadeh MJ. Influence of endurance exercise training and sex on intramyocellular lipid and mitochondrial ultrastructure, substrate use, and mitochondrial enzyme activity. AJP Regul Integr Comp Physiol. 2006;292:R1271–R1278. [DOI] [PubMed] [Google Scholar]
- 65. Dumont NA, Bentzinger CF, Sincennes M‐C, Rudnicki MA. Satellite cells and skeletal muscle regeneration. Compr Physiol 2015;(JULY);1027–1059. [DOI] [PubMed] [Google Scholar]
- 66. Scarda A, Franzin C, Milan G, Sanna M, Dal Prà C, Pagano C, et al. Increased adipogenic conversion of muscle satellite cells in obese Zucker rats. Int J Obes (Lond). 2010;34:1319–1327. [DOI] [PubMed] [Google Scholar]
- 67. Starkey JD, Yamamoto M, Yamamoto S, Goldhamer DJ. Skeletal muscle satellite cells are committed to myogenesis and do not spontaneously adopt nonmyogenic fates. J Histochem Cytochem. 2011;59:33–46. [DOI] [PMC free article] [PubMed] [Google Scholar]
- 68. Pannerec A, Formicola L, Besson V, Marazzi G, Sassoon DA. Defining skeletal muscle resident progenitors and their cell fate potentials. Development. 2013;140:2879–2891. [DOI] [PubMed] [Google Scholar]
- 69. von Haehling S, Morley JE, Coats AJS, Anker SD. Ethical guidelines for publishing in the Journal of Cachexia, Sarcopenia and Muscle: update 2019. J Cachexia Sarcopenia Muscle. 2019;10:1143‐1145. [DOI] [PMC free article] [PubMed] [Google Scholar]
Associated Data
This section collects any data citations, data availability statements, or supplementary materials included in this article.
Supplementary Materials
Table S1: Antibody information used for immunofluorescence experiments: Oil red O
Table S2: Antibody information used for immunofluorescence experiments: muscle fiber types