

Abstract
Background
Cancer cachexia is a life‐threatening metabolic syndrome that causes significant loss of skeletal muscle mass and significantly increases mortality in cancer patients. Currently, there is an urgent need for better understanding of the molecular pathophysiology of this disease so that effective therapies can be developed. The majority of pre‐clinical studies evaluating skeletal muscle's response to cancer have focused on one or two pre‐clinical models, and almost all have focused specifically on limb muscles. In the current study, we reveal key differences in the histology and transcriptomic signatures of a limb muscle and a respiratory muscle in orthotopic pancreatic cancer patient‐derived xenograft (PDX) mice.
Methods
To create four cohorts of PDX mice evaluated in this study, tumours resected from four pancreatic ductal adenocarcinoma patients were portioned and attached to the pancreas of immunodeficient NSG mice.
Results
Body weight, muscle mass, and fat mass were significantly decreased in each PDX line. Histological assessment of cryosections taken from the tibialis anterior (TA) and diaphragm (DIA) revealed differential effects of tumour burden on their morphology. Subsequent genome‐wide microarray analysis on TA and DIA also revealed key differences between their transcriptomes in response to cancer. Genes up‐regulated in the DIA were enriched for extracellular matrix protein‐encoding genes and genes related to the inflammatory response, while down‐regulated genes were enriched for mitochondria related protein‐encoding genes. Conversely, the TA showed up‐regulation of canonical atrophy‐associated pathways such as ubiquitin‐mediated protein degradation and apoptosis, and down‐regulation of genes encoding extracellular matrix proteins.
Conclusions
These data suggest that distinct biological processes may account for wasting in different skeletal muscles in response to the same tumour burden. Further investigation into these differences will be critical for the future development of effective clinical strategies to counter cancer cachexia.
Keywords: PDAC, Cancer, Cachexia, PDX, Transcriptome, Diaphragm
Introduction
Cancer cachexia is a life‐threatening metabolic syndrome characterized by aberrant weight loss because of muscle atrophy, with or without an accompanying loss of adipose tissue.1 Cachexia is most prevalent in patients with lung, gastrointestinal, and pancreatic cancers2, 3, 4; however, it eventually develops in up to 75% of all cancer patients with advanced disease. When present, cachexia leads to severely decreased physical function and quality of life.5 Furthermore, development of cachexia in cancer patients is highly associated with increased mortality, and it is well established that muscle loss itself is a powerful predictor of mortality in cancer patients.6, 7, 8, 9, 10, 11 Moreover, cachectic cancer patients experience more frequent and severe toxicities in response to anti‐cancer treatments, often causing treatments to be reduced, which further impacts survival.12 Currently there are no approved anti‐cachexia therapies for the treatment of this devastating condition.13, 14 This may be due, at least in part, to a disjoint between the small number of pre‐clinical models that have been used to identify causal mechanisms and the complexity of the syndrome in the human condition. In this regard, there appears to be a growing recognition in the field that additional pre‐clinical models of cancer cachexia are needed.15, 16, 17, 18
To date, the vast majority of pre‐clinical studies of cancer cachexia have used the murine Lewis lung carcinoma and colon adenocarcinoma 26 (C26) models. While these models have given insight into the mechanisms of cancer cachexia, their translatability to humans may be limited; thus, additional models must be considered that could be more translatable to the human condition. We presently chose to model pancreatic cancer or more specifically pancreatic ductal adenocarcinoma (PDAC). Of all common malignancies, PDAC has the highest incidence rate of cachexia, affecting up to 80% of patients.19 Furthermore, pancreatic cancer has a devastating 5‐year survival rate that remains below 9%.20 Such profound morbidity may reasonably be associated with the high prevalence of cachexia in this population, making PDAC a good candidate cancer type for the study of cancer cachexia. To model PDAC cachexia, we utilized an orthotopic patient‐derived xenograft (PDX) model. This model has previously been established as a close model of human cancer.21, 22, 23, 24, 25 While it has not been extensively used in the field of cancer cachexia, its close phenotypic similarity to the human disease makes such lines of investigation natural.
With the PDX model, a tumour fragment, resected directly from a PDAC patient, is attached to the murine pancreas. Importantly, by implanting resected human tumour directly into mice, the cellular diversity of the tumour is preserved; Thus, any changes in gene expression or rearrangements that occur in vitro are avoided.26, 27 Furthermore, by orthotopically attaching tumour directly to the pancreas, the tumour microenvironment is retained. This native environment is crucial in determining the biological behaviour of both the tumour and subsequent systemic response that induces cachexia.28, 29 Tumour metastasis to the liver and lungs occurs in this model,30 which has been shown to be an important factor in the cachectic syndrome and is not a common feature in many pre‐clinical cancer cachexia models.31, 32, 33 Furthermore, by transplanting tumours from PDAC patients into mice, cachexia is investigated through the lens of soluble factors derived from a patient tumour, which likely varies between individual cancer patients.34 Therefore, utilizing multiple cohorts of PDX mice (PDX mice implanted with tumours from different PDAC patients) supports identification of mechanisms of cancer‐induced muscle wasting that may be common among the pancreatic cancer patient population.
Another impedance to elucidating the molecular mechanisms driving cancer cachexia is the overwhelming focus of pre‐clinical studies on one select skeletal muscle, typically a specific limb muscle, as representative of the entire family of tissues. However, recently published work by Terry et al.35 comparing the transcriptome of 11 different skeletal muscles from healthy mice revealed extensive transcriptional diversity with, on average, 13% of transcripts differentially expressed between any two skeletal muscles (range 1–36.5%). Such intrinsic differences may contribute to differential susceptibility of muscles to tumour burden, which could have significant implications in the development of effective clinical therapies. Therefore, in exploring potential mechanisms of muscle wasting in the PDAC‐PDX model, we chose to study two distinct muscles—the tibialis anterior (TA), a limb muscle; and the diaphragm (DIA), an essential respiratory muscle. We hypothesize that in doing so, we will identify genes and biological processes (BPs) that are distinct between the TA and DIA muscles in response to the same PDAC tumour. We further hypothesize that in studying these muscles in four cohorts of PDX mice implanted with tumour resected from four different PDAC patients, we will identify genes and BPs that are commonly changed within each muscle across the four cohorts of PDAC‐PDX mice.
The DIA was selected, in part, based on previously published data from our lab in the C26 model in which it showed a more pronounced pathology compared with limb muscles, including a greater decrease in specific force compared with that of soleus or extensor digitorum longus muscles.36, 37 Similarly, in other disorders that lead to muscle pathologies, such as muscular dystrophy, pre‐clinical models demonstrate a greater pathology in the DIA compared with limb muscles in terms of fibrosis, regenerative capacity, and myofibre atrophy.38, 39, 40 As cachectic cancer patients experience DIA wasting that can progress to respiratory failure,41 it is critical that we identify mechanisms of muscle wasting in respiratory muscles as well as limb muscles.
Materials and methods
Orthotopic pancreatic ductal adenocarcinoma‐patient‐derived xenograft mice
Four cachectic PDAC patients underwent primary tumour surgical resection with curative intent at the University of Florida Health Science Center. Tumour biopsies were obtained and used to create PDX mice. Patient and resected tumour characteristics are detailed in Supporting Information Table S1; cachexia was defined as body weight loss greater than 5% from the time of PDAC diagnosis to tumour resection surgery. A fragment of resected tumour was initially implanted subcutaneously on the lower back of female NSG (NOD.Cg‐Prkdcscid Il2rgtm1Wjl/SzJ) mice (Jackson Laboratory), creating first‐passage PDX mice. This first passage is used by us and others30, 42, 43 to expand the tumour tissue, and subcutaneous implantation is used because this location can sustain larger tumours with less morbidity. When tumours reached 1.5 cm in diameter, they were resected, portioned into two‐by‐two millimetre sections, and implanted into mice orthotopically, sutured to the pancreas. The surgical procedure was performed using previously described methods.30 Although not tested here, others have shown a high degree of genetic stability in PDXs when compared with the original pancreatic cancer specimen,43 and we have previously demonstrated that PDXs retain morphological characteristics of the original pancreatic cancer specimen.42 Four cohorts of mice were created with tumour resected from four individual PDAC patients. Age‐matched and sex‐matched control mice underwent a sham surgical procedure exactly the same as the PDX mice but without implantation of a tumour fragment. Mouse cohorts are denoted Cohort 1, Cohort 2, Cohort 3, and Cohort 4, corresponding to the patient from which their tumours were derived (Patient 1, Patient 2, Patient 3, and Patient 4) (Table S1). All PDX cohorts had tumours implanted between 10 and 20 weeks of age. Mice were maintained in a temperature‐controlled and humidity‐controlled facility with a 12‐h light/dark cycle, and water and standard diet were provided ad libitum. The described procedures were approved by the University of Florida Institutional Animal Care and Use Committee and adhered to the guidelines on the recommendations in the Guide for the Care and Use of Laboratory Animals of the National Institute of Health.
Tumour endpoint and tissue harvesting
PDX and corresponding controls were euthanized when mice exhibited signs of severe cachexia such as weight loss, hunched posture, ungroomed fur, and had a body condition score ≤ 2. The total time from tumour implantation to this severe cachexia is shown in Table S1 for each of the PDX cohorts and ranged from 65–181 days. Mice were anaesthetized with isoflurane, and the TA, gastrocnemius (GAS) complex (gastrocnemius, plantaris, and soleus), DIA, abdominal (ABD) muscle, and primary tumour were surgically dissected. ABD muscle was collected as a one‐by‐one centimetre square cut from the ABD wall within the right lumbar and umbilical region thus including part of the internal and external obliques and transverse and rectus abdominis (RA). TA, DIA, and ABD muscles were snap frozen in liquid nitrogen for biochemical analyses or embedded in optimal cutting temperature freezing medium and frozen in liquid nitrogen‐cooled isopentane (2‐methlybutane) for histological analyses.
RNA isolation, microarray, and transcriptome analyses
RNA was isolated from mouse TA, DIA, and ABD by homogenization in Trizol buffer (Invitrogen) followed by extraction with chloroform and precipitation with isopropanol. RNA was dissolved in nuclease‐free water. The quantity and purity of RNA was tested using High Sensitivity RNA ScreenTape Analysis with the Agilent TapeStation (Santa Clara, CA, USA).
RNA samples isolated from the TA, DIA, and ABD of Cohort 1 PDX mice and corresponding sham controls (n = 3 per group) were sent to Boston University Microarray and Sequencing Resource Core facility for amplification, labelling, and hybridization on the mouse Affymetrix Gene 2.0 ST array (Santa Clara, CA, USA). This microarray measures the expression of 30 654 well annotated coding transcripts, 5638 well annotated non‐coding transcripts, and 11 086 long intergenic non‐coding transcripts. These data were pre‐processed by the Boston University Microarray Core, then we performed differential gene expression analysis using the Broad Institute's GenePattern Comparative Marker Selection module in order to identify genes that were expressed at significantly different levels between sham and PDX muscle.44 Mean differences were compared between the two groups using two‐tailed parametric t‐tests. This module was performed for each muscle type individually. For instance, PDX TA gene expression data were compared with that of sham control TA. ABD and DIA were similarly compared. Following this analysis, we identified differentially expressed genes in the PDX muscle as those having an absolute fold change ≥ 1.5 and FDRq ≤ 0.1. Up‐regulated and down‐regulated genes were analysed for each muscle using the DAVID Bioinformatics database45 to identify enriched functional categories to which these genes annotate. Gene ontology (GO) analysis identified BP, molecular function (MF), and cell component (CC) categories enriched for each set of genes. Categories were then screened and excluded if less than four genes were annotated to it, findings were not significant, or fold enrichment was less than 1.5.45 For the host patient (Px 1) from which the tumour for PDX Cohort 1 was derived, genes that showed an absolute fold change ≥ 1.5 compared with non‐cancer controls (N = 16) were entered into DAVID to compare enrichment scores for identified GO categories.
Following this analysis, RNA samples isolated from the TA and DIA of PDX Cohorts 2–4 and corresponding sham controls (n = 3 sham and n = 5 PDX for each muscle) were sent for microarray analysis, treated identically as Cohort 1. Thus, including TA and DIA samples from Cohort 1, we conducted a total of 60 arrays across the two muscles and four cohorts (n = 12 sham and n = 18 PDX for each muscle). Because the PDX tumours were obtained from different patients and Cohort 1 was profiled two years earlier than the others, there was clear separation between groups of samples with regard to cohort. Therefore, a linear mixed‐effects modelling approach was used to account for the cohort effect in this experiment. Such a model treats tissue and treatment as fixed independent variables and cohort as a random independent variable. This type of model has good power to identify genes that change with respect to each fixed effect (tissue, treatment, or the interaction of the two) while accounting properly for the random (cohort) effect. Genes up‐regulated or down‐regulated in response to PDAC tumour, using absolute fold change ≥ 1.5 and q ≤ 0.01 cut‐offs, were analysed using the DAVID Bioinformatics Database to identify enriched functional categories to which these genes annotate to as described previously. Additionally, for each set of genes, we performed gene set enrichment analysis (GSEA).46, 47 To do this, for both the TA and DIA, we compiled the average gene expression for each cohort's sham and PDX group (n = 4 sham and n = 4 PDX) then analysed this with the publicly available GSEA 3.0 software, comparing our expression data with the C5: GO gene set (this includes BP, MF, and CC GO gene sets). We then narrowed down enriched categories to only those significant based on FDRq < 25% as recommended by GSEA. The data discussed in this publication have been deposited in National Center for Biotechnology Information's Gene Expression Omnibus48 and are accessible through Gene Expression Omnibus Series accession number GSE137985 (https://www.ncbi.nlm.nih.gov/geo/query/acc.cgi?acc=GSE137985).
Histology
Using a microtome cryostat, 10 μm thick sections of the TA and DIA of each mouse were cut and transferred to positively charged glass slides. After ~1 h of air‐drying, they were stained with hemotoxylin and eosin (H&E) or with Masson's Trichrome, Aniline Blue Stain Kit (Newcomer Supply). All stained sections were imaged in our laboratory using a Leica DM5000B microscope (Leica Microsystems Bannockburn, IL). Cross‐sectional area (CSA) in the TA and DIA was measured from H&E‐stained sections using the publicly available ImageJ software by hand tracing fibre membranes and calculating the area within. For determination of average muscle fibre CSA and fibre size frequency distribution, n = 3–4 sham and 3–4 PDX mice were assessed from each cohort, and all sham measurements were compiled into one group. CSA of 150–300 fibres were measured per muscle. Collagen content was measured from Masson's Trichrome‐stained sections also using ImageJ software. Epimysial collagen was excluded from each image by tracing a border around the muscle cross section just below the epimysium for analysis. A threshold was set to create a black and white photo in which the dark areas corresponded to the blue‐stained collagen; this was then quantified as a percent of the total muscle CSA. For measurement of collagen content, n = 3–4 sham and 3–4 PDX mice were assessed from each cohort.
Quantification of serum cytokines in PDX mice
A human‐specific cytokine panel and a mouse‐specific cytokine panel were measured in the serum of all four cohorts of PDX mice and sham‐surgery control mice with the objective of comparing tumour‐derived factors (human) compared with host‐derived factors (mouse). Soluble analytes in mouse and human serum were assayed using the Milliplex® Mouse Cytokine/Chemokine Magnetic Bead Panel and the Milliplex® Human Cytokine/Chemokine Magnetic Bead Panel (Merck Millipore, Darmstadt, Germany) according to the manufacturer's instructions. Briefly, serum was incubated in multiscreen filter plates (EMD Millipore, San Jose, CA) with beads coated with primary antibodies overnight at 4°C. After washing, samples were incubated with detection antibodies for 1 h at 23 °C, followed by labelling with streptavidin‐phycoerythrin for 30 min at room temperature. Following washing, data were acquired on a Luminex 200® system running xPONENT® 3.1 software (Luminex, Austin, TX) and analysed using a five‐paramater logistic spline‐curve fitting method using Milliplex® Analyst V5.1 software (Vigene Tech, Carlisle, MA). Concentrations were determined using a standard curve and five parameter logistics to determine concentrations. Samples measured below the detectable range were given a value of 0. For mouse‐derived cytokines for which the sham serum cytokine concentration was greater than 0, an ordinary one‐way analysis of variance followed by a multiple comparisons analysis against the sham was used to determine significance.
Results
Skeletal muscle pathology in pancreatic ductal adenocarcinoma‐patient‐derived xenograft mouse model of cancer cachexia
Orthotopic PDAC‐PDX mice developed cachexia in response to tumour burden, as demonstrated by decreased tumour‐free body weight and decreased mass of the TA and GAS complex (gastrocnemius, plantaris, and soleus) (Figures 1A and 1B). Cryosections of the TA, ABD, and DIA were subsequently stained with H&E. Similar to findings in other models of cancer cachexia,49 the TA showed decreased muscle fibre size without any morphological signs of muscle damage. However, we found disrupted muscle architecture in the ABD and DIA, including increased extracellular space, irregularly shaped muscle fibres, increased number of mononuclear cells within the muscle, and necrotic fibres (Figure 1C; Figure S1 ). Importantly, these features are consistent with morphological pathologies identified in the RA of cachectic PDAC patients.50
Figure 1.
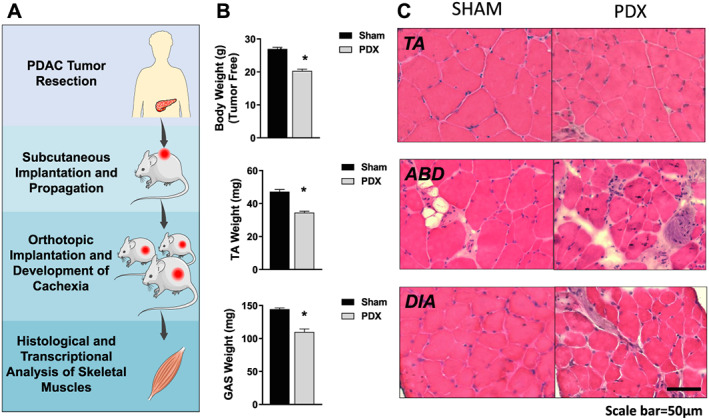
Skeletal muscle pathology in pancreatic ductal adenocarcinoma‐patient‐derived xenograft (PDAC‐PDX) mouse model of cancer cachexia. (A) Pancreatic cancer cachexia is modelled with PDAC‐PDX mice bearing tumour fragments derived from a cachectic pancreatic cancer patient. (B) PDX mice exhibit decreased tumour‐free body weight and decreased mass of the tibilais anterior (TA) and gastrocnemius complex (gastrocnemius, plantaris, and soleus). (C) Representative images of TA, abdominal (ABD) muscle, and diaphragm (DIA) stained with hemotoxylin & eosin show differential effects of tumour burden on these muscles' gross morphology. (sham n = 5 and PDX n = 10; * P < 0.05).
Transcriptomic analysis of the tibialis anterior, abdominal, and diaphragm of pancreatic ductal adenocarcinoma‐patient‐derived xenograft mice
To gain further insight into the BPs that are altered in the TA, DIA, and ABD muscles of PDX mice, we conducted microarray analysis on n = 3 of each muscle in PDX mice and sham controls. Differentially expressed genes were defined as having an absolute fold change ≥ 1.5 and FDRq ≤ 0.1. Of the genes up‐regulated in ABD (1302), DIA (286), and TA (573), only 30 genes overlapped between all three muscles. Of the genes down‐regulated in ABD (1642), DIA (227), and TA (659), only 39 genes overlapped (Figure 2A). This indicates that tumour burden has a strikingly distinct effect on the transcriptome of these different muscles. We next performed DAVID Bioinformatics GO analysis to identify BP, MF, and CC categories enriched for each set of genes that are significantly up‐regulated or down‐regulated in each muscle (Figure 2B). For the up‐regulated genes in the TA, GO analysis identified categories consistent with processes that have previously been identified in the literature as associated with cancer‐induced muscle wasting including apoptosis, protein catabolic process, oxidative stress, and lipid localization.51 For both the TA and ABD, many down‐regulated genes were related to the extracellular matrix (ECM), which is consistent with findings in the TA of cachectic C26 tumour‐bearing mice.52 Also, for both muscles, down‐regulated genes annotated to lipid storage and platelet‐derived growth factor binding. Other enriched categories for down‐regulated genes in ABD were related to oxidative phosphorylation including oxioreductase activity, NADH dehydrogenase activity, electron transport chain, and tricarboxylic acid cycle. For genes up‐regulated in the ABD muscle, enriched categories included proteasome complex and apoptosis similar to the TA. For genes up‐regulated in the DIA, the majority of GO categories related to the immune response including complement activation, cytokine‐mediated signalling, and response to wounding. Additionally, we found categories related to the ECM enriched from genes up‐regulated in the DIA, which is in direct contrast to the TA muscle for which these genes were repressed. For genes down‐regulated in the DIA, the majority of enriched categories related to mitochondria and respiration including mitochondrial lumen, mitochondrial matrix, oxidation reduction, and electron carrier activity, many of which are also identified as enriched for down‐regulated genes in the ABD. These findings identify several overlapping and unique BPs dysregulated in different skeletal muscles in response to the same tumour burden.
Figure 2.
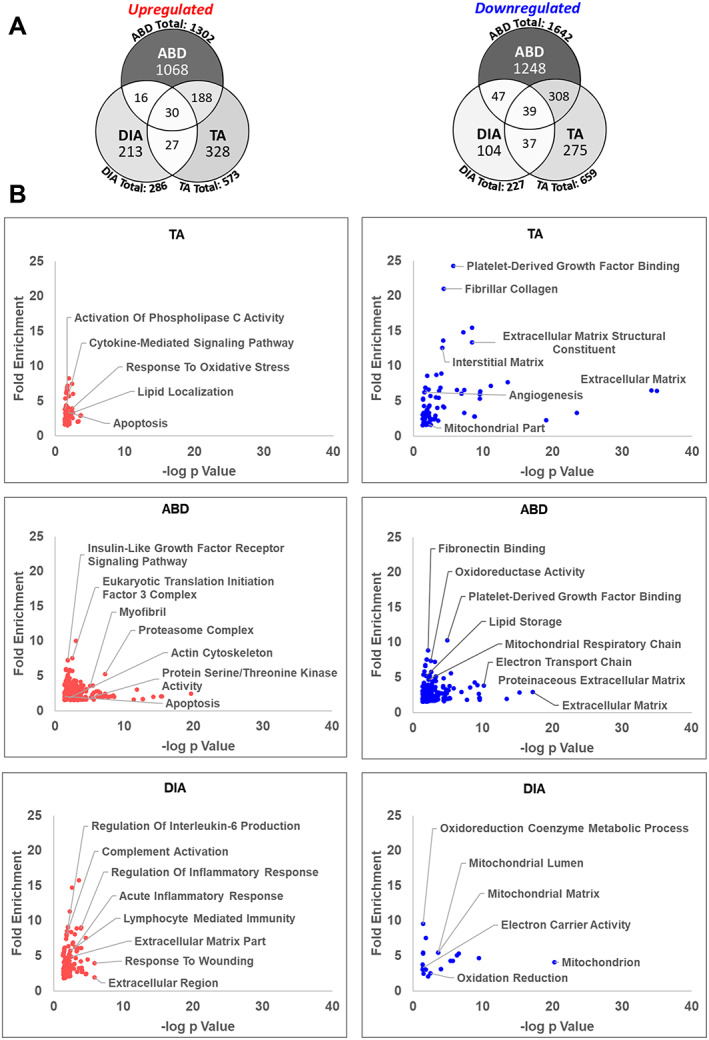
Transcriptomic analysis of the tibilais anterior (TA), abdominal (ABD), and diaphragm (DIA) of pancreatic ductal adenocarcinoma‐patient‐derived xenograft (PDX) mice. Microarray analysis was performed on TA, ABD, and DIA of PDX mice (and compared with TA, ABD, and DIA, respectively, of sham‐surgery controls). Genes up‐regulated or down‐regulated in the TA, ABD, and DIA of pancreatic ductal adenocarcinoma‐PDX mice were defined by an absolute fold change ≥ 1.5 and FDRq ≤ 0.1. (A) Venn diagrams show the number of differentially expressed genes for each muscle and the number of genes that overlap between them. Colour intensity in each segment corresponds to the percentage of genes in that segment compared with the total number of genes on the Venn diagram. (B) DAVID Gene Ontology analysis was performed to identify enriched biological process, molecular function, and cell component (CC) categories for each set of genes up‐regulated or down‐regulated in each muscle. Categories are graphed such that those with highest fold enrichment and lowest P value with be found in the upper right quadrant (n = 3 per muscle).
Transcriptomes of the tibialis anterior, abdominal, and diaphragm of patient‐derived xenograft mice compared with pancreatic ductal adenocarcinoma patient muscle
To determine the extent to which the BPs enriched in the TA, ABD, or DIA of PDAC‐PDX mice overlap with the BPs enriched in the skeletal muscle of cachectic PDAC patients, we compared our DAVID GO findings with those recently published by our lab in RA muscle biopsies from cachectic PDAC patients and weight‐stable, non‐cancer controls.50 Enriched GO categories that overlap between patients and PDX muscles, and the enrichment score for those categories, are shown in Table 1. We also compared the enrichment of these same GO categories with the RA muscle of the host patient from which the tumour was derived. Interestingly, top GO categories enriched in the DIA of PDX mice showed the greatest overlap with top categories enriched in muscle from PDAC patients, including the host patient, followed by the ABD muscle, with the TA showing minimal overlap. Indeed, as mentioned previously, many categories related to the immune response are enriched from genes increased in the DIA of PDX mice, and many of these same categories are enriched from genes increased in the RA of cachectic PDAC patients, including the host patient. Moreover, the morphology of the DIA and ABD of PDX mice showed characteristics consistent with that of PDAC muscle (Figure 1C).50 Critically, these findings imply that pancreatic tumour burden could elicit varying responses in different skeletal muscles in cancer patients, the future investigation of which could aid in the development of effective clinical therapies. Additionally, because the RA may not represent all skeletal muscles' response to tumour‐burden in PDAC patients, further investigation may find that the TA of PDX mice provides translational value for skeletal muscles other than RA in cachectic PDAC patients.
Table 1.
Gene ontology terms enriched within tibialis anterior, diaphragm (DIA), and abdominal muscle of cachectic pancreatic ductal adenocarcinoma‐patient‐derived xenograft mice that overlap with skeletal muscle of cachectic pancreatic ductal adenocarcinoma patients
| PDAC RA | Px 1 RA | PDX Cohort 1 | |||
|---|---|---|---|---|---|
| Up‐regulated gene ontology terms | DIA | ABD | TA | ||
| Lymphocyte activation/B cell activation | 11.3 | 3.5 | 6.7 | ||
| Leukocyte activation | 7.1 | 6.9 | 4.9 | ||
| Chemotaxis | 7.0 | 2.7 | 4 | ||
| Response to cytokine stimulus | 5.8 | 2.9 | 8.1 | 3.9 | |
| Adherens junction | 5.7 | 3.5 | 4.2 | 2.5 | |
| Response to insulin stimulus | 4.1 | 2.6 | 3.6 | ||
| Protein kinase activity | 4.0 | 3.0 | 2.7 | 1.6 | |
| Vaculature development | 3.4 | 2.6 | |||
| Actin filament‐based procesS | 3.0 | 5.0 | 3.3 | 1.9 | |
| Apoptosis | 2.9 | 4.2 | 5.9 | 3 | |
| Response to wounding | 2.7 | 2.2 | 4 | ||
| Vesicle | 2.1 | 5.1 | 3 | ||
| Extracellular region/extracellular matrix | 1.7 | 4.3 | 4.9 | ||
| Plasma membrane part | 1.7 | 3.9 | 2.2 | 1.8 | |
| Down‐regulated gene ontology terms | |||||
| Cofactor biosynthetic process | 11.4 | 7.3 | 7.6 | ||
| Mitochondrial part | 2.9 | 5.6 | 4.7 | 2.6 | 1.7 |
| Mitochondrial lumen | 1.8 | 2 | 5.4 | 2.6 | |
| Enrichment scores | |||||
ABD, abdominal; DIA, diaphragm; PDX, patient‐derived xenograft; PDAC, pancreatic ductal adenocarcinoma; RA, rectus abdominis; TA, tibialis anterior.
DAVID Gene Ontology (GO) analysis was performed on differentially expressed genes (absolute fold change ≥ 1.5 and FDRq ≤ 0.1) in DIA, ABD, and TA muscles from cachectic PDAC‐PDX mice and compared with the top GO terms enriched in rectus abdominis (RA) muscle biopsies from cachectic PDAC patients based on a previously published microarray analysis (Judge SM, JNCI Cancer Spectrum, 2018). GO terms are ranked based on enrichment scores identified from PDAC RA. Enrichment scores of overlapping GO terms from each PDAC‐PDX muscle, as well as from the RA muscle of the host patient from which the PDX tumours were derived (Px 1), are indicated.
Differential histopathology in diaphragm and tibialis anterior muscle of multiple cohorts of pancreatic ductal adenocarcinoma‐patient‐derived xenograft mice
When working with any cancer model, an accepted limitation is that the results may only be reflective of that model and not the broader patient population being modelled. The PDX model offers a unique opportunity in this regard because tumour fragments from different patients can be used, which may better reflect the patient population as a whole and therefore offer more clinical relevance. Thus, to expand our PDX findings beyond one cohort of mice implanted with tumour from one PDAC patient, we created an additional three cohorts of PDX mice using fragments of tumour resected from three different cachectic PDAC patients (Figure 3A; Table S1). The three additional cohorts of PDX mice each showed hallmark features of cancer cachexia including decreased tumour‐free body mass, muscle atrophy as represented by the TA and GAS muscles, and almost complete loss of gonadal fat stores (Figure 3B). The primary tumour weight was not significantly different between PDX cohorts, and there was no significant correlation between tumour size and tumour‐free body weight loss across the four cohorts of PDX mice or separately within each cohort (Figure S2). Although metastasis was observed in each cohort, metastatic burden was not quantified.
Figure 3.
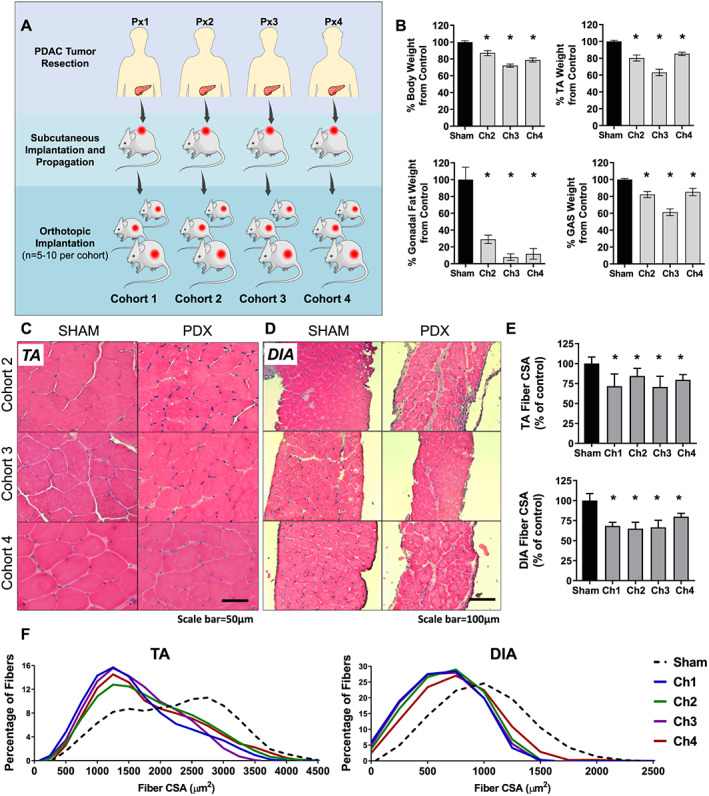
Histological features of tibialis anterior (TA) and diaphragm (DIA) in three additional cohorts of pancreatic ductal adenocarcinoma‐patient‐derived xenograft (PDAC‐PDX) mice. (A) Three cohorts of PDX mice were created in addition to the first cohort analysed in Figures 1 and 2; each cohort is derived from a different cachectic PDAC patient. (B) Each cohort of PDX mice exhibited decreased tumour‐free body weight, decreased mass of the TA and gastrocnemius (GAS) and decreased gonadal fat mass (n = 5; * P < 0.05). Representative images of TA (C) and DIA (D) from PDX Cohorts 2–4 and corresponding sham‐surgery controls cross sectioned and stained with hemotoxylin & eosin. (E) Average muscle fibre cross sectional area for the TA and DIA are displayed as percent change from corresponding sham controls (n = 3–4; * P < 0.05). (F) Fibre size frequency distribution for the TA and DIA are shown for each cohort.
From these three additional cohorts of PDAC‐PDX mice, we evaluated the histology and transcriptome of two muscles. We chose DIA because of our findings of its similarities with RA of cachectic PDAC patients, and the TA, because this muscle is widely studied in pre‐clinical models of cancer cachexia, thus our findings can be compared with these published data. Cross sections cut from the TA and DIA muscles of PDX Cohorts 2–4 were stained with H&E to assess gross muscle morphology and measure muscle fibre CSA. Similar to muscles from Cohort 1, these TA muscles showed no overt morphological disruption (Figure 3C) whereas the DIA showed mononuclear cell infiltration and increased extracellular space (Figure 3D). Despite these differences, both muscles exhibited similar reductions in muscle fibre CSA across all cohorts (Figures 3E and 3F). These data confirm our earlier findings that morphologies of TA and DIA are differentially affected in PDAC‐PDX mice and that this pathology is not unique to Cohort 1 PDX mice.
Transcriptomic analysis of diaphragm and tibialis anterior muscle of multiple cohorts of pancreatic ductal adenocarcinoma‐patient‐derived xenograft mice
To explore and expand on the differential effects of PDAC tumour‐burden on the mouse TA and DIA transcriptomes evident in the first cohort of mice, we performed microarray analysis on samples from TA and DIA from PDX Cohorts 2–4 (n = 3 sham and n = 5 PDX per muscle, per cohort). We first identified genes differentially expressed in each muscle of each cohort, using the same criteria we used for Cohort 1 (absolute fold change ≥ 1.5 and FDRq ≤ 0.1). Notably, these criteria resulted in substantial variability between the number of genes identified as significantly up‐regulated or down‐regulated for each muscle (Figure S3). However, there was consistency in the BPs and pathways enriched for the same muscle across PDX cohorts (Figure S4). Indeed, using GO and Kyoto Encyclopedia of Genes and Genomes (KEGG) pathway analyses of genes up‐regulated in the DIA, we identified cytokine mediated signalling, Janus kinase signal transducer and activator of transcription (Jak‐STAT) signalling, several immune‐related processes, as well as ECM up‐regulated in at least three out of four PDX cohorts. For genes down‐regulated in the DIA, mitochondria and mitochondrial membrane were enriched for all four PDX cohorts. FoxO signalling and Jak‐STAT signalling were enriched among genes up‐regulated in the TA for three out of four PDX cohorts, and ECM and angiogenesis were enriched from genes down‐regulated in the TA across all four PDX cohorts. Therefore, the four different patient‐derived tumours consistently elicit similar biological responses in the TA and in the DIA.
We next chose to identify genes differentially expressed in the DIA or TA with all four PDX cohorts analysed collectively. To do this, we used a linear mixed‐effects modelling approach. This accounts for variability in a given gene's expression that could occur because of the cohort from which the sample was derived rather than from the specific muscle from which the sample was derived. This approach increases the power to identify genes that change in response to the tumour in the TA or DIA while decreasing the chance of detecting false positives. Because of this increased power, we modified the criteria for significance to FDRq ≤ 0.01 while keeping absolute fold change ≥ 1.5. This identified 336 genes and 195 genes up‐regulated in the DIA and TA, respectively, and 196 genes and 265 genes down‐regulated in the DIA and TA, respectively. We subsequently performed DAVID GO and KEGG pathway analyses on these gene sets.
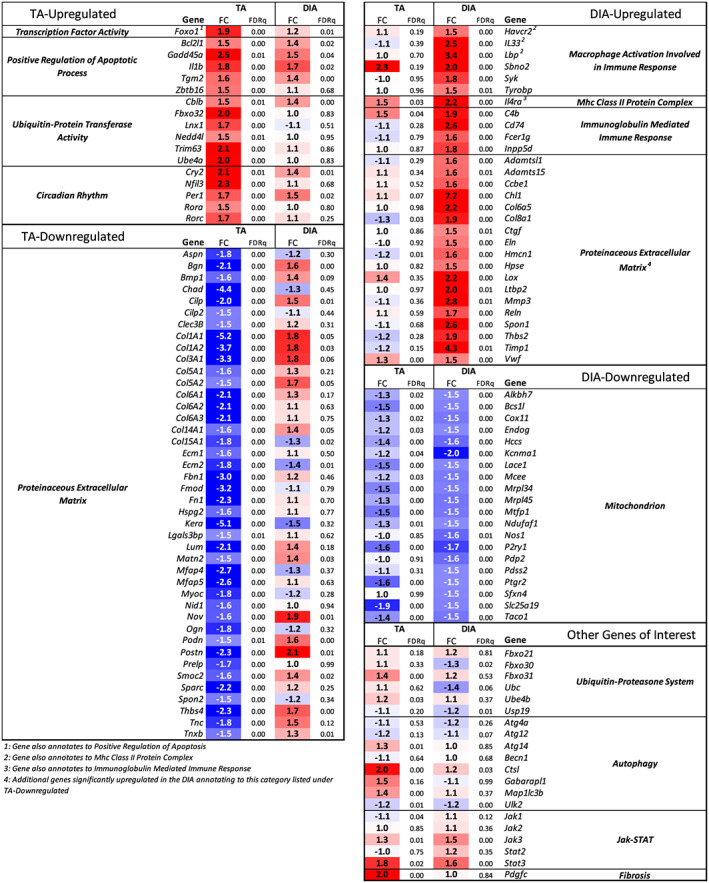
Enriched among genes up‐regulated in the TA were GO categories including transcription factor activity, positive regulation of apoptotic process, and ubiquitin‐protein transferase activity (Figure 4A; Table S2). Several genes previously linked to the muscle atrophy process annotated to these categories including FoxO1, Fbxo32 (Atrogin‐1), and Trim63 (MuRF1).51 Genes annotating to ubiquitin‐protein transfer included Cblb, Ebe4a, Lnx1, and Nedd4l, all of which encode E3 ubiquitin ligases, and additional genes annotating to apoptotic process included interleukin (IL)‐1β and Bcl2L1 (Figure 5). KEGG pathway analysis identified circadian rhythm, apoptosis, FoxO signalling, and Jak‐STAT signalling as some of the most enriched pathways from genes up‐regulated in the TA (Figure 4B).
Figure 4.
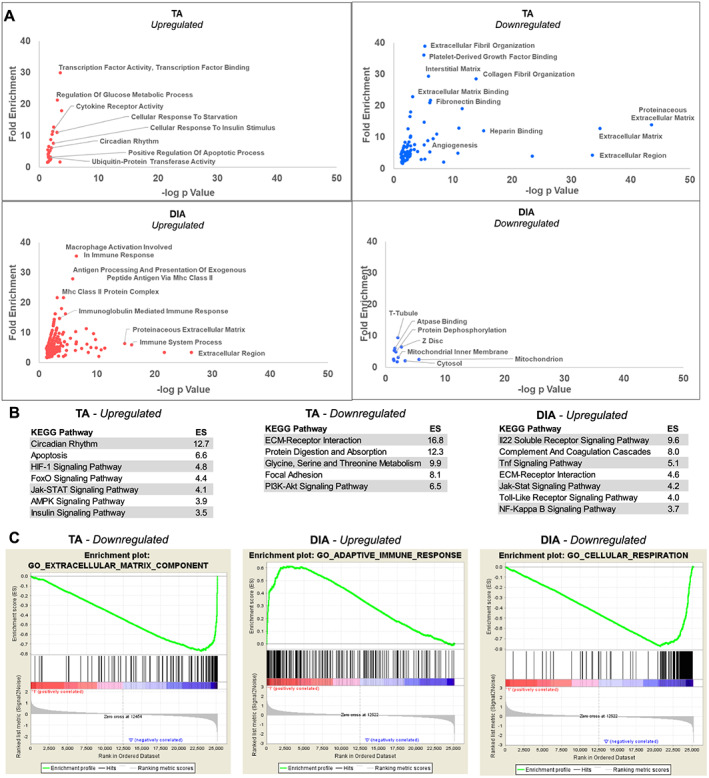
Collective analysis of the tibialis anterior (TA) and diaphragm (DIA) transcriptomes of four cohorts of pancreatic ductal adenocarcinoma‐patient‐derived xenograft mice. (A) Microarray analysis was performed on TA and DIA of Cohorts 1–4 patient‐derived xenograft mice (and compared with TA and DIA of respective sham‐surgery controls). The data were combined and analysed using a linear mixed‐effects modelling approach to determine genes differentially expressed in the TA and DIA in response to tumour burden. Significantly differentially expressed genes were defined by an absolute fold change ≥ 1.5 and FDRq ≤ 0.01, and these genes were analysed with DAVID Gene Ontology (GO) analysis. GO categories are graphed such that those with highest fold enrichment and lowest P value with be found towards the upper right quadrant. (B) Differentially expressed genes were analysed with DAVID Kyoto Encyclopedia of Genes and Genomes (KEGG) pathway analysis, and the top significantly enriched categories for each gene set are listed (note: no KEGG pathways were significantly enriched for genes down‐regulated in the DIA). (C) Enriched GO categories were also identified using gene set enrichment analysis, and one of the top enriched categories for genes down‐regulated in the TA and up‐regulated and down‐regulated in the DIA are shown (n = 3–4 per muscle per cohort).
Figure 5.
Expression of select genes in pancreatic ductal adenocarcinoma‐patient‐derived xenograft tibialis anterior (TA) and diaphragm (DIA) annotating to enriched Gene Ontology categories. Microarray analysis was performed on TA and DIA of Cohorts 1–4 patient‐derived xenograft mice (and compared with TA and DIA of respective sham‐surgery controls). The expression data from all four cohorts were combined and collectively analysed using a linear mixed‐effects modelling approach in order to calculate the fold change and FDRq value for differentially expressed genes in the TA and DIA in response to tumour burden. Shown here is the expression data for selected genes of interest annotating to enriched GO categories defined in Figure 4.
For the genes down‐regulated in the TA, the vast majority of enriched GO terms related to the ECM (Figure 4A; Table S3). Annotating to these categories included genes for collagens I, III, V, VI, XIV, and XV. Also down‐regulated were small leucine‐rich repeat proteoglycans including Fmod, Ecm2, Ktn, Prelp, and Podn, as well as glycoproteins such as Fn1 and Fbn1, among others (Figure 5). The most enriched KEGG pathways identified for genes down‐regulated in the TA included ECM‐receptor interaction and PI3K‐Akt signalling.
The most enriched GO terms for genes up‐regulated in the DIA were categories related to the immune system including macrophage activation, major histocompatibility complex class II protein complex, and immunoglobulin mediated immune response (Figure 4A; Table S4). Activation of inflammatory transcriptional programs in NSG mice may be counterintuitive given the immunocompromised nature of these mice. However, while NSG mice do lack natural killer cells, T cells, B cells, and a functional complement system, they produce functionally immature macrophages and dendritic cells as well as functioning neutrophils, which could be involved in DIA wasting in this model.53, 54, 55 KEGG Pathway analysis identified several pro‐inflammatory pathways for genes up‐regulated in the DIA, including IL‐22, TNF, toll‐like receptor, Jak‐STAT, and nuclear factor‐kappa B signalling (Figure 4B). Additional GO terms for genes up‐regulated in the DIA were related to the ECM, and many genes annotating to these categories encode enzymes that function in ECM turnover and fibrosis. Several ECM structural protein‐encoding genes were up‐regulated including Col1a1, Col1a2, Col3a1,Col6a5, Col8a1, Eln, Nov, Postn, Spon1, Thbs2, and Thbs4. We also identified genes that encode ECM‐degrading proteases up‐regulated in the DIA, including Adamts4, Adamts15, Mmp3, Hpse, Reln, and Lox, suggesting activation of ECM remodelling. Ctgf and Pdgfc were also increased in the DIA, both of which can alone induce fibrosis through up‐regulation of ECM proteins and pro‐inflammatory factors.56, 57, 58 This fibrosis‐related expression profile in the DIA is suggestive of expansion of fibro/adipogenic progenitors (FAPs), which are the predominant source of ECM‐protein expression following injury and inflammation in skeletal muscle.59, 60 Furthermore, expression of IL‐33, predominantly secreted by FAPs in skeletal muscle, is also increased in PDX DIA.60 An increase in the intramuscular FAP population along with infiltration of leukocytes would be consistent with that observed in PDAC patient RA.50
In order to assess the extent of fibrotic tissue deposition in the DIA, we stained cross sections of DIA with Masson's Trichrome to quantify collagen content. The DIA of all four PDX cohorts showed a significant increase in collagen content, with an average of 1.5‐fold to 2.8‐fold increase compared with DIA of controls (Figure S5). This is consistent with up‐regulation of pro‐inflammatory factors and ECM proteins that we found in the DIA. However, because inhibition of the immune system can prevent fibrosis in muscle disease,61 DIA fibrosis would likely be greater in hosts with a fully functional immune system. Given the repression of ECM‐related genes and lack of any transcriptional indication of an inflammatory response in the TA, we hypothesized that collagen content would be unchanged. However, the TA muscles also showed a small but significant 1.3‐fold to 1.8‐fold increase in collagen content compared with TAs of sham‐surgery controls.
For genes down‐regulated in the DIA, several enriched GO categories related to the mitochondrion (Figure 4A; Table S5). Of these genes, many play a role in aerobic respiration including Bcs1l, Cox11, Hccs, Ndufaf1, Pdp2, Pdss2 (DLP1), Slc25a19, and Taco1. Additional genes annotating to this category are involved in apoptosis, including Alkbh7 and Mtfp1, and two genes encoding mitochondrial ribosomal proteins, Mrpl34 and Mrpl45. This reduced expression of mitochondria‐related genes in the DIA of PDAC‐PDX mice aligns with published studies, which show mitochondrial deficits in cachectic tumour‐bearing hosts including altered mitochondrial biogenesis, fission/fusion, mitophagy, and mitochondrial function.62, 63 Importantly, our findings are also consistent with repression of mitochondrial‐related genes in the skeletal muscle of cachectic PDAC patients.50
As a means to confirm our findings in an alternative bioinformatics platform, we performed GO analysis on PDX TA and DIA microarray data using GSEA. This is unique from DAVID in that GSEA uses the expression data from each gene measured in each sample and creates a ranked list according to the average fold change (PDX muscle compared with sham). Based on this ranked list, GSEA analysis identifies GO gene sets that are overrepresented among the most up‐regulated or down‐regulated genes. In support of our DAVID findings, we found that the most enriched category for down‐regulated genes in the TA was ECM component, that one of the most enriched categories for up‐regulated genes in the DIA was adaptive immune response, and that one of the most enriched categories for down‐regulated genes in the DIA was cellular respiration (Figure 4C).
Shared effects of pancreatic cancer on tibialis anterior and diaphragm transcriptomes
To investigate potential shared molecular mechanisms of wasting in both muscles, we overlapped differentially expressed genes identified from the DIA and TA of all four PDX cohorts. This identified 34 genes that were commonly up‐regulated and 62 genes that were commonly down‐regulated in both muscles based on our criteria of absolute fold change ≥ 1.5 and FDRq ≤ 0.01 (Figure 6A; Table S6). For each set of overlapping genes, we performed GO and KEGG pathway analysis using DAVID. The most enriched GO term for up‐regulated genes was cytokine receptor activity, and the most enriched KEGG pathway was Jak‐STAT signalling (Figure 6B). There were four cytokine receptors that annotated to these categories: IL6ra (IL‐6 signalling), Osmr (oncostatin M and IL‐31 signalling), Csf2rb [IL‐3, IL‐5, and granulocyte‐macrophage colony stimulating factor (GM‐CSF signalling)], and Csf2rb2 (IL‐3 signalling) (Figure 6C). Each of these cytokine receptors are pro‐inflammatory and activate the Jak‐STAT pathway that has previously been implicated in cancer‐induced muscle wasting.64 Further supporting activation of this pathway, we found Stat3 up‐regulated in the TA and DIA 1.8‐fold and 1.6‐fold, respectively (Figure 5). The GO term positive regulation of cell proliferation was also enriched for commonly up‐regulated genes. Based on the specific genes that annotated to this category, this may relate to proliferation of fibroblasts or other non‐muscle cell types based on the known role of galectin 3 and IL‐6/oncostatin M signalling pathways in activation of fibrosis and inflammation.65, 66, 67 PI3K‐Akt signalling was an enriched KEGG pathway for commonly up‐regulated genes; however, Ddit4 and Eif4ebp1 annotated to this category, which are inhibitors of the PI3K‐Akt pathway. Therefore, this may reflect repression of this pathway rather than activation. Several up‐regulated genes annotating to the enriched GO and KEGG terms play a role in innate immunity as either pro‐inflammatory or anti‐inflammatory factors, or both, depending on the physiological context, including Lgals3 (galectin 3), Serpina3n, Sema7a (CD108), Entpd1 (CD39), and Lcn2.66, 68, 69, 70, 71, 72, 73 This suggests that the immune response is potentially being dysregulated to some degree in both TA and DIA.
Figure 6.
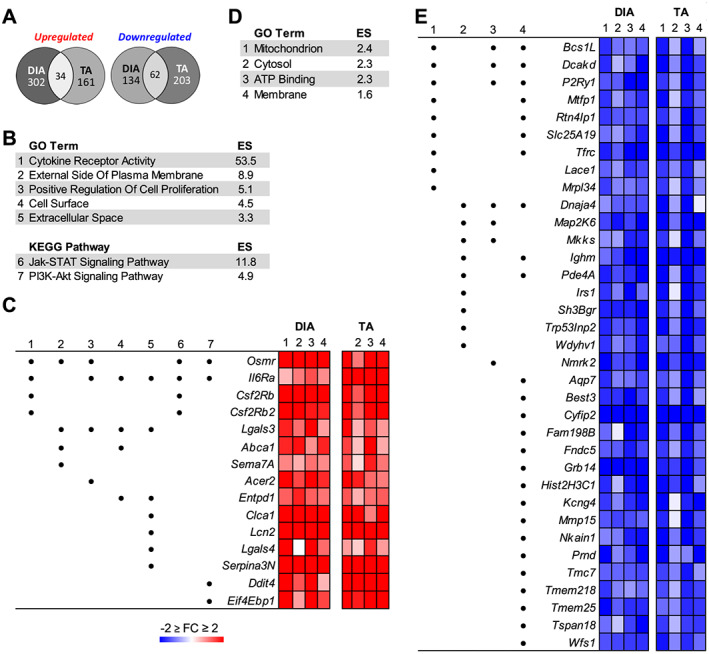
Gene Ontology (GO) and Kyoto Encyclopedia of Genes and Genomes (KEGG) pathway analyses of genes up‐regulated or down‐regulated in both the tibialis anterior (TA) and diaphragm (DIA) of pancreatic ductal adenocarcinoma‐patient‐derived xenograft (PDX) mice. Microarray analysis was performed on TA and DIA of Cohorts 1–4 PDX mice (and compared with TA and DIA of respective sham‐surgery controls). The data were combined and analysed using a linear mixed‐effects modelling approach to determine genes differentially expressed in the TA and DIA in response to tumour burden. Significantly differentially expressed genes were defined by an absolute fold change ≥ 1.5 and FDRq ≤ 0.01. (A) The number of genes similarly up‐regulated or down‐regulated in both the TA and DIA is shown. Shared genes were analysed with DAVID GO and KEGG pathway analyses. Colour intensity in each segment corresponds to the percentage of genes in that segment compared with the total number of genes on the Venn diagram. (B) Significantly enriched GO terms and KEGG pathways are listed for commonly up‐regulated genes. (C) Specific genes that annotated to one or more of the enriched categories are listed, and the GO or KEGG term to which they annotated is indicated by a number that corresponds to the number for the category in (B). Also shown is the fold change in expression for each gene in the TA and DIA of each cohort of PDX mice. The same analysis was performed on commonly down‐regulated genes, and enriched GO terms for the down‐regulated genes are listed (D) along with specific genes' fold change expression in the TA and DIA of each cohort of PDX mice (E).
The most enriched GO term from commonly down‐regulated genes in the PDX TA and DIA was mitochondrion (Figure 6D). Many of the genes annotating to this category play a role in oxidative phosphorylation including Bcs1l, Rtn4lp1 (Nogo‐interacting mitochondrial protein), and Lace1 (Figure 6E).74, 75, 76 There were additional repressed genes that annotated to cytosol or membrane that play roles in energy metabolism, including Tfrc (transferrin receptor protein 1), which is a critical regulator iron uptake77 and Irs1, which encodes an adapter protein and signal transducer for insulin‐mediated activation of the insulin‐like growth factor 1 receptor. Conversely, also repressed was Grb14, which encodes an adapter protein that inhibits insulin signalling through the insulin receptor.78, 79 ATP binding was also enriched. One gene annotating to this category is a purinergic signalling receptor, P2ry1 (P2Y1), shown to be involved in regulation of intracellular Ca2+ concentration.80 Two additional genes annotating to this GO category are chaperone proteins, Map 2k6 (MAPKK6) and Dnaja4 (HSP40). HSP40 is a critical regulator of the ATPase activity of HSP70.81 Loss of HSP70 has been shown to induce muscle atrophy, contractile dysfunction, and decrease regenerative capacity.82, 83 Therefore, decreased HSP40 could result in impaired functioning of HSP70, thereby contributing to muscle atrophy. Also annotating to ATP binding is Nmrk2 (ITGB1BP3), which plays a rate‐limiting step in maintenance of NAD+ in skeletal muscle.84 These data, in conjunction with the repression of mitochondria‐related genes, suggest an impairment in energy production in both TA and DIA.
Serum cytokine profile of pancreatic ductal adenocarcinoma‐patient‐derived xenograft mice
In addition to allowing for the study of muscle pathology in response to patient tumours, the PDAC‐PDX model also provides the unique opportunity to identify circulating factors released from human‐derived pancreatic tumours, as well as the host‐derived cytokines released in response to each unique tumour. Similar to cancer patients, including PDAC patients, there was substantial heterogeneity in the levels of cytokines between PDAC‐PDX cohorts. However several tumour derived (human) cytokines were still commonly increased, including eotaxin, IL‐7, IL‐1RA, IL‐4, IL‐12(p40), macrophage‐derived chemokine, and Fractalkine, which were each elevated in three of the four cohorts, and growth‐related oncogene (GRO) and IL‐8, which were both elevated in all four cohorts (Figure S6). GRO levels were particularly high, ranging from 365 to 5081 pg/mL across cohorts, while IL‐8 levels ranged from 75 to 979 pg/mL across the four cohorts. Because of the high sequence homology (>86%) between GRO alpha, GRO beta, and GRO gamma,85 the multiplex assay used does not distinguish between each. Therefore the increase in GRO could be due to an increase in one or more of the GRO proteins. Functionally, all three GRO proteins are powerful neutrophil chemoattractants86 and are involved in cancer metastasis,87 angiogenesis, and wound healing.88 Whether they are also involved in cachexia is, to our knowledge, currently unknown. However, CXCL1/KC, the mouse homologue of GRO alpha, is also released from murine tumour cells and has been established to impair muscle regeneration and satellite cell homeostasis,89 which are implicated in cancer‐associated muscle wasting.90 Moreover, the GRO proteins are structurally related to IL‐8 and commonly engage the CXCR2 receptor. In fact, recently published data from our lab demonstrate that IL‐8 released from human pancreatic cancer cells is causative in atrophy of muscle cells via CXCR2,91 and clinical data show that serum IL‐8 levels positively correlate with weight loss and negatively correlate with muscle mass in pancreatic cancer patients.92 Therefore, it is possible that the GRO proteins exert similar effects, but this remains to be tested.
Host‐derived (mouse) cytokines also showed heterogeneity between cohorts, with no factors commonly increased in three or more of the cohorts. However, G‐CSF, IL‐10, IL‐12 (p70), monocyte chemoattractant protein 1 (CCL2), and macrophage inflammatory protein‐1α were significantly increased in two of the four PDX cohorts compared with sham controls, and GM‐CSF, IL‐1α, IL‐6, KC, and macrophage inflammatory protein‐2 were significantly elevated in one of the four PDX cohorts (Figure S7).
As previously noted, cytokine receptor activity was the most enriched GO term for differentially expressed genes identified from DIA and TA of all four PDX cohorts, and IL6ra, Osmr, Csf2rb, and Csf2rb2 were the four cytokine receptors annotating to this category. Of the ligands that can engage these receptors, IL‐6, IL‐5, and GM‐CSF were present on the multiplex panels. Mouse IL‐6 was elevated in PDX Cohorts 1, 2, and 4, although only significantly so in Cohort 4, while human IL‐6 was increased in PDX Cohort 4 only. Mouse GM‐CSF was elevated in PDX Cohorts 2, 3, and 4, although only significantly so in Cohort 2, while human GM‐CSF was increased in PDX Cohorts 1 and 4. Neither mouse nor human IL‐5 was changed in any PDX cohort. These combined findings suggest that IL‐6 and/or GM‐CSF signalling could play a role in the PDAC‐PDX‐induced muscle wasting through increased engagement of their cellular receptors, in at least some of the cohorts. Indeed, it is likely that different combinations of circulating factors drive cachexia in each patient exhibiting cachexia. The PDAC‐PDX model could, therefore, be useful in testing anti‐cachexia therapies that target specific cytokines to determine the breadth of responsiveness across cohorts. Indeed, therapies that show a broad positive effect in PDAC‐PDX mice from multiple patients, which we demonstrate display cytokine heterogeneity similar to patients, may have greater translational potential.
Conclusions
In the current study, we studied four cohorts of orthotopic PDX mice derived from four individual cachectic PDAC patients to identify the histological and transcriptional effects of human pancreatic tumours on distinct skeletal muscles. Our findings demonstrate a differential susceptibility of muscles to human‐derived pancreatic tumours, which could be due to a variety of reasons including proximity to tumour or divergent physiology, metabolism, morphology, or intrinsic transcriptome. It is important, therefore, that data derived from one skeletal muscle not necessarily be considered as representative of skeletal muscle in general, without first considering whether the biological mechanisms are conserved across other muscles. Here we identify a subset of 96 genes that are differentially regulated in the TA and the DIA muscles of mice implanted with human pancreatic tumours derived from four heterogeneous PDAC patients. This gene set may, therefore, contain viable interventional targets to more broadly counter muscle wasting in response to pancreatic cancer, however, this remains to be tested.
Conflict of interest
Rachel Nosacka, Andrea Delitto, Dan Delitto, Rohan Patel, Sarah M. Judge, Jose G. Trevino, Andrew R. Judge declare that they have no conflicts of interest.
Funding
This work was supported by the National Institute of Arthritis, Musculoskeletal and Skin Diseases (R01AR060209 to ARJ); the UF Health Cancer Center (Bridge Funding to ARJ); and the V Foundation for Cancer Research (V2015‐021 to JGT). During these studies, RLN was supported by a National Center for Research Resources Grant (TL1‐TR‐000066) and, subsequently, a National Institute of Child Health and Human Development Grant (T32‐HD‐043730). The Boston University Microarray Core is supported by Clinical and Translational Science Award grant UL1‐TR001430.
Supporting information
Figure S1. Skeletal muscle pathology of PDAC‐PDX mouse abdominal muscle (ABD) and diaphraghm (DIA). Additional representative images of ABD (A) and DIA (B) stained with Hemotoxylin & Eosin (H&E) form cathectic PDAC‐PDX mice and corresponding sham‐surgery controls (cohort 1).
Figure S2. Relationship between tumour size and whole body wasting in PDAC‐PDX mice. (A) Average tumour weight for each cohort of PDX mice. (B) Correlation between average percent body weight loss from each cohort of PDX mice and average tumour weight loss from each cohort of PDX mice, (C) Correlation between percent body weight loss and tumour weight loss within each cohort of PDX mice.
Figure S3. Microarray analysis of the TA and DIA of PDAC‐PDX mice Cohort 2‐4. Microarray analysis was performed TA and DIA of PDAC‐PDX mice cohorts 2, 3 and 4 (and compared to and DIA respectively of sham‐surgery controls). Genes upregulated or downregulated in the TA and DIA of PDAC‐PDX mice in each cohort were defined by an absolute fold change≥1.5 and FDRq≤0.1. Venn diagrams show the number of differentially expressed genes for each muscle and the number of genes that overlap between them. Colour intensity in each segment corresponds to the percentage of genes on the Venn diagram. (n = 3 per Sham muscle, n = 5 per PDX muscle.)
Figure S4. Enriched Gene Ontology (GO) Categories and KEGG Pathways for genes up‐ or downregulated in the TA and DIA of PDAC‐PDX mice using DAVID Bioinformatics Database. Microarray analysis was performed on TA and DIA of PDX mice Cohort 1‐4 (and compared to TA and DIA respectively of sham‐surgery controls. Genes upregulated of downregulated in the TA and DIA of PDAX‐PDX mice in each cohort were defined by an absolute fold change≥1.5 and FDRq≤0.1. DAVID GO and KEGG Pathway analysis was performed for each set of genes upregulated of downregulated in each muscle seperately for each cohort. GO and KEGG terms commonly enriched in 2 or more cohorts are graphed here based on fold enrichment.
Figure S5. Collagen deposition in PDAC‐PDX mouse TA and DIA. Representative images of TA (A) and DIA (B) of PDAC‐PDX mice Cohorts 1‐4 and corresponding sham‐surgery controls cross sectioned and Masson's Trichrome‐stained. Quantification of the collagen content (blue) in the TA (C) and DIA (D). (Epimysial collagen exclude from quantification, n = 3, *P < 0.05)
Figure S6. Analysis of tumour‐derived cytokines in the serum of PDAC‐PDX mice and controls. Human‐derived cytokine concentrations in the serum of Cohort 1‐4 PDAC‐PDX mice and controls are shown. The sham‐surgery control group is the pool of the sham‐surgery controls from each of the four cohorts of mice (n = 9 total). PDX Cohort 1 (n = 9), Cohort 2 (n = 5), Cohort 3 (n = 5) and Cohort 4 (n = 5). (Ordinary one‐way ANOVA followed by multiple comparisons analysis of each PDX cohort compared to sham control)
Figure S7. Analysis of host‐derived cytokines in the serum of PDAC‐PDX mice and controls. Mouse‐derived cytokine concentrations in the serum of Cohort 1‐4 PDAC‐PDX mice and controls are shown. The sham‐surgery control group is the pool of the sham‐surgery controls from each of the four cohorts of mice (n = 9 total). PDX Cohort 1 (n = 9), Cohort 2 (n = 5), Cohort 3 (n = 5) and Cohort 4 (n = 5). (Ordinary one‐way ANOVA followed by multiple comparisons analysis of each PDX cohort compared to sham control)
Table S1. Characteristics of each patient from which each of the four cohorts of PDX mice were derived.
Table S2. DAVID Gene Ontology (GO) analysis of genes upregulated in the tibialis anterior of PDAC‐PDX mice (combined analysis of all four cohorts using the LME statistical model) with a fold change≥1.5 and FDRq≤0.01.
Table S3. DAVID Gene Ontology (GO) analysis of genes downregulated in the tibialis anterior of PDAC‐PDX mice (combined analysis of all four cohorts using the LME statistical model) with a fold change≤‐1.5 and FDRq≤0.01.
Table S4. DAVID Gene Ontology (GO) analysis of genes upregulated in the diaphragm of PDAC‐PDX mice (combined analysis of all four cohorts using the LME statistical model) with a fold change≥1.5 and FDRq≤0.01.
Table S5. DAVID Gene Ontology (GO) analysis of genes downregulated in the diaphragm of PDAC‐PDX mice (combined analysis of all four cohorts using the LME statistical model) with a fold change≤‐1.5 and FDRq≤0.01.
Table S6. Genes significantly up‐ or downregulated in both the diaphragm and tibialis anterior of PDAC‐PDX mice (combined analysis of all four cohorts using the LME statistical model) with a ‐1.5 ≥ fold change≥1.5 and FDRq≤0.01.
Acknowledgements
The authors certify that they comply with the ethical guidelines for publishing in the Journal of Cachexia, Sarcopenia, and Muscle.93
Nosacka R. L., Delitto A., Delitto D., Patel R., Judge S. M., Trevino J. G., and Judge A. R. (2020) Distinct cachexia profiles in response to human pancreatic tumours in mouse limb and respiratory muscle, Journal of Cachexia, Sarcopenia and Muscle, 11, 820–837. 10.1002/jcsm.12550.
References
- 1. Fearon K, Strasser F, Anker SD, Bosaeus I, Bruera E, Fainsinger RL, et al. Definition and classification of cancer cachexia: an international consensus. Lancet Oncol 2011;12:489–495. [DOI] [PubMed] [Google Scholar]
- 2. Tisdale MJ. Mechanisms of cancer cachexia. Physiol Rev 2009;89:381–410. [DOI] [PubMed] [Google Scholar]
- 3. Wigmore SJ, Plester CE, Richardson RA, Fearon KC. Changes in nutritional status associated with unresectable pancreatic cancer. Br J Cancer 1997;75:106–109. [DOI] [PMC free article] [PubMed] [Google Scholar]
- 4. Fearon KC, Voss AC, Hustead DS. Definition of cancer cachexia: effect of weight loss, reduced food intake, and systemic inflammation on functional status and prognosis. Am J Clin Nutr 2006;83:1345–1350. [DOI] [PubMed] [Google Scholar]
- 5. Dewys WD, Begg C, Lavin PT, Band PR, Bennett JM, Bertino JR, et al. Prognostic effect of weight loss prior to chemotherapy in cancer patients. Eastern Cooperative Oncology Group. Am J Med 1980;69:491–497. [DOI] [PubMed] [Google Scholar]
- 6. Vigano A, Donaldson N, Higginson IJ, Bruera E, Mahmud S, Suarez‐Almazor M. Quality of life and survival prediction in terminal cancer patients: a multicenter study. Cancer 2004;101:1090–1098. [DOI] [PubMed] [Google Scholar]
- 7. Vigano A, Dorgan M, Buckingham J, Bruera E, Suarez‐Almazor ME. Survival prediction in terminal cancer patients: a systematic review of the medical literature. Palliat Med 2000;14:363–374. [DOI] [PubMed] [Google Scholar]
- 8. Delitto D, Judge SM, George TJ Jr, Sarosi GA, Thomas RM, Behrns KE, et al. A clinically applicable muscular index predicts long‐term survival in resectable pancreatic cancer. Surgery 2016. [DOI] [PubMed] [Google Scholar]
- 9. Choi Y, Oh DY, Kim TY, Lee KH, Han SW, Im SA, et al. Skeletal Muscle depletion predicts the prognosis of patients with advanced pancreatic cancer undergoing palliative chemotherapy, independent of body mass index. PLoS ONE 2015;10:e0139749. [DOI] [PMC free article] [PubMed] [Google Scholar]
- 10. Meza‐Junco J, Montano‐Loza AJ, Baracos VE, Prado CM, Bain VG, Beaumont C, et al. Sarcopenia as a prognostic index of nutritional status in concurrent cirrhosis and hepatocellular carcinoma. J Clin Gastroenterol 2013;47:861–870. [DOI] [PubMed] [Google Scholar]
- 11. Sharma P, Zargar‐Shoshtari K, Caracciolo JT, Fishman M, Poch MA, Pow‐Sang J, et al. Sarcopenia as a predictor of overall survival after cytoreductive nephrectomy for metastatic renal cell carcinoma. Urol Oncol 2015;33:339.e17–339.e23. [DOI] [PubMed] [Google Scholar]
- 12. Andreyev HJ, Norman AR, Oates J, Cunningham D. Why do patients with weight loss have a worse outcome when undergoing chemotherapy for gastrointestinal malignancies? Eur J Cancer 1998;34:503–509. [DOI] [PubMed] [Google Scholar]
- 13. Donohoe CL, Ryan AM, Reynolds JV. Cancer cachexia: mechanisms and clinical implications. Gastroenterol Res Pract 2011;2011:601434. [DOI] [PMC free article] [PubMed] [Google Scholar]
- 14. Dev R, Wong A, Hui D, Bruera E. The evolving approach to management of cancer cachexia. Oncology (Williston Park) 2017;31:23–32. [PubMed] [Google Scholar]
- 15. Baracos VE. Bridging the gap: are animal models consistent with clinical cancer cachexia? Nat Rev Clin Oncol 2018;15:197–198. [DOI] [PubMed] [Google Scholar]
- 16. Ballarò R, Costelli P, Penna F. Animal models for cancer cachexia. Curr Opin Support Palliat Care 2016;10:281–287. [DOI] [PubMed] [Google Scholar]
- 17. Michaelis KA, Zhu X, Burfeind KG, Krasnow SM, Levasseur PR, Morgan TK, et al. Establishment and characterization of a novel murine model of pancreatic cancer cachexia. J Cachexia Sarcopenia Muscle 2017;8:824–838. [DOI] [PMC free article] [PubMed] [Google Scholar]
- 18. Talbert EE, Cuitiño MC, Ladner KJ, Rajasekerea PV, Siebert M, Shakya R, et al. Modeling human cancer‐induced cachexia. Cell Rep 2019;28:1612–1622.e4. [DOI] [PMC free article] [PubMed] [Google Scholar]
- 19. Bachmann J, Heiligensetzer M, Krakowski‐Roosen H, Büchler MW, Friess H, Martignoni ME. Cachexia worsens prognosis in patients with resectable pancreatic cancer. J Gastrointest Surg 2008;12:1193–1201. [DOI] [PubMed] [Google Scholar]
- 20. Siegel RL, Miller KD, Jemal A. Cancer Statistics, 2017. CA Cancer J Clin 2017;67:7–30. [DOI] [PubMed] [Google Scholar]
- 21. Aparicio S, Hidalgo M, Kung AL. Examining the utility of patient‐derived xenograft mouse models. Nat Rev Cancer 2015;15:311–316. [DOI] [PubMed] [Google Scholar]
- 22. Siolas D, Hannon GJ. Patient‐derived tumor xenografts: transforming clinical samples into mouse models. Cancer Res 2013;73:5315–5319. [DOI] [PMC free article] [PubMed] [Google Scholar]
- 23. Sicklick JK, Leonard SY, Babicky ML, Tang CM, Mose ES, French RP, et al. Generation of orthotopic patient‐derived xenografts from gastrointestinal stromal tumor. J Transl Med 2014;12:41. [DOI] [PMC free article] [PubMed] [Google Scholar]
- 24. Whittle JR, Lewis MT, Lindeman GJ, Visvader JE. Patient‐derived xenograft models of breast cancer and their predictive power. Breast Cancer Res 2015;17:17. [DOI] [PMC free article] [PubMed] [Google Scholar]
- 25. Rosfjord E, Lucas J, Li G, Gerber HP. Advances in patient‐derived tumor xenografts: from target identification to predicting clinical response rates in oncology. Biochem Pharmacol 2014;91:135–143. [DOI] [PubMed] [Google Scholar]
- 26. Daniel VC, Marchionni L, Hierman JS, Rhodes JT, Devereux WL, Rudin CM, et al. A primary xenograft model of small‐cell lung cancer reveals irreversible changes in gene expression imposed by culture in vitro. Cancer Res 2009;69:3364–3373. [DOI] [PMC free article] [PubMed] [Google Scholar]
- 27. Herter‐Sprie GS, Kung AL, Wong KK. New cast for a new era: preclinical cancer drug development revisited. J Clin Invest 2013;123:3639–3645. [DOI] [PMC free article] [PubMed] [Google Scholar]
- 28. Matsumoto T, Fujimoto‐Ouchi K, Tamura S, Tanaka Y, Ishitsuka H. Tumour inoculation site‐dependent induction of cachexia in mice bearing colon 26 carcinoma. Br J Cancer 1999;79:764–769. [DOI] [PMC free article] [PubMed] [Google Scholar]
- 29. Chiba F, Soda K, Yamada S, Tokutake Y, Chohnan S, Konishi F, et al. The importance of tissue environment surrounding the tumor on the development of cancer cachexia. Int J Oncol 2014;44:177–186. [DOI] [PubMed] [Google Scholar]
- 30. Go KL, Delitto D, Judge SM, Gerber MH, George TJ Jr, Behrns KE, et al. Orthotopic patient‐derived pancreatic cancer xenografts engraft into the pancreatic parenchyma, metastasize, and induce muscle wasting to recapitulate the human disease. Pancreas 2017;46:813–819. [DOI] [PMC free article] [PubMed] [Google Scholar]
- 31. Tomasin R, Martin ACBM, Cominetti MR. Metastasis and cachexia: alongside in clinics, but not so in animal models. J Cachexia Sarcopenia Muscle 2019. [DOI] [PMC free article] [PubMed] [Google Scholar]
- 32. Waning DL, Mohammad KS, Reiken S, Xie W, Andersson DC, John S, et al. Excess TGF‐β mediates muscle weakness associated with bone metastases in mice. Nat Med 2015;21:1262–1271. [DOI] [PMC free article] [PubMed] [Google Scholar]
- 33. Wang G, Biswas AK, Ma W, Kandpal M, Coker C, Grandgenett PM, et al. Metastatic cancers promote cachexia through ZIP14 upregulation in skeletal muscle. Nat Med 2018;24:770–781. [DOI] [PMC free article] [PubMed] [Google Scholar]
- 34. Pfitzenmaier J, Vessella R, Higano CS, Noteboom JL, Wallace D Jr, Corey E. Elevation of cytokine levels in cachectic patients with prostate carcinoma. Cancer 2003;97:1211–1216. [DOI] [PubMed] [Google Scholar]
- 35. Terry EE, Zhang X, Hoffmann C, Hughes LD, Lewis SA, Li J, et al. Transcriptional profiling reveals extraordinary diversity among skeletal muscle tissues. Elife 2018;7. [DOI] [PMC free article] [PubMed] [Google Scholar]
- 36. Roberts BM, Frye GS, Ahn B, Ferreira LF, Judge AR. Cancer cachexia decreases specific force and accelerates fatigue in limb muscle. Biochem Biophys Res Commun 2013;435:488–492. [DOI] [PMC free article] [PubMed] [Google Scholar]
- 37. Roberts BM, Ahn B, Smuder AJ, Al‐Rajhi M, Gill LC, Beharry AW, et al. Diaphragm and ventilatory dysfunction during cancer cachexia. FASEB J 2013;27:2600–2610. [DOI] [PMC free article] [PubMed] [Google Scholar]
- 38. Stedman HH, Sweeney HL, Shrager JB, Maguire HC, Panettieri RA, Petrof BA, et al. The mdx mouse diaphragm reproduces the degenerative changes of Duchenne muscular dystrophy. Nature 1991;352:536–539. [DOI] [PubMed] [Google Scholar]
- 39. Muller J, Vayssiere N, Royuela M, Leger ME, Muller A, Bacou F, et al. Comparative evolution of muscular dystrophy in diaphragm, gastrocnemius and masseter muscles from old male mdx mice. J Muscle Res Cell Motil 2001;22:133–139. [DOI] [PubMed] [Google Scholar]
- 40. Louboutin JP, Fichter‐Gagnepain V, Thaon E, Fardeau M. Morphometric analysis of mdx diaphragm muscle fibres. Comparison with hindlimb muscles. Neuromuscul Disord 1993;3:463–469. [DOI] [PubMed] [Google Scholar]
- 41. Feathers LS, Wilcock A, Manderson C, Weller R, Tattersfield AE. Measuring inspiratory muscle weakness in patients with cancer and breathlessness. J Pain Symptom Manage 2003;25:305–306. [DOI] [PubMed] [Google Scholar]
- 42. Delitto D, Pham K, Vlada AC, Sarosi GA, Thomas RM, Behrns KE, et al. Patient‐derived xenograft models for pancreatic adenocarcinoma demonstrate retention of tumor morphology through incorporation of murine stromal elements. Am J Pathol 2015;185:1297–1303. [DOI] [PMC free article] [PubMed] [Google Scholar]
- 43. Rubio‐Viqueira B, Jimeno A, Cusatis G, Zhang X, Iacobuzio‐Donahue C, Karikari C, et al. An in vivo platform for translational drug development in pancreatic cancer. Clin Cancer Res 2006;12:4652–4661. [DOI] [PubMed] [Google Scholar]
- 44. Reich M, Liefeld T, Gould J, Lerner J, Tamayo P, Mesirov JP. GenePattern 2.0. Nat Genet 2006;38:500–501. [DOI] [PubMed] [Google Scholar]
- 45. Huang DW, Sherman BT, Lempicki RA. Systematic and integrative analysis of large gene lists using DAVID bioinformatics resources. Nat Protoc 2009;4:44–57. [DOI] [PubMed] [Google Scholar]
- 46. Mootha VK, Lindgren CM, Eriksson KF, Subramanian A, Sihag S, Lehar J, et al. PGC‐1alpha‐responsive genes involved in oxidative phosphorylation are coordinately downregulated in human diabetes. Nat Genet 2003;34:267–273. [DOI] [PubMed] [Google Scholar]
- 47. Subramanian A, Tamayo P, Mootha VK, Mukherjee S, Ebert BL, Gillette MA, et al. Gene set enrichment analysis: a knowledge‐based approach for interpreting genome‐wide expression profiles. Proc Natl Acad Sci U S A 2005;102:15545–15550. [DOI] [PMC free article] [PubMed] [Google Scholar]
- 48. Edgar R, Domrachev M, Lash AE. Gene Expression Omnibus: NCBI gene expression and hybridization array data repository. Nucleic Acids Res 2002;30:207–210. [DOI] [PMC free article] [PubMed] [Google Scholar]
- 49. Kandarian SC, Nosacka RL, Delitto AE, Judge AR, Judge SM, Ganey JD, et al. Tumour‐derived leukaemia inhibitory factor is a major driver of cancer cachexia and morbidity in C26 tumour‐bearing mice. J Cachexia Sarcopenia Muscle 2018;9:1109–1120. [DOI] [PMC free article] [PubMed] [Google Scholar]
- 50. Judge SM, Nosacka RL, Delitto D, Gerber MH, Cameron ME, Trevino JG, et al. Skeletal muscle fibrosis in pancreatic cancer patients with respect to survival. JNCI Cancer Spectr 2018;2:pky043. [DOI] [PMC free article] [PubMed] [Google Scholar]
- 51. Argiles JM, Busquets S, Stemmler B, López‐Soriano FJ. Cancer cachexia: understanding the molecular basis. Nat Rev Cancer 2014;14:754–762. [DOI] [PubMed] [Google Scholar]
- 52. Judge SM, Wu CL, Beharry AW, Roberts BM, Ferreira LF, Kandarian SC, et al. Genome‐wide identification of FoxO‐dependent gene networks in skeletal muscle during C26 cancer cachexia. BMC Cancer 2014;14:997. [DOI] [PMC free article] [PubMed] [Google Scholar]
- 53. Shultz LD, Schweitzer PA, Christianson SW, Gott B, Schweitzer IB, Tennent B, et al. Multiple defects in innate and adaptive immunologic function in NOD/LtSz‐scid mice. J Immunol 1995;154:180–191. [PubMed] [Google Scholar]
- 54. Hu Z, Van Rooijen N, Yang YG. Macrophages prevent human red blood cell reconstitution in immunodeficient mice. Blood 2011;118:5938–5946. [DOI] [PMC free article] [PubMed] [Google Scholar]
- 55. Piganelli JD, Martin T, Haskins K. Splenic macrophages from the NOD mouse are defective in the ability to present antigen. Diabetes 1998;47:1212–1218. [DOI] [PubMed] [Google Scholar]
- 56. Morales MG, Cabello‐Verrugio C, Santander C, Cabrera D, Goldschmeding R, Brandan E. CTGF/CCN‐2 over‐expression can directly induce features of skeletal muscle dystrophy. J Pathol 2011;225:490–501. [DOI] [PubMed] [Google Scholar]
- 57. Pontén A, Li X, Thorén P, Aase K, Sjöblom T, Östman A, et al. Transgenic overexpression of platelet‐derived growth factor‐C in the mouse heart induces cardiac fibrosis, hypertrophy, and dilated cardiomyopathy. Am J Pathol 2003;163:673–682. [DOI] [PMC free article] [PubMed] [Google Scholar]
- 58. Campbell JS, Hughes SD, Gilbertson DG, Palmer TE, Holdren MS, Haran AC, et al. Platelet‐derived growth factor C induces liver fibrosis, steatosis, and hepatocellular carcinoma. Proc Natl Acad Sci U S A 2005;102:3389–3394. [DOI] [PMC free article] [PubMed] [Google Scholar]
- 59. Malecova B, Gatto S, Etxaniz U, Passafaro M, Cortez A, Nicoletti C, et al. Dynamics of cellular states of fibro‐adipogenic progenitors during myogenesis and muscular dystrophy. Nat Commun 2018;9:3670. [DOI] [PMC free article] [PubMed] [Google Scholar]
- 60. Biferali B, Proietti D, Mozzetta C, Madaro L. Fibro‐adipogenic progenitors cross‐talk in skeletal muscle: the social network. Front Physiol 2019;10:1074. [DOI] [PMC free article] [PubMed] [Google Scholar]
- 61. Farini A, Meregalli M, Belicchi M, Battistelli M, Parolini D, D'Antona G, et al. T and B lymphocyte depletion has a marked effect on the fibrosis of dystrophic skeletal muscles in the scid/mdx mouse. J Pathol 2007;213:229–238. [DOI] [PubMed] [Google Scholar]
- 62. Neyroud D, Nosacka RL, Judge AR, Hepple RT. Colon 26 adenocarcinoma (C26)‐induced cancer cachexia impairs skeletal muscle mitochondrial function and content. J Muscle Res Cell Motil 2019;40:59–65. [DOI] [PMC free article] [PubMed] [Google Scholar]
- 63. van der Ende M, Grefte S, Plas R, Meijerink J, Witkamp R, Keijer J, et al. Mitochondrial dynamics in cancer‐induced cachexia. Biochim Biophys Acta Rev Cancer 2018;1870:137–150. [DOI] [PubMed] [Google Scholar]
- 64. Bonetto A, Aydogdu T, Kunzevitzky N, Guttridge DC, Khuri S, Koniaris LG, et al. STAT3 activation in skeletal muscle links muscle wasting and the acute phase response in cancer cachexia. PLoS ONE 2011;6:e22538. [DOI] [PMC free article] [PubMed] [Google Scholar]
- 65. Stawski L, Trojanowska M. Oncostatin M and its role in fibrosis. Connect Tissue Res 2019;60:40–49. [DOI] [PMC free article] [PubMed] [Google Scholar]
- 66. Li LC, Li J, Gao J. Functions of galectin‐3 and its role in fibrotic diseases. J Pharmacol Exp Ther 2014;351:336–343. [DOI] [PubMed] [Google Scholar]
- 67. West NR. Coordination of immune‐stroma crosstalk by IL‐6 family cytokines. Front Immunol 2019;10:1093. [DOI] [PMC free article] [PubMed] [Google Scholar]
- 68. Doe JA, Wuebbles RD, Allred ET, Rooney JE, Elorza M, Burkin DJ. Transgenic overexpression of the α7 integrin reduces muscle pathology and improves viability in the dy(W) mouse model of merosin‐deficient congenital muscular dystrophy type 1A. J Cell Sci 2011;124:2287–2297. [DOI] [PMC free article] [PubMed] [Google Scholar]
- 69. Tjondrokoesoemo A, Schips T, Kanisicak O, Sargent MA, Molkentin JD. Genetic overexpression of Serpina3n attenuates muscular dystrophy in mice. Hum Mol Genet 2016;25:1192–1202. [DOI] [PMC free article] [PubMed] [Google Scholar]
- 70. Suzuki K, Okuno T, Yamamoto M, Pasterkamp RJ, Takegahara N, Takamatsu H, et al. Semaphorin 7A initiates T‐cell‐mediated inflammatory responses through alpha1beta1 integrin. Nature 2007;446:680–684. [DOI] [PubMed] [Google Scholar]
- 71. Holmes S, Downs AM, Fosberry A, Hayes PD, Michalovich D, Murdoch P, et al. Sema7A is a potent monocyte stimulator. Scand J Immunol 2002;56:270–275. [DOI] [PubMed] [Google Scholar]
- 72. Antonioli L, Pacher P, Vizi ES, Haskó G. CD39 and CD73 in immunity and inflammation. Trends Mol Med 2013;19:355–367. [DOI] [PMC free article] [PubMed] [Google Scholar]
- 73. Rebalka IA, Monaco CM, Varah NE, Berger T, D'souza DM, Zhou S, et al. Loss of the adipokine lipocalin‐2 impairs satellite cell activation and skeletal muscle regeneration. Am J Physiol Cell Physiol 2018;315:C714–C721. [DOI] [PMC free article] [PubMed] [Google Scholar]
- 74. Tamai S, Iida H, Yokota S, Sayano T, Kiguchiya S, Ishihara N, et al. Characterization of the mitochondrial protein LETM1, which maintains the mitochondrial tubular shapes and interacts with the AAA‐ATPase BCS1L. J Cell Sci 2008;121:2588–2600. [DOI] [PubMed] [Google Scholar]
- 75. Angebault C, Guichet PO, Talmat‐Amar Y, Charif M, Gerber S, Fares‐Taie L, et al. Recessive mutations in RTN4IP1 cause isolated and syndromic optic neuropathies. Am J Hum Genet 2015;97:754–760. [DOI] [PMC free article] [PubMed] [Google Scholar]
- 76. Cesnekova J, Rodinova M, Hansikova H, Houstek J, Zeman J, Stiburek L. The mammalian homologue of yeast Afg1 ATPase (lactation elevated 1) mediates degradation of nuclear‐encoded complex IV subunits. Biochem J 2016;473:797–804. [DOI] [PubMed] [Google Scholar]
- 77. Barrientos T, Laothamatas I, Koves TR, Soderblom EJ, Bryan M, Moseley MA, et al. Metabolic catastrophe in mice lacking transferrin receptor in muscle. EBioMedicine 2015;2:1705–1717. [DOI] [PMC free article] [PubMed] [Google Scholar]
- 78. Park JJ, Berggren JR, Hulver MW, Houmard JA, Hoffman EP. GRB14, GPD1, and GDF8 as potential network collaborators in weight loss‐induced improvements in insulin action in human skeletal muscle. Physiol Genomics 2006;27:114–121. [DOI] [PubMed] [Google Scholar]
- 79. Holt LJ, Siddle K. Grb10 and Grb14: enigmatic regulators of insulin action‐and more? Biochem J 2005;388:393–406. [DOI] [PMC free article] [PubMed] [Google Scholar]
- 80. Krasowska E, Róg J, Sinadinos A, Young CN, Górecki DC, Zabłocki K. Purinergic receptors in skeletal muscles in health and in muscular dystrophy. Postepy Biochem 2014;60:483–489. [PubMed] [Google Scholar]
- 81. Fan CY, Lee S, Cyr DM. Mechanisms for regulation of Hsp70 function by Hsp40. Cell Stress Chaperones 2003;8:309–316. [DOI] [PMC free article] [PubMed] [Google Scholar]
- 82. Senf SM, Dodd SL, McClung JM, Judge AR. Hsp70 overexpression inhibits NF‐kappaB and Foxo3a transcriptional activities and prevents skeletal muscle atrophy. FASEB J 2008;22:3836–3845. [DOI] [PMC free article] [PubMed] [Google Scholar]
- 83. Senf SM. Skeletal muscle heat shock protein 70: diverse functions and therapeutic potential for wasting disorders. Front Physiol 2013;4:330. [DOI] [PMC free article] [PubMed] [Google Scholar]
- 84. Deloux R, Tannous C, Ferry A, Li Z, Mericskay M. Aged nicotinamide riboside kinase 2 deficient mice present an altered response to endurance exercise training. Front Physiol 2018;9:1290. [DOI] [PMC free article] [PubMed] [Google Scholar]
- 85. Cuenca RE, Azizkhan RG, Haskill S. Characterization of GRO alpha, beta and gamma expression in human colonic tumours: potential significance of cytokine involvement. Surg Oncol 1992;1:323–329. [DOI] [PubMed] [Google Scholar]
- 86. Rudack C, Maune S, Eble J, Schroeder JM. The primary role in biologic activity of the neutrophil chemokines IL‐8 and GRO‐alpha in cultured nasal epithelial cells. J Interferon Cytokine Res 2003;23:113–123. [DOI] [PubMed] [Google Scholar]
- 87. Doll D, Keller L, Maak M, Boulesteix AL, Siewert JR, Holzmann B, et al. Differential expression of the chemokines GRO‐2, GRO‐3, and interleukin‐8 in colon cancer and their impact on metastatic disease and survival. Int J Colorectal Dis 2010;25:573–581. [DOI] [PubMed] [Google Scholar]
- 88. Zaja‐Milatovic S, Richmond A. CXC chemokines and their receptors: a case for a significant biological role in cutaneous wound healing. Histol Histopathol 2008;23:1399–1407. [DOI] [PMC free article] [PubMed] [Google Scholar]
- 89. Hogan KA, Cho DS, Arneson PC, Samani A, Palines P, Yang Y, et al. Tumor‐derived cytokines impair myogenesis and alter the skeletal muscle immune microenvironment. Cytokine 2018;107:9–17. [DOI] [PMC free article] [PubMed] [Google Scholar]
- 90. He WA, Berardi E, Cardillo VM, Acharyya S, Aulino P, Thomas‐Ahner J, et al. NF‐κB‐mediated Pax7 dysregulation in the muscle microenvironment promotes cancer cachexia. J Clin Invest 2013;123:4821–4835. [DOI] [PMC free article] [PubMed] [Google Scholar]
- 91. Callaway CS, Delitto AE, Patel R, Nosacka RL, D'Lugos AC, Delitto D, et al. IL‐8 Released from human pancreatic cancer and tumor‐associated stromal cells signals through a CXCR2‐ERK1/2 axis to induce muscle atrophy. Cancers (Basel) 2019;11:1863. [DOI] [PMC free article] [PubMed] [Google Scholar]
- 92. Hou YC, Wang CJ, Chao YJ, Chen HY, Wang HC, Tung HL, et al. Elevated Serum Interleukin‐8 Level Correlates with Cancer‐Related Cachexia and Sarcopenia: An Indicator for Pancreatic Cancer Outcomes. J Clin Med 2018;7:502. [DOI] [PMC free article] [PubMed] [Google Scholar]
- 93. von Haehling S, Morley JE, Coats AJS, Anker SD. Ethical guidelines for publishing in the Journal of Cachexia, Sarcopenia and Muscle: update 2019. J Cachexia Sarcopenia Muscle 2019; 10: 1143–1145. [DOI] [PMC free article] [PubMed] [Google Scholar]
Associated Data
This section collects any data citations, data availability statements, or supplementary materials included in this article.
Supplementary Materials
Figure S1. Skeletal muscle pathology of PDAC‐PDX mouse abdominal muscle (ABD) and diaphraghm (DIA). Additional representative images of ABD (A) and DIA (B) stained with Hemotoxylin & Eosin (H&E) form cathectic PDAC‐PDX mice and corresponding sham‐surgery controls (cohort 1).
Figure S2. Relationship between tumour size and whole body wasting in PDAC‐PDX mice. (A) Average tumour weight for each cohort of PDX mice. (B) Correlation between average percent body weight loss from each cohort of PDX mice and average tumour weight loss from each cohort of PDX mice, (C) Correlation between percent body weight loss and tumour weight loss within each cohort of PDX mice.
Figure S3. Microarray analysis of the TA and DIA of PDAC‐PDX mice Cohort 2‐4. Microarray analysis was performed TA and DIA of PDAC‐PDX mice cohorts 2, 3 and 4 (and compared to and DIA respectively of sham‐surgery controls). Genes upregulated or downregulated in the TA and DIA of PDAC‐PDX mice in each cohort were defined by an absolute fold change≥1.5 and FDRq≤0.1. Venn diagrams show the number of differentially expressed genes for each muscle and the number of genes that overlap between them. Colour intensity in each segment corresponds to the percentage of genes on the Venn diagram. (n = 3 per Sham muscle, n = 5 per PDX muscle.)
Figure S4. Enriched Gene Ontology (GO) Categories and KEGG Pathways for genes up‐ or downregulated in the TA and DIA of PDAC‐PDX mice using DAVID Bioinformatics Database. Microarray analysis was performed on TA and DIA of PDX mice Cohort 1‐4 (and compared to TA and DIA respectively of sham‐surgery controls. Genes upregulated of downregulated in the TA and DIA of PDAX‐PDX mice in each cohort were defined by an absolute fold change≥1.5 and FDRq≤0.1. DAVID GO and KEGG Pathway analysis was performed for each set of genes upregulated of downregulated in each muscle seperately for each cohort. GO and KEGG terms commonly enriched in 2 or more cohorts are graphed here based on fold enrichment.
Figure S5. Collagen deposition in PDAC‐PDX mouse TA and DIA. Representative images of TA (A) and DIA (B) of PDAC‐PDX mice Cohorts 1‐4 and corresponding sham‐surgery controls cross sectioned and Masson's Trichrome‐stained. Quantification of the collagen content (blue) in the TA (C) and DIA (D). (Epimysial collagen exclude from quantification, n = 3, *P < 0.05)
Figure S6. Analysis of tumour‐derived cytokines in the serum of PDAC‐PDX mice and controls. Human‐derived cytokine concentrations in the serum of Cohort 1‐4 PDAC‐PDX mice and controls are shown. The sham‐surgery control group is the pool of the sham‐surgery controls from each of the four cohorts of mice (n = 9 total). PDX Cohort 1 (n = 9), Cohort 2 (n = 5), Cohort 3 (n = 5) and Cohort 4 (n = 5). (Ordinary one‐way ANOVA followed by multiple comparisons analysis of each PDX cohort compared to sham control)
Figure S7. Analysis of host‐derived cytokines in the serum of PDAC‐PDX mice and controls. Mouse‐derived cytokine concentrations in the serum of Cohort 1‐4 PDAC‐PDX mice and controls are shown. The sham‐surgery control group is the pool of the sham‐surgery controls from each of the four cohorts of mice (n = 9 total). PDX Cohort 1 (n = 9), Cohort 2 (n = 5), Cohort 3 (n = 5) and Cohort 4 (n = 5). (Ordinary one‐way ANOVA followed by multiple comparisons analysis of each PDX cohort compared to sham control)
Table S1. Characteristics of each patient from which each of the four cohorts of PDX mice were derived.
Table S2. DAVID Gene Ontology (GO) analysis of genes upregulated in the tibialis anterior of PDAC‐PDX mice (combined analysis of all four cohorts using the LME statistical model) with a fold change≥1.5 and FDRq≤0.01.
Table S3. DAVID Gene Ontology (GO) analysis of genes downregulated in the tibialis anterior of PDAC‐PDX mice (combined analysis of all four cohorts using the LME statistical model) with a fold change≤‐1.5 and FDRq≤0.01.
Table S4. DAVID Gene Ontology (GO) analysis of genes upregulated in the diaphragm of PDAC‐PDX mice (combined analysis of all four cohorts using the LME statistical model) with a fold change≥1.5 and FDRq≤0.01.
Table S5. DAVID Gene Ontology (GO) analysis of genes downregulated in the diaphragm of PDAC‐PDX mice (combined analysis of all four cohorts using the LME statistical model) with a fold change≤‐1.5 and FDRq≤0.01.
Table S6. Genes significantly up‐ or downregulated in both the diaphragm and tibialis anterior of PDAC‐PDX mice (combined analysis of all four cohorts using the LME statistical model) with a ‐1.5 ≥ fold change≥1.5 and FDRq≤0.01.