

Abstract
Background
The improvement in muscle strength generally exceeds the increase in muscle size following strength training in frail elderly, highlighting the complex aetiology of strength deficit in aging. The aim of this study was to investigate the effect of heavy‐load strength training on a broad number of factors related to specific strength in frail elderly.
Methods
Thirty‐four frail elderly men (n = 18) and women (n = 16) aged 67 to 98 (86 ± 7 years) were randomized to either a group performing strength training twice a week for 10 weeks (ST) or a non‐exercising control group (CON). Knee extensor muscle strength was tested as one‐repetition maximum (1RM) and isometric maximal voluntary contraction (MVC) torque. Muscle activation was assessed by the interpolated twitch technique, and muscle density [mean Hounsfield units (HU)] and intermuscular adipose tissue (IMAT) by computed tomography scans of the quadriceps femoris. Muscle biopsies from the vastus lateralis were obtained to investigate changes in intramyocellular lipids and single‐fibre specific tension.
Results
In ST, knee extension 1RM and MVC improved by 17 and 7%, respectively. Muscle cross‐sectional area of the quadriceps femoris increased by 7%, accompanied by a 4% increase of muscle density. No changes in IMAT, voluntary activation level, single‐fibre specific tension, or lipid content were observed.
Conclusions
In contrast to several previous reports, the improvements in isometric muscle strength and muscle area were in good agreement in the present study. The training‐induced increase in muscle density was not due to changes in skeletal muscle lipid content. Instead, the increase in muscle density may reflect increased packing of contractile material or simply an increased ratio of muscle tissue relative to IMAT.
Keywords: Resistance exercise, Sarcopenia, Specific strength, Muscle attenuation, Lipid content
Introduction
Strength training is a well‐established countermeasure against the age‐related declines in muscle mass, strength, and function.1, 2, 3 Interestingly, the training‐induced improvement in muscle strength greatly exceeds the increase in muscle size,4, 5 and this is particularly evident in individuals of very high age or with reduced functional capacity.6, 7, 8, 9 The increase in specific strength is likely multifactorial, and both neural and muscular factors are thought to play a role. However, their relative contribution is not well characterized.
In healthy elderly, minimal or relatively small improvements in activation level are observed after strength training.4, 10, 11 Very few have investigated the effect of exercise in pre‐frail and frail elderly, but so far, evidence suggests that improvements in activation level contribute slightly more to training‐induced strength gains in this population.12 Nevertheless, more data are required to fully elucidate the extent to which improvements in activation level contribute to the training‐induced improvements in specific strength in frail elderly.
Altered muscle composition has also been proposed as a contributor to training‐induced changes in specific strength. Muscle attenuation in Hounsfield units (HU) obtained by computed tomography (CT) is a non‐invasive measure of muscle density and has been shown to correlate with skeletal muscle lipid content.13, 14 Aging is associated with reduced mid‐thigh muscle density,15 whereas strength training has been shown to improve this parameter in both young16 and old individuals.17 Whether similar adaptations occur in frail elderly has, to our knowledge, not been investigated. Moreover, whether altered muscle density following strength training represents changes in intramyocellular lipids (IMCLs), as suggested previously,17 remains to be elucidated. Combining analyses of muscle density by CT and analyses of IMCL content by Oil Red O (ORO) staining may clarify this issue.
Single‐fibre specific tension has been shown to improve following strength training in older adults in some,18, 19 but not all,20, 21 investigations. However, the effect of strength training on single‐fibre specific tension has not been investigated in frail elderly, in whom training‐induced improvements in specific strength appear to be substantial.9 Another interesting observation is that single‐fibre power normalized to fibre volume appears to be negatively affected by IMCL content,22 and it has been shown that IMCL content is reduced immediately following a session of heavy‐load strength training in young men.23 Whether long‐term strength training affects lipid content in frail elderly, and if this relates to improvements in single‐fibre specific tension, remains to be investigated.
Hence, the objective of this study was to examine the effects of 10 weeks of heavy‐load strength training on voluntary muscle activation, muscle area, and muscle density in frail elderly individuals and to assess their relative contribution to improvements in muscle strength. In addition, the aim was to explore if changes in muscle density were associated with changes in skeletal muscle lipid content and single‐fibre specific tension. On the basis of previous observations of substantial improvements in both absolute and specific strength in this population, we hypothesized that strength training would elicit improvements in activation level, muscle area, and muscle density. Besides, we hypothesized that the improvements in muscle density would be related to changes in skeletal muscle lipid content and single‐fibre specific tension.
Materials and methods
Thirty‐four frail elderly men and women aged between 67 and 98 [86 ± 7 years; mean ± standard deviation (SD)] were recruited from nursing homes or day‐care facilities for elderly and gave their written informed consent to participate in this experiment. The study was approved by the Regional Ethics Committee for Medical and Health Research of South‐East Norway (2016/895/REK sør‐øst C) and performed in accordance with the Declaration of Helsinki. The trial was registered at clinicaltrials.gov as NCT03326648.
Inclusion and allocation
Subjects fulfilling three of the five Fried frailty criteria (FFCs) were included.24 In addition, subjects fulfilling two FFCs among ‘slowness’, ‘weakness’, and ‘low activity level’ were included. Furthermore, individuals with a score of ≤6/12 on the Short Physical Performance Battery (SPPB) were included, regardless of categorization based on the FFCs. The SPPB consists of timed standing balance, gait speed, and timed chair‐rise assessment.25 After baseline measurements, stratified randomization was performed based on knee extensor strength (normalized to body weight) and preferred walking speed. Participants were randomly assigned to either a group performing heavy‐load strength training two times per week for 10 weeks (ST, n = 19) or a control group (CON, n = 15) in a 4:3 allocation ratio, owing to the expected higher dropout rate in ST. Moreover, seven subjects initially part of the control group agreed to participate to the training programme after the first intervention period. After 10 weeks of training, five of these subjects were re‐tested and are thus included in both ST and CON (Figure 1 ). Subject characteristics at baseline are presented in Table 1.
Figure 1.
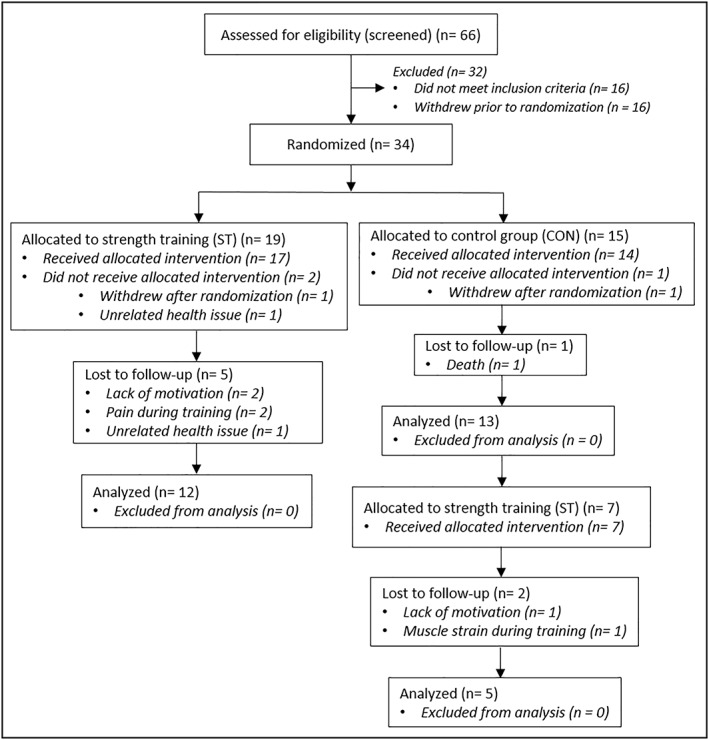
Participant flow diagram. The number of subjects included in the analyses varied for the different tests, and the numbers above holds true only for body composition and 1RM strength testing. 1RM, one‐repetition maximum; CON, control group; ST, strength training group.
Table 1.
Subject characteristics at baseline in the strength training and control groups
| Characteristics | ST | CON | P‐value |
|---|---|---|---|
| n (men/women) | (13/13) | (8/7) | |
| Age (years) | 86.6 ± 6.9 | 84.5 ± 7.2 | 0.341 |
| Body mass (kg) | 66.4 ± 12.5 | 74.3 ± 13.7 | 0.071 |
| Lean body mass (kg) | 42.6 ± 7.3 | 44.6 ± 9.5 | 0.469 |
| Leg lean mass (kg) | 14.2 ± 2.8 | 15.5 ± 4.1 | 0.245 |
| Body fat (%) | 33.2 ± 7.6 | 38.0 ± 5.9 | 0.042* |
| Body mass index (kg/m2) | 24.3 ± 3.7 | 26.8 ± 3.3 | 0.039* |
| Unilateral KE 1RM (kg) | 19 ± 8 | 23 ± 11 | 0.236 |
| Five times chair rise (s) | 20 ± 20 | 19 ± 20 | 0.824 |
| Habitual gait velocity (m/s) | 0.70 ± 0.25 | 0.76 ± 0.26 | 0.499 |
| SPPB score | 5.8 ± 2.9 | 5.7 ± 3.0 | 0.881 |
Data are presented as mean ± SD.
1RM, one‐repetition maximum; CON, control group; KE, knee extension; SPPB, Short Physical Performance Battery; ST, strength training group.
Significantly different between groups.
Training
The training protocol consisted in progressive resistance training, performed two times per week for 10 weeks. Experienced training instructors supervised all sessions. The exercise programme included leg press and knee extension, and participants performed two to three sets of 12 repetitions at submaximal loads the first week, and from Weeks 2 to 10, subjects gradually progressed from three sets of 12 repetitions maximum to four sets of 6RM. Repetition maximum (RM) refers to the highest load that can be lifted for a defined number of repetitions. As an example, 6RM refers to a load that can be lifted maximally six times. Hence, from Weeks 2 to 10, all training sets were performed until failure. This way of adjusting training loads represents an alternative to the most common way, using per cent of one‐RM (1RM). Each exercise set was followed by ~2 min rest periods. Training sessions were preceded by a low‐intensity 3 min warm‐up exercise, using a step platform.
Supplementation
Participants in both groups received one dietary supplement each day throughout the intervention period, containing 17 g of milk protein, 18 g of carbohydrate, and 1 g of fat [149 kcal (627 kJ)]. The supplement was consumed in the evening, expect on training days (ST), when the supplement was consumed within 2 h after training. Participants were encouraged to continue their habitual diet in addition to the supplements. Supplements were provided to avoid a very low protein intake in some participants, based on evidence that protein intake is highly variable in this population.26
Tests and measurements
All tests were monitored by the same investigator before and after the intervention period. Analyses of CT images and muscle biopsies were performed in a blinded manner. Muscle strength, activation level, and functional capacity was tested on two occasions before the intervention, and on one occasion after the intervention.
Assessment of body composition
Body composition was assessed by dual‐energy X‐ray absorptiometry (Lunar iDXA GE Healthcare, Madison, Wisconsin, USA). Participants were scanned from head to toe in a supine position, providing values for total lean tissue and fat mass. In addition, regional analyses were performed to measure leg lean mass. The coefficient of variation for the assessment of leg lean mass is low in our lab (<1.7%).
Assessment of the quadriceps femoris area and composition
Computed tomography scans (8 mm thick) were obtained from both legs at 50% of the distance between the knee joint and the greater trochanter (Toshiba Aquilion Prime 80, Canon Medical Systems, Otawara, Japan). Analyses of the quadriceps femoris muscle cross‐sectional area and composition were performed in a blinded manner using Fiji software (ImageJ, US National Institutes of Health, Maryland, USA). According to previously defined ranges,27 regions of interest (ROIs) were automatically defined to quantify the cross‐sectional areas (CSAs) of total muscle (0 to 100 HU), low‐density muscle (LDM) (0 to 30 HU), normal‐density muscle (NDM) (31 to 100 HU), and adipose tissue (−190 to −30 HU). Pixels between these ranges (−29 to 0 HU) are considered to reflect a mix of adipose tissue and muscle13 and constituted a small area in all subjects (~1–2 cm2). This area was excluded from the analyses. Total muscle density was measured as the mean attenuation value within the range of 0 to 100 HU in the quadriceps femoris.
Assessment of dynamic strength
After a general warm‐up (5 min bicycling), maximal strength was assessed by 1RM in knee extension in a custom‐made apparatus (Gym2000, Geithus, Norway). The participants were securely strapped to the testing chair with a belt fixing the hips, and a specific warm‐up procedure was performed using loads corresponding to 50%, 70%, 80%, and 90% of expected 1RM, conducting 10, 6, 3, and 1 repetitions, respectively. Optimally, two to five attempts were needed to establish 1RM. The loads could be adjusted in steps as low as 0.25 kg. The left and right leg was tested interchangeably (unilateral), and each leg rested for 3 min between attempts. The pre‐intervention test with the best result was used in the analysis. Knee extension 1RM was normalized to the quadriceps femoris muscle CSA (0 to 100 HU), to obtain a measure of dynamic specific strength.
Assessment of maximal isometric strength and muscle activation level
Maximal isometric strength was assessed using a Humac NORM dynamometer (CSMi, Stoughton, MA, USA), and combined with the interpolated twitch technique to evaluate voluntary muscle activation. Participants were seated in the testing chair with a four‐point belt fixing the chest and hips, with a knee joint angle of 70° (0° corresponding to full extension). Two percutaneous surface stimulation electrodes (Veinoplus, Ad Rem Technology, 8 × 13 cm, Paris, France) were placed over the distal and proximal parts of the quadriceps muscle belly. After an isokinetic and isometric warm‐up procedure, the muscle was stimulated in a resting state to identify the intensity necessary to elicit peak torque. Stimulation intensity was gradually increased until no further increase in twitch torque was observed (intensity test). Next, subjects were instructed to contract as forcefully as possible and to maintain maximal force exertion for 3–4 s, to assess isometric maximal voluntary contraction (MVC) torque. Following a 3 min break, subjects performed a second MVC to assess activation capacity. To this end, paired (doublet) stimuli were evoked (10‐ms interval) when the plateau of maximal torque was reached. In addition, a doublet was delivered ~2 s after the end of the voluntary contraction, when the muscle was still potentiated. Two more MVC trials were performed, either with or without stimulation, interspersed by 3 min breaks. Voluntary muscle activation was calculated using the equation: activation (%) = 100 − {[D * (T Stim/T MVC)/T StimRest] * 100}, where D is the difference between torque at stimulation (T Stim) and total torque (voluntary + electrically evoked force response), T MVC is the highest voluntary torque, and T StimRest is torque achieved owing to stimulation in the rested muscle. The trial with the highest level of voluntary muscle activation was used in the analysis of activation level, whereas peak torque was used for MVC results. Knee extension MVC was normalized to the quadriceps femoris muscle CSA (0 to 100 HU), to obtain a measure of isometric specific strength.
Assessment of functional performance
Five times chair rise
Participants were asked to rise from a chair to a full stand five times as fast as possible. Subjects were instructed to keep their hands crossed on their chest. If subjects were not able to stand up without using their hands, limited use of hands was allowed and performed the same way at both registration time points. Time was measured using a stopwatch. The best time of two trials was used in the analysis.
Gait velocity
Participants were instructed to walk 10 m at their habitual gait velocity. Photo cells (Brower Timing Systems, Draper, USA) were placed to measure the time from 2 to 8 m. The mean time of three trials was used in the analyses. Following measurement of habitual gait velocity, subjects were instructed to walk as fast as possible. The best time of three trials was used in the analyses, to provide a measure of maximal gait velocity. Walkers, canes, or walking poles were allowed only if subjects did not feel safe walking without these devices. For these subjects, the same aids were used at both registration time points.
Biopsy protocol
Subjects refrained from strenuous physical activity for 3 days before testing. On the day of the biopsy procedure, subjects arrived at the laboratory by car or public transportation after an overnight fast and received a standardized breakfast containing oatmeal, water, sugar, and butter (20 kJ and 0.09 g of protein per kg body mass). One hour following the breakfast, a percutaneous needle biopsy was obtained from the vastus lateralis muscle from the left leg. The procedure was conducted under local anaesthesia (xylocaine with adrenaline, 10 mg/mL of lidocaine + 5 μg/mL of adrenaline, AstraZeneca, London, UK), and ~200 mg (2–3 × 50–150 mg) of muscle tissue was obtained using a modified Bergström technique with suction.28 Samples intended for immunohistochemical analyses were embedded in OCT (Cellpath OCT embedding matrix, Newtown, UK) before being frozen in isopentane cooled down on liquid nitrogen. The samples were stored at −80°C for later analyses. The samples intended for single‐fibre measurements were put in a tube containing skinning solution (K propionate 150 mM, Mg acetate 5 mM, Na ATP 5 mM, EGTA 5 mM, and KH2PO4 5 mM with protease inhibitors: E64 10 μM and leupeptine 40 μM) and stored at 4°C. The skinning solution was changed every 4 h for 24 h, before the sample was put in a tube containing 50% skinning solution and 50% glycerol. Samples were stored at −20°C until analysis (within 2 weeks).
Skeletal muscle lipid content
Samples for immunohistochemical analysis were cut at 8 and 10 μm thickness at −20°C using a cryostat (CM1860 UV, Leica Microsystems GmbH, Nussloch, Germany), mounted on microscope slides (SuperFrost Plus, Thermo Scientific), and air‐dried before being stored at −80°C. Sections intended for fibre‐type composition (8 μm thickness) were blocked in 1% bovine serum albumin in phosphate‐buffered saline (PBS) containing 0.05% Tween‐20 (PBS‐t) before overnight incubation at 4°C with primary antibodies against dystrophin (Ab15277, Abcam, Cambridge, UK; dil. 1:500) and myosin heavy chain I (BA‐D5, developed by Schiaffino, S., obtained by DSHB, Iowa, IA, USA; dil. 1:500) diluted in the blocking buffer. After incubation, sections were washed 3 × 10 min in the PBS‐t solution with gentle agitation, followed by incubation for 60 min at room temperature with appropriate secondary antibodies (Alexa Fluor 488, A11001, and Alexa Fluor 594, A11012, Invitrogen Molecular Probes, Carlsbad, CA, USA; dil. 1:200) diluted in the blocking buffer. Subsequently, sections were again washed 3 × 10 min before they were mounted with ProLong Gold Antifade Reagent (P36935, Invitrogen Molecular Probes) and covered with a coverslip. Sections were left to dry overnight at room temperature before being viewed and imaged under the microscope (Figure 2 A).
Figure 2.
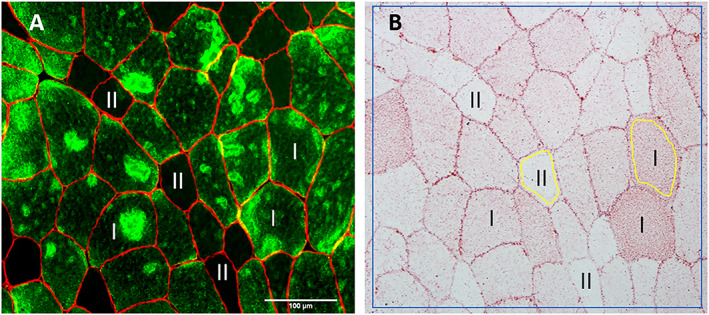
Antibody against myosin heavy chain I was used to differentiate between type I (green) and type II fibres (black, non‐stained) (A). A neighbour section was stained with oil red O (B). Region of interest (ROI) within each fibre was set to include close to the whole fibre area excluding the cell membrane (area within yellow lines). In addition, total staining intensity was measured for the whole area, including staining within and between fibres (area within blue line).
Sections intended for IMCL analyses (10 μm thickness) were stained as described by Mehlem and co‐workers.29 Briefly, sections were incubated for 10 min in an ORO solution followed by washing of excess solution in running tap water for 30 min. Sections were then mounted with Aquatex mounting agent (108562, Merck, Darmstadt, Germany) and covered with a coverslip. Sections stained with ORO were imaged within 24 h after staining. All muscle sections were visualized and micrographed using a high‐resolution camera (DP72, Olympus Corp., Tokyo Japan) mounted on a light microscope (BX61, Olympus Corp.). Sections intended for fibre‐type distribution were visualized with a fluorescence light source (X‐Cite, 120PCQ, EXFO Photonic Solutions Inc., Mississauga, ON, Canada) and imaged though a 4× 0.13 numerical aperture (NA) air objective (UplanFL N, Olympus Corp., Tokyo, Japan). Sections stained with ORO were imaged through a 20× 0.55 NA air objective (UPlanFL N, Olympus Corp.) with all settings on the microscope and camera fixed and standardized for all samples. Eight‐bit images were analysed using FIJI30 for ORO staining intensity. Two separate analyses were performed. First, a representative area of the stained section (>50 fibres) were analysed, including staining within (IMCLs) and between [extramyocellular lipids (EMCLs)] fibres. This analysis is hereafter referred to as total staining intensity. Next, measurements of the staining within type I and type II fibres were performed. ROI within the fibres was set to include close to the whole fibre area excluding the cell membrane (Figure 2 B). At least 40 randomly selected muscle fibres per sample was included in this analysis and related to their respective fibre type using a neighbouring section.
Single‐fibre thickness and contractility
On the day of the experiment, a fragment of the biopsy sample stored in 50% skinning and 50% glycerol solution (refer to previous discussions) was transferred to a Petri dish containing skinning solution. After repeated washing to remove glycerol, single muscle fibre segments were dissected, and short segments (approximate length of 1 mm) were equipped with two aluminium clips. The segments were then transferred to the set‐up and mounted in a drop (70 μL) of relaxing solution between the force transducer (AME‐801 SensorOne, Sausalito, California) and the electromagnetic puller (SI, Heidelberg, Germany) equipped with a displacement transducer. The signals from the force and displacement transducers were fed and stored on a computer after A/D conversion (interface CED 1401 plus, Cambridge, UK). For data storage, recall, and analysis, the software Spike 2 (CED, Cambridge, UK) was used. The force transducer and the electromagnetic puller were placed on the stage of an inverted microscope (ZEISS, Axiovert 25), and their relative position could be finely adjusted with micromanipulators. A movable aluminium plate hosted three drops (70 μL of volume) of relaxing, pre‐activating, and activating solution, respectively. The drops were kept between two coverslips, with the upper one being connected to a movable arm. Under each solution drop, an opening through the aluminium plate made the fibre segment visible via the objective piece of the inverted microscope, which was connected with a digital camera (Optikam B5, OPTIKA) to collect images at 300× magnification. A stereomicroscope (Konus Diamond, KONUS) placed above the inverted microscope allowed a careful manipulation of the fibre segments. The composition of the solutions in millimolar was as follows: relaxing solution: KCl 100, imidazole 20, MgCl2 5, Na ATP 5, and EGTA 5; pre‐activating solution had a similar composition except that EGTA concentration was reduced to 0.5 mM, and 25 mM of creatine phosphate (CP) and 300 U/mL of creatine phosphokinase (CPK) were added; activating solution (pCa 4.6) was similar to relaxing solution with the addition of 5 mM of CaCl2, 25 mM of CP, and 300 U/mL of CPK. The pH of all solutions was set at 7.0 at the temperature at which experiments were performed (12°C). Protease inhibitors (E64 10 μM and leupeptine 40 μM) were added to all solutions.
For the functional test, fibre segments were transferred from the relaxing solution into the pre‐activating solution for at least 1 min and then maximally activated by immersion in the activating solution (pCa 4.6). During maximal activation, isometric force (Fo) was measured with a quick shortening–relengthening manoeuvre (duration 5 ms). The cycle activation–relaxation was repeated at least three times, and the average force value was used for further analysis. CSA was calculated from the measurements of three fibre diameters, assuming a circular shape of the fibre section. Furthermore, specific force Po = Fo · CSA−1 was also calculated. At the end of the functional experiment, the fibre segments were removed from the set‐up and immersed in 10 μL of Laemmli solution,31 for subsequent determination of the composition in MyHC isoforms. To this end, protein separation was performed on 8% polyacrylamide slab gels after denaturation in sodium dodecyl sulfate (SDS) (SDS–polyacrylamide gel electrophoresis) as described previously.32 Gels were silver stained, and three bands were separated in the region of 200 kDa, corresponding to MyHC‐1, MyHC‐2A, and MyHC‐2X, in order of migration from the fastest to the slowest.
A total of 413 muscle fibres were analysed from 22 baseline biopsies, corresponding to 18.8 (±3.4) fibres per biopsy. All fibres were analysed for CSA. However, force measurements could not be performed in 18 fibres (breakage), and force was therefore measured in 395 muscle fibres. After the intervention, 251 muscle fibres were analysed from 13 biopsies, corresponding to 19.3 (±2.3) fibres per biopsy. Twenty‐three fibres broke during force measurements, and thus force data were available for 228 muscle fibres.
Statistics
Statistical analyses were performed using GraphPad Prism 6 software (GraphPad Software, Inc., La Jolla, CA). Statistical significance was set at P < 0.05. Non‐normally distributed data (D'Agostino and Pearson omnibus normality test) were log‐transformed prior to statistical analysis. For single‐fibre variables, the Robust regression and Outlier removal (ROUT method) with Q set at 1% was used to detect and exclude outliers (individual muscle fibres). Between‐group differences at baseline were investigated using Student's t‐test. Fibre‐type specific differences at baseline were assessed with Student's t‐test (IMCL analyses) or one‐way analysis of variance (ANOVA) with Tukey's multiple comparisons test (single‐fibre measurements). A two‐way ANOVA with Bonferroni's multiple comparison test was used to evaluate the effect of time and group for variables measured both before and after the intervention period (absolute values). Associations between variables were investigated using Pearson's correlation coefficient. Correlations were considered weak if r < 0.4, moderate if r = 0.4–0.6, and strong if r > 0.6. With the use of an online calculator (clincalc.com), power calculations indicated that 32 participants would be needed to identify a difference of 10% between the ST and CON for specific strength (primary outcome), with an expected SD of 10% (α set at 0.05, β at 0.20). Data are presented as individual values and mean ± SD, if not otherwise stated, and all data are illustrated in original form (absolute values).
Results
Baseline characteristics of participants
Even though the groups were not significantly different in terms of age, muscle strength, or functional capacity, CON had a higher body fat percentage (P = 0.042) and body mass index (BMI) (P = 0.039) than ST (Table 1).
Adherence to the intervention
Eleven subjects did not complete the trial; thus, 13 subjects in CON and 17 subjects in ST (including five subjects initially in CON) completed and remained for the per‐protocol analyses (Figure 1 ). The dropouts in ST did not significantly differ from the completers for any of the variables measured. The completers in ST performed on average 18.9 (±1.1) training sessions in 10.5 (±0.5) weeks. Average training frequency was 1.8 (±0.1) sessions per week.
Adherence to testing
Body composition, muscle strength, and functional performance were tested in all completers. However, three subjects had previously suffered from a stroke (>5 years ago), and therefore, results for gait velocity were omitted. For other measurements, these subjects were included, and the unaffected limb was always tested. CSA, muscle density, and intermuscular adipose tissue (IMAT) were assessed in all but two completers (logistical challenges). Five completers were excluded from the assessment of muscle activation owing to pacemakers. In addition, the test was terminated for three subjects owing to discomfort, and the results for three subjects were omitted because of suboptimal measurements (e.g. due to joint pain). One of the completers was excluded from the muscle biopsy owing to anti‐coagulant medication that could not be discontinued. Another participant withdrew during the initiation of the muscle biopsy procedure owing to discomfort. In addition, we were not able to obtain a biopsy from four completers either at baseline or after the intervention owing to an excessive layer of subcutaneous fat and a very thin muscle belly. In four subjects, the histological sections were of low quality or showed evidence of freeze damage and were therefore excluded from the analysis of IMCL and EMCLs. Furthermore, measurements of single fibres were only performed in a subset of 22 baseline biopsies, of whom only 13 remained for the per‐protocol analysis. Owing to the aforementioned reasons, the number of subjects included for each variable differs and is specified for each test.
Correlations at baseline
For all tests, only the leg from which the biopsy was obtained was used in the analyses. Strong correlations were observed between the quadriceps femoris muscle CSA and both knee extension 1RM (r = 0.87, P < 0.001, n = 33) and MVC (r = 0.89, P < 0.001, n = 30) at baseline (Table 2). In addition, significant correlations were observed between voluntary activation level and both absolute and specific isometric strength. No other correlations were observed between specific strength and aspects of muscle quality (muscle density, IMCL, and single‐fibre specific tension). The quadriceps femoris muscle density (mean HU) showed significant correlations with absolute but not specific strength. Both absolute and specific strength showed moderate correlations with functional performance (gait velocity and five times chair rise). Moreover, correlations between muscle strength and functional performance were slightly stronger when strength was normalized to body mass (results not shown).
Table 2.
Correlations between knee extensor strength and various measures of muscle size, composition, and functional performance
| Measure | Absolute strength | Specific strength | ||
|---|---|---|---|---|
| KE 1RM (kg) | KE MVC (Nm) | KE 1RM/QF m. CSA | KE MVC/QF m. CSA | |
| QF muscle CSA (cm2) | 0.87* (33) | 0.89* (30) | — | — |
| QF muscle activation (%) | 0.34 (22) | 0.53* (22) | 0.22 (21) | 0.54* (21) |
| QF IMAT (cm2) | 0.03 (33) | −0.01 (30) | −0.04 (33) | −0.14 (30) |
| QF muscle density (mean HU) | 0.43* (33) | 0.40* (30) | 0.30 (33) | 0.19 (30) |
| VL total ORO staining intensity (AU) | 0.38 (24) | 0.39 (23) | 0.08 (24) | 0.08 (23) |
| VL single‐fibre specific tension (mN/mm2) | −0.09 (18) | −0.19 (17) | 0.07 (18) | 0.02 (17) |
| Habitual gait velocity (m/s) | 0.51* (30) | 0.38* (28) | 0.43* (29) | 0.19 (27) |
| Five times chair rise (s) | −0.39* (30) | −0.30 (28) | −0.47* (29) | −0.41* (27) |
Numbers in parentheses denote the number of XY pairs for the given correlation.
1RM, one‐repetition maximum; AU, arbitrary units; CSA, cross‐sectional area; HU, Hounsfield units; IMAT, intermuscular adipose tissue; KE, knee extension; m, muscle; MVC, isometric maximal voluntary contraction; ORO, Oil Red O; QF, quadriceps femoris; VL, vastus lateralis.
P < 0.05.
Effects of training on body composition (dual‐energy X‐ray absorptiometry)
There were no significant effects of the training programme on body mass, lean mass, or fat mass; and changes in leg lean mass showed only a tendency for a group × time interaction (P = 0.076) (Table 3).
Table 3.
Body composition, maximal strength, specific strength, and functional capacity before and after the 10 week intervention period in the strength training and control groups
| ST | CON | ANOVA P‐value | |||||
|---|---|---|---|---|---|---|---|
| Pre | Post | % change (n) | Pre | Post | % change (n) | ||
| Body mass (kg) | 68.3 ± 12.5 | 69.3 ± 13.0 | 1.3 ± 2.4 (17) | 74.2 ± 11.7 | 74.2 ± 11.6 | 0.2 ± 3.5 (13) | 0.273 |
| Lean mass (kg) | 43.4 ± 8.0 | 43.6 ± 8.0 | 0.6 ± 2.6 (17) | 44.3 ± 8.9 | 44.1 ± 9.0 | −0.5 ± 3.0 (13) | 0.287 |
| Leg lean mass (kg) | 14.6 ± 3.0 | 14.9 ± 3.1 | 2.3 ± 3.8 (17) | 15.3 ± 3.9 | 15.1 ± 3.7 | −0.1 ± 0.7 (13) | 0.076 |
| Fat mass (kg) | 22.7 ± 6.9 | 23.4 ± 7.0 | 3.2 ± 6.4 (17) | 27.6 ± 5.6 | 27.9 ± 5.4 | 1.5 ± 7.4 (13) | 0.514 |
| Knee extension 1RM (kg) | 20.2 ± 8.9 | 23.1 ± 9.1 | 17.4 ± 16.3*** (17) | 21.4 ± 8.9 | 21.9 ± 8.3 | 4.5 ± 13.5 (12) | 0.016 |
| Knee extension MVC (Nm) | 100.3 ± 30.8 | 106.5 ± 32.2 | 6.7 ± 9.2* (15) | 115.3 ± 34.0 | 114.9 ± 33.5 | 0.1 ± 5.5 (10) | 0.073 |
| Specific force (1RM/CSA) | 0.46 ± 0.15 | 0.49 ± 0.12 | 10.2 ± 15.7* (15) | 0.48 ± 0.14 | 0.50 ± 0.13 | 6.2 ± 1.3 (12) | 0.608 |
| Specific force (MVC/CSA) | 2.43 ± 0.55 | 2.39 ± 0.57 | −1.4 ± 9.1 (14) | 2.58 ± 0.19 | 2.62 ± 0.27 | 1.6 ± 6.5 (10) | 0.357 |
| Gait velocity—habitual (m/s) | 0.69 ± 0.24 | 0.75 ± 0.25 | 11.6 ± 27.2 (15) | 0.82 ± 0.25 | 0.74 ± 0.25 | −10.4 ± 9.8** (11) | 0.003 |
| Gait velocity—maximal (m/s) | 1.14 ± 0.49 | 1.21 ± 0.51 | 9.7 ± 27.8 (15) | 1.23 ± 0.41 | 1.13 ± 0.39 | −7.2 ± 8.2* (10) | 0.015 |
| Five times chair rise (s) | 19.6 ± 19.5 | 14.9 ± 8.8 | −12.5 ± 19.9* (15) | 13.0 ± 4.5 | 12.8 ± 3.9 | 1.0 ± 18.9 (12) | 0.080 |
Data are presented as mean ± SD. ANOVA P‐value show group × time interaction.
1RM, one‐repetition maximum; ANOVA, analysis of variance; CON, control group; CSA, cross‐sectional area; MVC, maximal voluntary contraction; n, number of subjects measured before and after the intervention; ST, strength training group.
P < 0.05.
P < 0.01.
P < 0.001 different from baseline within group.
Effects of training on maximal strength, specific strength, and functional capacity
Knee extension 1RM improved from baseline in ST (P < 0.001), and a group × time interaction was observed (P = 0.016; Table 3). In addition, isometric MVC improved from baseline in ST (P = 0.025), but the group × time interaction did not reach statistical significance (P = 0.073). No group × time interactions were observed for isometric specific strength (MVC/quadriceps femoris muscle CSA) or dynamic specific strength (KE 1RM/quadriceps femoris muscle CSA), although the latter improved from baseline in ST (P = 0.024). The change in five times chair rise showed only a tendency for a group × time interaction (P = 0.08), whereas significant interaction effects were observed for both habitual (P = 0.003) and maximal gait velocity (P = 0.015).
Effects of training on muscle activation
Muscle activation did not change from baseline in ST (from 89.7 ± 4.7% to 86.7 ± 5.7%, n = 10) or CON (from 87.9 ± 5.1% to 89.0 ± 6.1%, n = 9), and no group × time interaction was observed (Figure 3 ).
Figure 3.
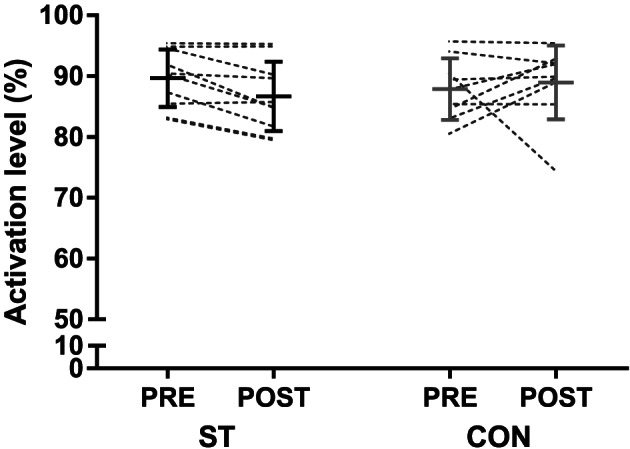
Voluntary activation level during an isometric knee extension maximal voluntary contraction (MVC), before and after the 10 week intervention period in the strength training (ST) and control groups (CON). The figure displays individual values, as well as mean ± SD before and after the intervention.
Effects of training on muscle cross‐sectional area, muscle attenuation, and intermuscular adipose tissue
There was a significant group × time interaction between ST (6.8 ± 7.4%, n = 15) and CON (−1.2 ± 5.1%, n = 13) for the change in the quadriceps femoris muscle CSA (P = 0.002) (Figure 4 A). The increase in muscle CSA in ST was exclusively attributable to an increase in NDM area (10.1 ± 9.0%), which did not change in CON (−1.5 ± 4.9%) (group × time interaction, P < 0.001) (Figure 4 B). LDM area did not change in either ST (−1.4 ± 17.1%) or CON (−1.5 ± 10.2%) (Figure 4 C). The area of IMAT in the quadriceps femoris was small at baseline (ST: 1.3 ± 1.1 cm2, CON: 1.6 ± 0.9 cm2) and did not change in ST (15 ± 46%) or CON (3 ± 17%). A group × time interaction was observed for muscle density (measured as mean HU), with changes of 3.6 ± 4.3% and −0.5 ± 2.2%, in ST and CON, respectively (P < 0.001; Figure 4 D). The increase in total muscle density in ST resulted from both an increased proportion of NDM area to total muscle area (from 81 ± 10% to 84 ± 8%, P = 0.024) and an increased density within the NDM area (2.3 ± 2.3%, P = 0.002). Representative pre‐images and post‐images of a subject in the training group are provided in Figure 5 .
Figure 4.
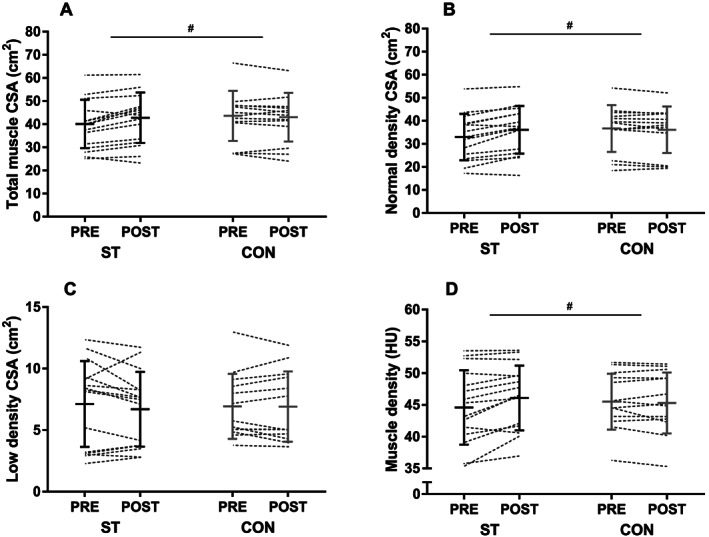
Quadriceps femoris total muscle cross‐sectional area (A), normal‐density muscle area (B), low‐density muscle area (C), and muscle density expressed as mean Hounsfield units (HU) (D) before and after the intervention in the strength training (ST) and control groups (CON). The figure displays individual values, as well as mean ± SD before and after the intervention. #P < 0.05 (group × time interaction).
Figure 5.
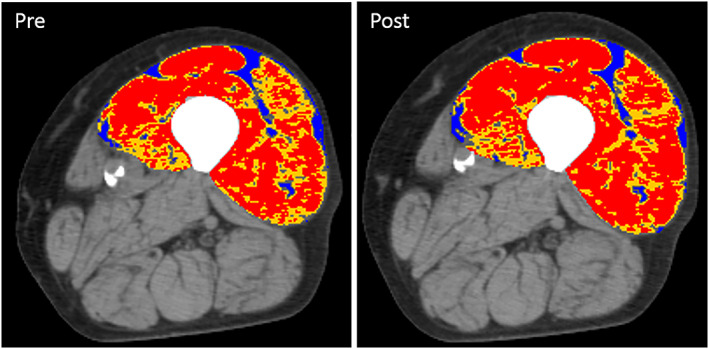
Computed tomography (CT) images of the left thigh of a male subject (88 years) before (pre) and after (post) 10 weeks of heavy‐load strength training. Analysis of quadriceps femoris display normal‐density muscle (red, 31–100 HU), low‐density muscle (yellow, 0–30 HU), and intermuscular adipose tissue (blue, −190 to −30 HU). An increase in area was only observed for normal‐density muscle (red). For this subject, the increased area of normal‐density muscle (red) is easiest to spot on the right side of the image (m. vastus lateralis).
Effects of training on intramyocellular and extramyocellular lipids
Total ORO staining intensity at baseline, thought to reflect both IMCL and EMCL, showed correlations with BMI (r = 0.75, P = 0.001, n = 24) and body fat percentage (r = 0.51, P = 0.011, n = 24). However, total staining intensity was not correlated with the quadriceps femoris muscle density (r = 0.01, P = 0.95, n = 24) or IMAT (r = 0.32, P = 0.13, n = 24) assessed by CT. Total staining intensity did not change in ST (from 49.6 ± 7.8 to 51.3 ± 10.2 AU, n = 12) or CON (from 51.0 ± 5.8 to 49.8 ± 8.3 AU, n = 8) following the intervention (group × time interaction, P = 0.378; Figure 6 ).
Figure 6.
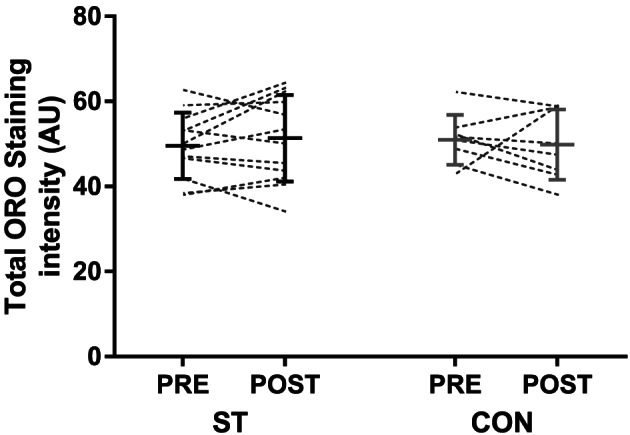
Total oil red O (ORO) staining intensity before and after the 10 week intervention period in the strength training (ST) and control groups (CON). An area including at least 50 fibres were analysed per biopsy, including staining within fibres (IMCL) and between (EMCL) fibres. The figure displays individual values, as well as mean ± SD before and after the intervention. EMCL, extramyocellular lipid; IMCL, intramyocellular lipid.
The ORO staining intensity within the cell membrane of type I fibres, considered to reflect IMCL content, did not change in ST (from 49.6 ± 9.2 to 52.0 ± 11.1 AU, n = 12) or CON (49.8 ± 5.1 to 48.2 ± 9.9 AU, n = 8) (group × time interaction, P = 0.447). Moreover, no group × time interaction was observed for staining within type II fibres, with no changes in ST (from 43.8 ± 5.2 to 45.9 ± 9.3 AU, n = 12) or CON (from 47.8 ± 6.9 to 44.5 ± 8.0 AU, n = 8) (group × time interaction, P = 0.143). At baseline, IMCL content was higher in type I compared with type II fibres (P = 0.026).
Effects of training on single‐fibre properties
To investigate differences between fibre types at baseline, all fibres from 22 baseline biopsies were pooled (Table 4). Type IIA and IIX fibres were 15% (P = 0.082) and 33% (P = 0.012) smaller than type I fibres. No differences between fibre types were observed for maximum force, but owing to the differences in size, specific tension was 44% (P = 0.001) higher in IIX fibres, compared with type I fibres. The difference of 17% between type I and IIA fibres did not reach statistical significance (P = 0.108). An inverse correlation was observed between single‐fibre specific tension and IMCL content in type I (r = −0.53, P = 0.044, n = 15), but not for type II fibres (r = −0.09, P = 0.75, n = 16).
Table 4.
Single‐fibre measurements for all baseline biopsies
| Fibre type | ANOVA P‐value | |||||
|---|---|---|---|---|---|---|
| I | I–IIA | IIA | IIA–IIX | IIX | ||
| Fibres (n) | 164 | 31 | 104 | 49 | 25 | — |
| Fibres (%) | 44 | 8 | 28 | 13 | 7 | — |
| fCSA (μm2) | 5220 ± 2942 | 4354 ± 1725 | 4429 ± 2035 | 4577 ± 2281 | 3501 ± 1804 * | 0.003 |
| Force (mN) | 0.42 ± 0.26 | 0.43 ± 0.21 | 0.45 ± 0.27 | 0.38 ± 0.18 | 0.44 ± 0.23 | 0.627 |
| Force/CSA (mN/mm2) | 89 ± 45 | 103 ± 43 | 104 ± 59 | 95 ± 44 | 128 ± 54 * | 0.002 |
Data are presented as mean ± SD.
ANOVA, analysis of variance; fCSA, fibre cross‐sectional area.
P < 0.05 different from type I fibres.
Owing to the low number of hybrid fibres and pure IIX fibres, two separate analyses were performed to investigate intervention effects. First, all fibres from each subject were pooled, regardless of fibre type. Fibre CSA did not change in ST (4310 ± 861 to 4809 ± 861 μm2, n = 8) or CON (5346 ± 2068 to 4807 ± 1550 μm2, n = 5) (group × time interaction: P = 0.38), but the change in ST tended to correlate with the change in the quadriceps femoris muscle CSA measured by CT (r = 0.79, P = 0.059, n = 6). No group × time interaction was observed for single‐fibre maximal isometric force (ST: 0.36 ± 0.16 to 0.50 ± 0.41 mN, CON: 0.51 ± 0.20 to 0.48 ± 0.15 mN, P = 0.43). Moreover, specific tension, defined as maximal isometric force normalized to fibre area, did not change in ST (85 ± 30 to 99 ± 30 mN/mm2, n = 8) or CON (101 ± 8 to 100 ± 14 mN/mm2, n = 5) (group × time interaction: P = 0.51) (Figure 7 ).
Figure 7.
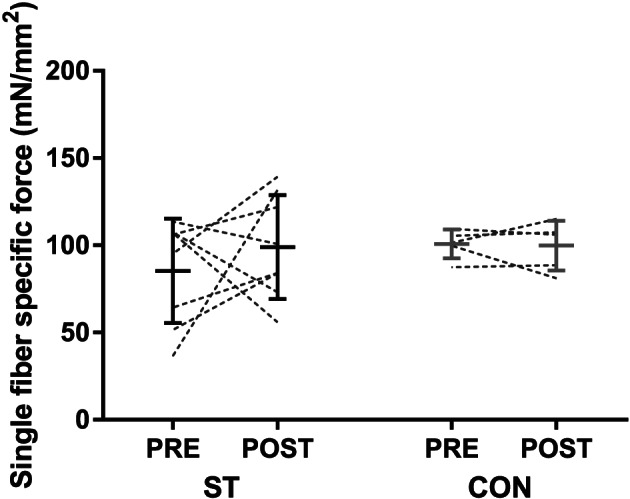
Single‐fibre specific tension (maximal isometric tension normalized to fibre cross‐sectional area) before and after the 10 week intervention period in the strength training (ST) and control groups (CON). All fibres from each biopsy are included, regardless of myosin heavy chain expression. The figure displays individual values, as well as mean ± SD before and after the intervention.
Subsequently, type I fibres were analysed separately, whereas IIA, hybrid IIA–X, and IIX fibres were pooled and analysed separately. Regardless of categorization, no interaction effects were observed for fibre area, maximal isometric tension, or single‐fibre specific force (results not shown).
Correlations in the training group
Weekly training frequency in ST (range: 1.6–2.0) was correlated with the change in the quadriceps femoris muscle CSA (r = 0.55, P = 0.032, n = 15). However, the change in muscle CSA did not correlate with changes in 1RM (r = 0.26, P = 0.35, n = 15) or MVC (r = 0.26, P = 0.41, n = 14), and no correlations were observed between changes in muscle strength and changes in functional performance. Moreover, no significant correlations were observed between changes in isometric specific strength and changes in activation level (r = 0.34, P = 0.33, n = 10), muscle density (r = 0.43, P = 0.13, n = 14), IMAT (r = 0.30, P = 0.30, n = 14), total ORO staining intensity (r = −0.24, P = 0.51, n = 10), or single‐fibre specific tension (r = 0.04, P = 0.95, n = 5).
Discussion
The 10 week training intervention was successful in eliciting improvements in muscle strength and functional capacity in frail elderly individuals. Increases in strength were not due to improved activation level or single‐fibre specific force. Instead, strength gains were accompanied by increases in both muscle area and density.
Effect of strength training on muscle activation
A correlation between activation level and specific strength was observed at baseline, suggesting that some of the between‐subject variation in specific strength was indeed due to differences in voluntary activation level. However, activation level did not change following the 10 week training intervention. Based on the findings by Venturelli and colleagues, observing an activation level of the quadriceps femoris of 95%, 85%, and 78%, in young, very old active, and very old wheelchair‐bound individuals,33 respectively, we hypothesized that our subjects would have a low activation level at baseline and that strength training would elicit marked improvements. Indeed, Hvid and colleagues12 observed an improvement in activation level from 79% to 85% following 12 weeks of power training performed twice weekly in pre‐frail elderly.12 The discrepancy between the findings of the latter study and the present one could be related to the type of training. Although a training load of 70–80% of 1RM was utilized in both studies, the concentric phase of the exercises was performed as rapidly as possible in Hvid et al. (2016). A more likely explanation is, however, that our subjects displayed a much higher activation level at baseline (89%), suggesting a lower probability for this variable to improve with training.34 The reason for the difference at baseline is difficult to unravel, but pain is known to affect voluntary muscle activation.35 In the present study, one subject experienced knee pain during the contraction and was excluded from the results (activation level of 62%). Whether some of the subjects in the previous studies experienced pain during the test,12, 36 and whether this could explain the very low activation level observed in some participants (50–70%), is not known. It is also possible that the difference at baseline is related to methodological differences, such as equipment utilized and degree of familiarization.
Effect of strength training on muscle composition
The hypertrophy observed in the quadriceps femoris of the training group was exclusively due to an increased area of NDM, whereas LDM area did not change. The increase in muscle density was both due to the increased proportion of NDM and due to increased attenuation within the NDM area. The area of IMAT in the quadriceps femoris was small at baseline (~1.5 cm2) and did not change following training. Aging is associated with reduced mid‐thigh muscle density and has a negative impact on specific strength.15 On a CT scan, larger depots of adipose tissue are categorized as IMAT and are thus excluded from the calculation of muscle density. Hence, lower muscle density values are considered to reflect mainly increased levels of IMCLs.37 In support of this, Goodpaster and colleagues observed an inverse relationship between mid‐thigh muscle density and vastus lateralis IMCL content in young individuals.13 Additionally, it is possible that smaller depots of EMCLs between individual muscle fibres contribute to reduced muscle density, because the resolution of CT may not be good enough to categorize these areas as IMAT.13 Surprisingly, no correlation between muscle density and IMCL content was observed in the present study, for neither type I nor type II fibres. Between‐subject variation in muscle density was neither explained by total ORO staining intensity, reflecting both IMCL and EMCL. These findings suggest that the between‐subject variation in muscle density at baseline was not due to differences in skeletal muscle lipid content.
It has been demonstrated previously that detraining results in decreased muscle density, whereas retraining improves this parameter in healthy elderly men and women.17 Muscle biopsies were not obtained in the latter study, but the authors speculate that the changes in muscle density could reflect changes in lipid content. In the present study, increased muscle density was observed in the absence of changes in ORO staining intensity, and our results therefore suggest that the training‐induced increase in muscle density was not related to changes in lipid content. Previously, changes in myosin content have been observed in response to disuse and retraining in elderly individuals.38 Such an adaptation could potentially explain the increase in muscle density in our training group. However, in the study by Hvid and colleagues (2017), increased myosin content was associated with increased single‐fibre specific tension, which was not seen in the present study. Moreover, Claassen and colleagues did not observe changes in myofilament spacing, despite of a 4.8% increase in muscle density following strength training in young individuals.39 Another potential explanation for the increase in muscle density is that increases in fibre size may occur at the expense of extracellular spaces, both between muscle fibres and fascicles. Nevertheless, if either of the above adaptations occurred in the present study, one would expect improvements in isometric strength to exceed increases in muscle area, which was not the case.
It is important to acknowledge that increased muscle density does not necessarily require qualitative changes at the single‐fibre level or changes in lipid content per se. In the boundary between muscle tissue and IMAT, it might be that some pixels are categorized as LDM if the pixels contain most muscle, but also a small portion of adipose tissue. In support of this, we did observe a positive correlation between IMAT and LDM area (r = 0.46, P = 0.007) at baseline. Along this line, muscle density would be expected to increase following muscle hypertrophy, even in the absence of changes in IMAT, EMCL, and IMCL, because the proportion of muscle ‘not in contact’ with IMAT would increase. Nevertheless, muscle density increased also within the NDM area. Because NDM is considered to exclude depots of EMCLs, the above explanation cannot alone explain the training‐induced increase in muscle density.
Effect of strength training on single‐fibre function
To the best of our knowledge, this is the first study to investigate the effect of strength training on single‐fibre specific tension in frail elderly individuals. Contrary to our hypothesis, no training effects were observed. It is difficult to unravel why some studies observe training‐induced improvements in specific tension in older adults18, 19, 40 whereas others do not.21, 41, 42, 43 However, an interesting notion is that two of the interventions eliciting improvements were of relatively long duration (5 and 12 months),18, 19 suggesting that the 10 week intervention employed in the present study might have been of insufficient duration. Moreover, the subjects in the study by Wang and colleagues18 were overweight/obese, and the authors reported that increased specific tension of type I fibres correlated with reductions thigh intermuscular fat volume assessed by CT. The latter study, along with the observation of an inverse correlation between IMCL content and single‐fibre specific power in obese elderly,22 indicates that the potential for improvements in specific tension might be greater in individuals with higher IMCL content. In the present study, an inverse relationship was indeed observed at baseline between single‐fibre specific tension and ORO staining intensity in type I, but not type II fibres. Collectively, these findings imply that IMCLs do have a negative impact single‐fibre specific tension. Still, based on the present investigation, it seems that neither IMCL content nor single‐fibre specific tension change following 10 weeks of heavy‐load strength training in frail elderly.
It should be kept in mind that our muscle biopsy analyses are subject to some limitations. First, the low number of subjects with both pre‐measurements and post‐measurements for single‐fibre function (ST = 8, CON = 5) increases the risk of statistical type II errors. Second, a recurring challenge with analyses on human muscle biopsies is to which extent a single biopsy is representative of the whole muscle. This point might be even more applicable in very old and frail individuals, because aging and frailty seem to increase the variation between different areas in the muscle, owing to denervation and fibre‐type grouping.44, 45 The large variation we observed for single‐fibre specific tension could be related to this phenomenon. Nevertheless, we did observe a non‐significant correlation between the change in CSA assessed by CT, and change in single‐fibre area (r = 0.79, P = 0.059, n = 6), suggesting that the 20 or so fibres chosen for analysis per biopsy at least were partly representative of changes in muscle size.
Effect of strength training on muscle function
The improvements in muscle strength of 7% (MVC) and 17% (1RM) in the training group were lower than expected. Recently, improvements of 13% (MVC) and 91% (1RM) were observed in a similar group of individuals (age: 83–94) after 12 weeks of heavy‐load strength training.7 Discrepancies could relate to the difference in training frequency (2 vs. 3 sessions/week) and total duration (10 vs. 12 weeks). Regardless, the 7% increase we observed in the quadriceps femoris muscle area is comparable with,9, 36 or even on the high end,6, 7, 46 that of previous reports in similar populations. In most previous and similar studies, the change in both isometric and dynamic muscle strength exceeded the improvements in muscle size,7, 9, 36, 47 suggesting that factors other than increases in muscle mass contribute to the improvements in muscle strength. However, our findings suggest that the degree of muscle hypertrophy corresponds well with the improvement in isometric strength. Nevertheless, dynamic specific strength (1RM/CSA) improved from baseline in the training group (10%). This increase could not be explained by changes in IMCL/EMCL content or single‐fibre specific tension. Although activation level was not improved in isometric MVC, a more optimal recruitment strategy cannot be excluded as a contributing factor for the improvements in knee extension 1RM. Another potential explanation is training‐induced changes in muscle fascicle length,4 possibly resulting in a more optimal overlap of actin and myosin filaments at ‘sticking point’ (the position in the range of motion where the weight is experienced heaviest, and where 1RM tests typically fail).
Strengths and limitations
Few previous studies have investigated the effects of heavy‐load strength training in frail elderly, and in a majority of the earlier investigations, the end points have been limited to measures of muscle size, strength, and functional capacity. Obtaining muscle biopsies is very rarely done in this population. Thus, our study provides novel data on how lipid content and the properties of single muscle fibres respond to strength training in frail elderly. The combined use of dual‐energy X‐ray absorptiometry (DXA) and CT to assess changes in muscle mass adds to recent discussions on the feasibility of these methods48, 49, 50 by showing that DXA may not be sensitive enough to detect small changes in muscle area. Leg lean mass assessed by DXA only tended to increase, whereas the CT measurement showed a highly significant 7% increase in muscle area. There are also some limitations to our study. Even though this study was initially designed as a randomized controlled trial, we were forced to abandon this design in order to increase the statistical power. Furthermore, owing to several dropouts in combination with some analytical challenges, the results for some variables still represent a quite low number of subjects, increasing the risk of statistical type II errors. The authors also acknowledge that muscle quality encompasses several aspects not investigated in this study, such as muscle architecture, fibrosis, cell membrane integrity, and function of excitation–contraction coupling.51, 52
Conclusions
The purpose of the present study was to investigate how different aspects of specific strength change in response to heavy‐load strength training in frail elderly individuals. Specifically, we aimed to investigate if the often‐observed mismatch between gains in muscle strength and size was due to changes in muscle activation, muscle density, lipid content, and single‐fibre specific tension. In contrast to our hypothesis, the improvements in isometric strength corresponded well with the increase in the quadriceps femoris muscle CSA, suggesting that the increase in strength was mainly due to increased muscle quantity, not quality. Nevertheless, the increase in muscle density indicates that also qualitative adaptation may have occurred. The increase in muscle density did not reflect changes in IMCL content and may instead reflect increased packing of contractile material, or simply an increased ratio of muscle tissue relative to IMAT.
Funding
The study was funded by the Norwegian School of Sport Sciences.
Conflict of Interest
S.N.A., M.B., S.K., O.J.A., S.H.R., K.T.C., C.R., O.S., A.P.R., L.T., and T.R. declare that they have no conflict of interest regarding the publication of this article.
Authors' Contributions
S. N. A., O. S., and T. R. contributed to the conception and design of the research. S. N. A., M. B., S. K., O. J. A., and S. H. R. performed testing and training of subjects. CT scans were obtained at a radiography facility, supervised by S. N. A. and M. B. Muscle biopsies were obtained by T. R. Fibre‐type analyses on histological sections were performed by S. K., S. H. R., and K. T. C, and ORO analyses by K. T. C. and O. J. A. Single‐fibre measurements were performed by C. R. and L. T., whereas M. B., O. S., and A. P. R. analysed the CT scans. S. N. A. prepared the figures and drafted the manuscript. All authors edited and revised the manuscript and approved its final version.
Acknowledgements
The authors gratefully appreciate the contributions of the participants. The authors would also like to thank Jan Fredrik Baevre for assisting in the training of participants and Carlo Capelli for his invaluable help with transportation of muscle samples to University of Padua. In addition, the help from Hege Nymo Østgaard, Ingrid Ugelstad, Cecilie Michaelsen, Anneli Kringstad, and Carina Nymoen during test days is very much appreciated. The authors of this manuscript certify that they comply with the ethical guidelines for authorship and publishing in the Journal of Cachexia, Sarcopenia and Muscle.53
Aas S. N., Breit M., Karsrud S., Aase O. J., Rognlien S. H., Cumming K. T., Reggiani C., Seynnes O., Rossi A. P., Toniolo L., and Raastad T. (2020) Musculoskeletal adaptations to strength training in frail elderly: a matter of quantity or quality?, Journal of Cachexia, Sarcopenia and Muscle, 11, 663–677. 10.1002/jcsm.12543.
References
- 1. Peterson MD, Sen A, Gordon PM. Influence of resistance exercise on lean body mass in aging adults: a meta‐analysis. Med Sci Sports Exerc 2011;43:249–258. [DOI] [PMC free article] [PubMed] [Google Scholar]
- 2. Peterson MD, Rhea MR, Sen A, Gordon PM. Resistance exercise for muscular strength in older adults: a meta‐analysis. Ageing Res Rev 2010;9:226–237. [DOI] [PMC free article] [PubMed] [Google Scholar]
- 3. Hortobagyi T, Lesinski M, Gabler M, Van Swearingen JM, Malatesta D, Granacher U. Effects of three types of exercise interventions on healthy old adults' gait speed: a systematic review and meta‐analysis. Sports Med 2015;45:1627–1643. [DOI] [PMC free article] [PubMed] [Google Scholar]
- 4. Reeves ND, Narici MV, Maganaris CN. Effect of resistance training on skeletal muscle‐specific force in elderly humans. J Appl Physiol (1985) 2004;96:885–892. [DOI] [PubMed] [Google Scholar]
- 5. Tracy BL, Ivey FM, Hurlbut D, Martel GF, Lemmer JT, Siegel EL, et al. Muscle quality. II. Effects of strength training in 65‐ to 75‐yr‐old men and women. J Appl Physiol (1985) 1999, 1;86:195–201. [DOI] [PubMed] [Google Scholar]
- 6. Chale A, Cloutier GJ, Hau C, Phillips EM, Dallal GE, Fielding RA. Efficacy of whey protein supplementation on resistance exercise‐induced changes in lean mass, muscle strength, and physical function in mobility‐limited older adults. J Gerontol A Biol Sci Med Sci 2013;68:682–690. [DOI] [PMC free article] [PubMed] [Google Scholar]
- 7. Bechshoft RL, Malmgaard‐Clausen NM, Gliese B, Beyer N, Mackey AL, Andersen JL, et al. Improved skeletal muscle mass and strength after heavy strength training in very old individuals. Exp Gerontol 2017;92:96–105. [DOI] [PubMed] [Google Scholar]
- 8. Tieland M, Dirks ML, van der Zwaluw N, Verdijk LB, van den Rest O, de Groot LC, et al. Protein supplementation increases muscle mass gain during prolonged resistance‐type exercise training in frail elderly people: a randomized, double‐blind, placebo‐controlled trial. J Am Med Dir Assoc 2012;13:713–719. [DOI] [PubMed] [Google Scholar]
- 9. Kryger AI, Andersen JL. Resistance training in the oldest old: consequences for muscle strength, fiber types, fiber size, and MHC isoforms. Scand J Med Sci Sports 2007;17:422–430. [DOI] [PubMed] [Google Scholar]
- 10. Cannon J, Kay D, Tarpenning KM, Marino FE. Comparative effects of resistance training on peak isometric torque, muscle hypertrophy, voluntary activation and surface EMG between young and elderly women. Clin Physiol Funct Imaging 2007;27:91–100. [DOI] [PubMed] [Google Scholar]
- 11. Knight CA, Kamen G. Adaptations in muscular activation of the knee extensor muscles with strength training in young and older adults. J Electromyogr Kinesiol 2001;11:405–412. [DOI] [PubMed] [Google Scholar]
- 12. Hvid LG, Strotmeyer ES, Skjodt M, Magnussen LV, Andersen M, Caserotti P. Voluntary muscle activation improves with power training and is associated with changes in gait speed in mobility‐limited older adults—a randomized controlled trial. Exp Gerontol 2016;80:51–56. [DOI] [PubMed] [Google Scholar]
- 13. Goodpaster BH, Kelley DE, Thaete FL, He J, Ross R. Skeletal muscle attenuation determined by computed tomography is associated with skeletal muscle lipid content. J Appl Physiol (1985) 2000;89:104–110. [DOI] [PubMed] [Google Scholar]
- 14. Larson‐Meyer DE, Smith SR, Heilbronn LK, Kelley DE, Ravussin E, Newcomer BR. Muscle‐associated triglyceride measured by computed tomography and magnetic resonance spectroscopy. Obesity (Silver Spring) 2006;14:73–87. [DOI] [PMC free article] [PubMed] [Google Scholar]
- 15. Goodpaster BH, Carlson CL, Visser M, Kelley DE, Scherzinger A, Harris TB, et al. Attenuation of skeletal muscle and strength in the elderly: the Health ABC Study. J Appl Physiol (1985) 2001;90:2157–2165. [DOI] [PubMed] [Google Scholar]
- 16. Poehlman ET, Dvorak RV, DeNino WF, Brochu M, Ades PA. Effects of resistance training and endurance training on insulin sensitivity in nonobese, young women: a controlled randomized trial. J Clin Endocrinol Metab 2000;85:2463–2468. [DOI] [PubMed] [Google Scholar]
- 17. Taaffe DR, Henwood TR, Nalls MA, Walker DG, Lang TF, Harris TB. Alterations in muscle attenuation following detraining and retraining in resistance‐trained older adults. Gerontology 2009;55:217–223. [DOI] [PMC free article] [PubMed] [Google Scholar]
- 18. Wang ZM, Leng X, Messi ML, Choi SJ, Marsh AP, Nicklas B, et al. Relationship of physical function to single muscle fiber contractility in older adults: effects of resistance training with and without caloric restriction. J Gerontol A Biol Sci Med Sci 2018. [DOI] [PMC free article] [PubMed] [Google Scholar]
- 19. Parente V, D'Antona G, Adimi R, Miotti D, Capodaglio P, De Vito G, et al. Long‐term resistance training improves force and unloaded shortening velocity of single muscle fibres of elderly women. Eur J Appl Physiol 2008;104:885–893. [DOI] [PubMed] [Google Scholar]
- 20. Erskine RM, Jones DA, Maffulli N, Williams AG, Stewart CE, Degens H. What causes in vivo muscle specific tension to increase following resistance training? Exp Physiol 2011;96:145–155. [DOI] [PubMed] [Google Scholar]
- 21. Slivka D, Raue U, Hollon C, Minchev K, Trappe S. Single muscle fiber adaptations to resistance training in old (>80 yr) men: evidence for limited skeletal muscle plasticity. Am J Physiol Regul Integr Comp Physiol 2008;295:R273–R280. [DOI] [PMC free article] [PubMed] [Google Scholar]
- 22. Choi SJ, Files DC, Zhang T, Wang ZM, Messi ML, Gregory H, et al. Intramyocellular lipid and impaired myofiber contraction in normal weight and obese older adults. J Gerontol A Biol Sci Med Sci 2016;71:557–564. [DOI] [PMC free article] [PubMed] [Google Scholar]
- 23. Koopman R, Manders RJ, Jonkers RA, Hul GB, Kuipers H, van Loon LJ. Intramyocellular lipid and glycogen content are reduced following resistance exercise in untrained healthy males. Eur J Appl Physiol 2006;96:525–534. [DOI] [PubMed] [Google Scholar]
- 24. Fried LP, Tangen CM, Walston J, Newman AB, Hirsch C, Gottdiener J, et al. Frailty in older adults: evidence for a phenotype. J Gerontol A Biol Sci Med Sci 2001;56:M146–M156. [DOI] [PubMed] [Google Scholar]
- 25. Guralnik JM, Ferruchi L, Simonsick EM, Salive ME, Wallace RB. Lower‐extremity function in persons over the age of 70 years as a predictor of subsequent disability. N Engl J Med 1995;332:556–561. [DOI] [PMC free article] [PubMed] [Google Scholar]
- 26. Mendonca N, Granic A, Mathers JC, Hill TR, Siervo M, Adamson AJ, et al. Prevalence and determinants of low protein intake in very old adults: insights from the Newcastle 85+ Study. Eur J Nutr 2017. [DOI] [PMC free article] [PubMed] [Google Scholar]
- 27. Goodpaster BH, Kelley DE, Wing RR, Meier A, Thaete FL. Effects of weight loss on regional fat distribution and insulin sensitivity in obesity. Diabetes 1999;48:839–847. [DOI] [PubMed] [Google Scholar]
- 28. Tarnopolsky MA, Pearce E, Smith K, Lach B. Suction‐modified Bergstrom muscle biopsy technique: experience with 13,500 procedures. Muscle Nerve 2011;43:717–725. [DOI] [PubMed] [Google Scholar]
- 29. Mehlem A, Hagberg CE, Muhl L, Eriksson U, Falkevall A. Imaging of neutral lipids by oil red O for analyzing the metabolic status in health and disease. Nat Protoc 2013;8:1149–1154. [DOI] [PubMed] [Google Scholar]
- 30. Schindelin J, Arganda‐Carreras I, Frise E, Kaynig V, Longair M, Pietzsch T, et al. Fiji: an open‐source platform for biological‐image analysis. Nat Methods 2012;9:676–682. [DOI] [PMC free article] [PubMed] [Google Scholar]
- 31. Laemmli UK. Cleavage of structural proteins during the assembly of the head of bacteriophage T4. Nature 1970;227:680–685. [DOI] [PubMed] [Google Scholar]
- 32. Doria C, Toniolo L, Verratti V, Cancellara P, Pietrangelo T, Marconi V, et al. Improved VO2 uptake kinetics and shift in muscle fiber type in high‐altitude trekkers. J Appl Physiol (1985) 2011;111:1597–1605. [DOI] [PubMed] [Google Scholar]
- 33. Venturelli M, Saggin P, Muti E, Naro F, Cancellara L, Toniolo L, et al. In vivo and in vitro evidence that intrinsic upper‐ and lower‐limb skeletal muscle function is unaffected by ageing and disuse in oldest‐old humans. Acta Physiol (Oxf) 2015;215:58–71. [DOI] [PMC free article] [PubMed] [Google Scholar]
- 34. Arnold P, Bautmans I. The influence of strength training on muscle activation in elderly persons: a systematic review and meta‐analysis. Exp Gerontol 2014;58:58–68. [DOI] [PubMed] [Google Scholar]
- 35. Graven‐Nielsen T, Lund H, Arendt‐Nielsen L, Danneskiold‐Samsoe B, Bliddal H. Inhibition of maximal voluntary contraction force by experimental muscle pain: a centrally mediated mechanism. Muscle Nerve 2002;26:708–712. [DOI] [PubMed] [Google Scholar]
- 36. Harridge SD, Kryger A, Stensgaard A. Knee extensor strength, activation, and size in very elderly people following strength training. Muscle Nerve 1999;22:831–839. [DOI] [PubMed] [Google Scholar]
- 37. Aubrey J, Esfandiari N, Baracos VE, Buteau FA, Frenette J, Putman CT, et al. Measurement of skeletal muscle radiation attenuation and basis of its biological variation. Acta Physiol (Oxf) 2014;210:489–497. [DOI] [PMC free article] [PubMed] [Google Scholar]
- 38. Hvid LG, Brocca L, Ørtenblad N, Suetta C, Aagaard P, Kjaer M, et al. Myosin content of single muscle fibers following short‐term disuse and active recovery in young and old healthy men. Exp Gerontol 2017;100–107. [DOI] [PubMed] [Google Scholar]
- 39. Claassen H, Gerber C, Hoppeler H, Luthi JM, Vock P. Muscle filament spacing and short‐term heavy‐resistance exercise in humans. J Physiol 1989;409:491–495. [DOI] [PMC free article] [PubMed] [Google Scholar]
- 40. Frontera WR, Hughes VA, Krivickas LS, Kim SK, Foldvari M, Roubenoff R. Strength training in older women: early and late changes in whole muscle and single cells. Muscle Nerve 2003;28:601–608. [DOI] [PubMed] [Google Scholar]
- 41. Godard MP, Gallagher PM, Raue U, Trappe SW. Alterations in single muscle fiber calcium sensitivity with resistance training in older women. Pflugers Arch 2002;444:419–425. [DOI] [PubMed] [Google Scholar]
- 42. Raue U, Slivka D, Minchec K, Trappe S. Improvements in whole muscle and myocellular function are limited with high‐intensity resistance training in octogenarian women. J Appl Physiol (1985) 2009;106:1611–1617. [DOI] [PMC free article] [PubMed] [Google Scholar]
- 43. Trappe S, Godard M, Gallagher P, Carrol C, Rowden G, Porter D. Resistance training improves single muscle fiber contractile function in older women. Am J Physiol Cell Physiol 2001;281:C398–C406. [DOI] [PubMed] [Google Scholar]
- 44. Kelly NA, Hammond KG, Stec MJ, Bickel CS, Windham ST, Tuggle SC, et al. Quantification and characterization of grouped type I myofibers in human aging. Muscle Nerve 2018;57:E52–E59. [DOI] [PMC free article] [PubMed] [Google Scholar]
- 45. Andersen JL. Muscle fibre type adaptation in the elderly human muscle. Scand J Med Sci Sports 2003;13:40–47. [DOI] [PubMed] [Google Scholar]
- 46. Fiatarone MA, O'Neill EF, Ryan ND, Clements KM, Solares GR, Nelson ME, et al. Exercise training and nutritional supplementation for physical frailty in very elderly people. N Engl J Med 1994;330:1769–1775. [DOI] [PubMed] [Google Scholar]
- 47. Cadore EL, Casas‐Herrero A, Zambom‐Ferraresi F, Idoate F, Millor N, Gómez M, et al. Multicomponent exercises including muscle power training enhance muscle mass, power output, and functional outcomes in institutionalized frail nonagenarians. Age (Dordr) 2014;36:773–785. [DOI] [PMC free article] [PubMed] [Google Scholar]
- 48. Clark BC, Tavoian D, Goodpaster BH, Cawthon RM, Hansen RD, Manini TM. Comment on: “Pitfalls in the measurement of muscle mass: a need for a reference standard” by Buckinx et al. J Cachexia Sarcopenia Muscle 2018;9:1269–1271. [DOI] [PMC free article] [PubMed] [Google Scholar]
- 49. Buckinx F, Landi F, Cesari M, Fielding RA, Visser M, Engelke K, et al. Pitfalls in the measurement of muscle mass: a need for a reference standard. J Cachexia Sarcopenia Muscle 2018;9:269–278. [DOI] [PMC free article] [PubMed] [Google Scholar]
- 50. Buckinx F, Landi F, Cesari M, Fielding RA, Visser M, Engelke K, et al. The authors reply: Letter on: “Pitfalls in the measurement of muscle mass: a need for a reference standard” by Clark et al. J Cachexia Sarcopenia Muscle 2018;9:1272–1274. [DOI] [PMC free article] [PubMed] [Google Scholar]
- 51. Bourgeois B, Fan B, Johannsen N, Gonzalez MC, Ng BK, Sommer MJ, et al. Improved strength prediction combining clinically available measures of skeletal muscle mass and quality. J Cachexia Sarcopenia Muscle 2019;10:84–94. [DOI] [PMC free article] [PubMed] [Google Scholar]
- 52. Tieland M, Trouwborst I, Clark BC. Skeletal muscle performance and ageing. J Cachexia Sarcopenia Muscle 2018;9:3–19. [DOI] [PMC free article] [PubMed] [Google Scholar]
- 53. von Haehling S, Morley JE, Coats AJS, Anker SD. Ethical guidelines for publishing in the Journal of Cachexia, Sarcopenia and Muscle: update 2019. J Cachexia Sarcopenia Muscle 2019; 10: 1143‐1145. [DOI] [PMC free article] [PubMed] [Google Scholar]