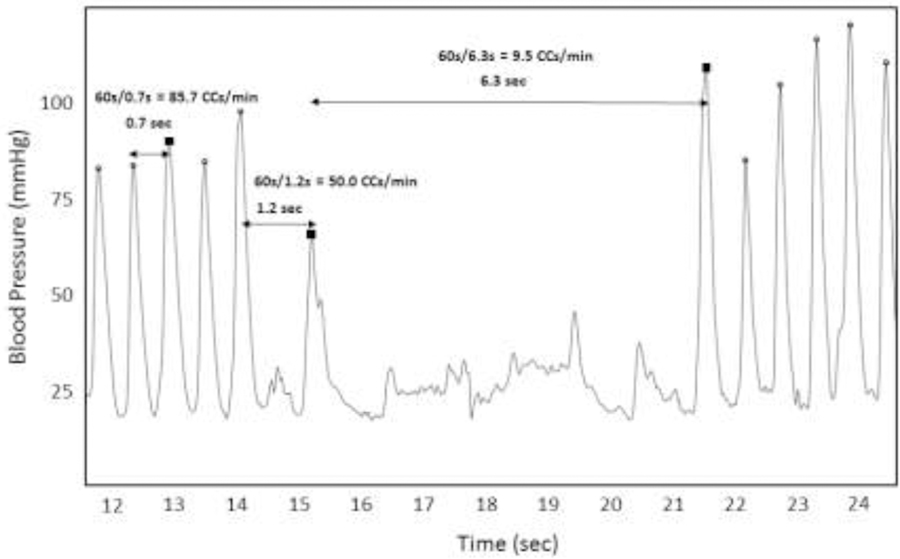
Figure 1: Calculation of chest compression rate.
This figure depicts the arterial blood pressure waveform during a representative period of CPR. Over this period, 12 compressions were identified (systolic peak marked by an open circle). Three compressions are highlighted (filled-in black square). The time to the previous chest compression and the resultant calculated instantaneous rate is noted for each of these highlighted compressions. Instantaneous Rate (RateI) is calculated as 60 divided by the time between compressions.
The average instantaneous rate over the course of a given time period yields the calculated chest compression rate for an event.

