Abstract
A vascularized human proximal tubule model in a dual-channel microphysiological system (VPT-MPS) was developed, representing an advance over previous, single-cell-type kidney microphysiological systems. Human proximal tubule epithelial cells (PTECs) and human umbilical vein endothelial cells (HUVECs) were cocultured in side-by-side channels. Over 24 h of coculturing, PTECs maintained polarized expression of Na+/K+ ATPase, tight junctions (ZO-1), and OAT1. HUVECs showed the absence of ZO-1 but expressed endothelial cell marker (CD-31). In time-lapse imaging studies, fluorescein isothiocyanate (FITC)-dextran passed freely from the HUVEC vessel into the supporting extracellular matrix, confirming the leakiness of the endothelium (at 80 min, matrix/intravessel fluorescence ratio = 0.2). Dextran-associated fluorescence accumulated in the matrix adjacent to the basolateral aspect of the PTEC tubule with minimal passage of the compound into the tubule lumen observed (at 80 min, tubule lumen/matrix fluorescence ratio = 0.01). This demonstrates that the proximal tubule compartment is the rate-limiting step in the secretion of compounds in VPT-MPS. In kinetic studies with radiolabeled markers, p-aminohippuric acid (PAH) exhibited greater output into the tubule lumen than did paracellular markers mannitol and FITC-dextran (tubule outflow/vessel outflow concentration ratio of 7.7% vs 0.5 and 0.4%, respectively). A trend toward reduced PAH secretion by 45% was observed upon coadministration of probenecid. This signifies functional expression of renal transporters in PTECs that normally mediate the renal secretion of PAH. The VPT-MPS holds the promise of providing an in vitro platform for evaluating the renal secretion of new drug candidates and investigating the dysregulation of tubular drug secretion in chronic kidney disease.
Keywords: kidney excretion, vascularized renal tubular model, microphysiological systems
Drug secretion by the renal proximal tubule is a multistep process consisting of passage across the peritubular capillary endothelium, diffusion through the intervening interstitium with its supportive cell types, and vectorial transport across the tubular epithelium. The last step involves coordinated actions of basolateral uptake and apical efflux transporters that shuttle the solute across the epithelial barrier. All these actions occur under continuous blood perfusion of the peritubular capillaries and glomerular ultrafiltrate flow through the tubule lumen.1,2
Many advances have been made over the years toward establishing in vitro models of cultured proximal tubular epithelial cells that allow transcellular transport studies of endogenous solutes and drug molecules.3−6 Recently, we7 and others8−11 have developed 3D models of the human proximal tubule epithelium comprised of a monoculture of proximal tubular epithelial cells (PTECs) in a microfluidic platform that attempts to recapitulate both the biostructure and physiology of proximal renal tubules. Our group has shown that human PTECs cultured in the microphysiological system (MPS) exhibit: (i) long-term cell viability, (ii) polarized cell morphology and expression of proximal tubule cell markers, and (iii) critical functionality with respect to glucose reabsorption, regulation of vitamin D metabolism, and glutathione reclamation. Initial attempts were also made to study transport of p-aminohippuric acid (PAH) and indoxyl sulfate across the PTEC tubule. While this model successfully recapitulates the proximal tubule in many ways, only the interior of the lumen of the tubule can be routinely perfused. We believe that the current model described in this study that incorporates a pseudovasculature that can be perfused with serum proteins and other blood components (modeling plasma protein binding and allowing basolateral exposure to the proximal tubule epithelium) could provide a more comprehensive model of drug exposure to the proximal tubule.
In this report, we show development of a vascularized proximal tubule MPS (VPT-MPS), which represents a technical advance over previous, single cell-type kidney MPS models. We characterized the function of the VPT-MPS in the following respects: (i) sustained expression of respective in vivo cell markers for vascular endothelium and proximal tubule epithelium; (ii) ready extravasation and diffusion of solute across the interstitial matrix; and (iii) epithelial barrier functions including tight junctions resulting in limited transit of paracellular permeability markers and secretory transport of a prototypical anionic drug substrate, PAH. This VPT-MPS should allow future refinements to eventually achieve the construction of a bioengineered human kidney proximal tubule functioning in a biomimetic microinterstitium.
Results and Discussion
Construction and Functional Characterization of VPT-MPS
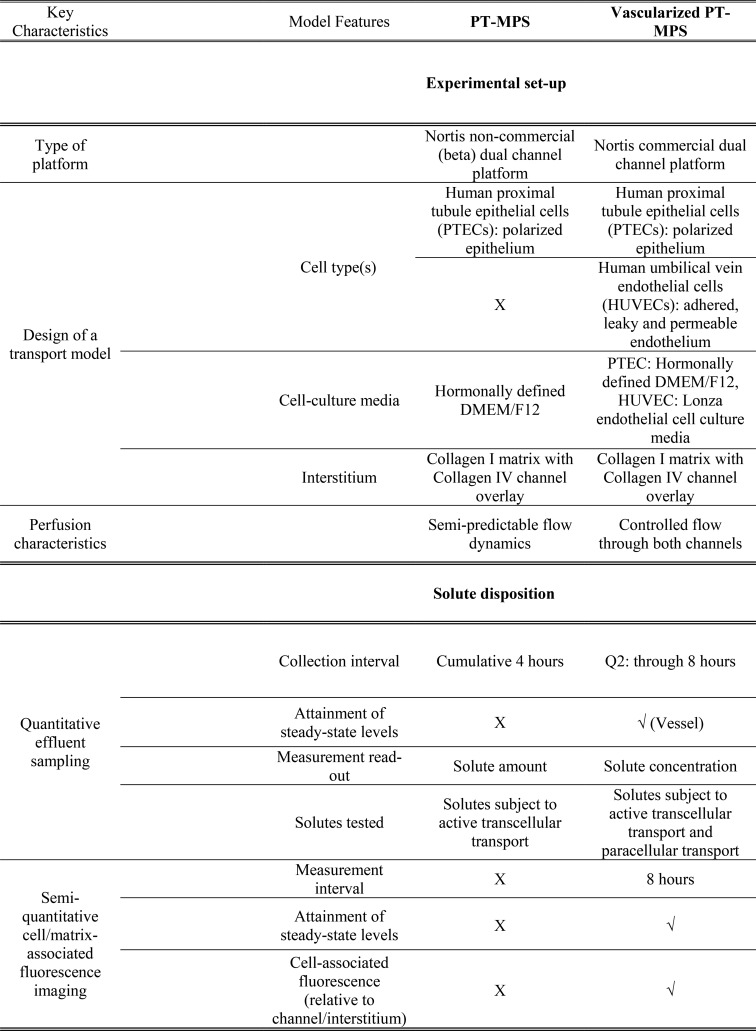
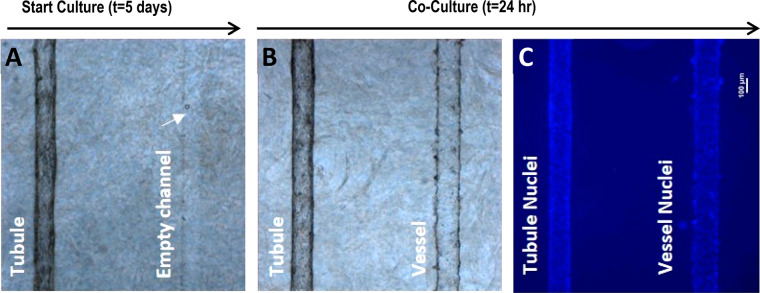
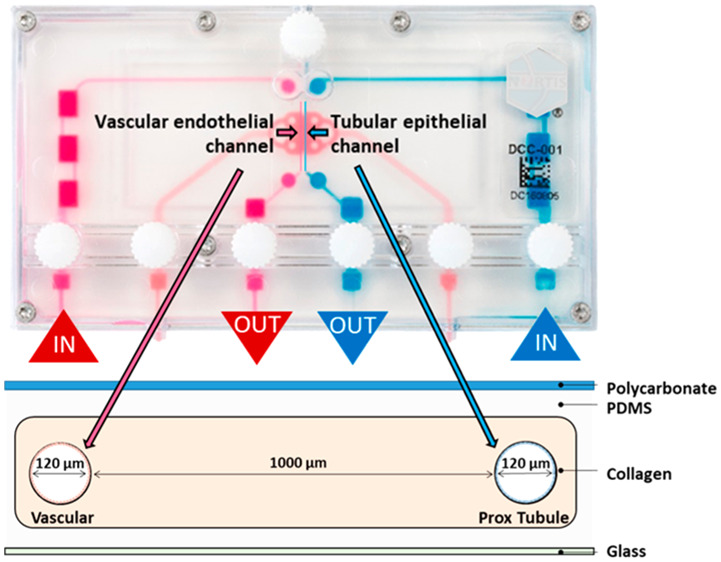
The design of the Nortis VPT-MPS (Figure 1A) and a scheme for modeling the path or steps involved in tubular secretion of a solute is presented in Figure 1. This dual-channel device permitted the study of solute entry into and extravasation from the endothelial vessel, diffusion across the interstitial matrix, coordinated uptake and efflux of solutes across the tubular epithelium, and finally, collection of solutes in the tubular outflow (Figure 1B). In effect, the structure of the VPT-MPS consists of 3 discrete bioengineered compartments: endothelial vessel, interstitial matrix, and epithelial tubule. Depending on the investigative step of proximal tubule solute secretion, the current model enables quantitative assessments of solute concentrations in the output from the tubule and vessel, or visualization and (semi-)quantitation of the distribution of drugs/compounds within the microfluidic device by microscopy imaging techniques (Table 1). On the basis of a tubule diameter of 120 μm, a flow rate of 0.5 μL/min, and media viscosity of 1 mPA·s, the estimated shear stress is approximately 0.5 dyn/cm2 (Poiseuille equation) which closely approximates that observed in the proximal tubule in vivo. Initially, proximal tubule epithelial cells were seeded into one channel and allowed to establish a confluent tubule for 5 days. Then, human umbilical vein endothelial cells (HUVECs) were used to form the endothelial vessel (Figure 2). Coculturing of both cell types was limited to the first 24 h in order to maintain consistent epithelial tubule barrier integrity (maintained expression of ZO-1 in tubular cells) and at the same time prevent tight junction formation in HUVECs that has been previously shown to occur after prolonged time in culture12−15 (Figure 2A).
Figure 1.
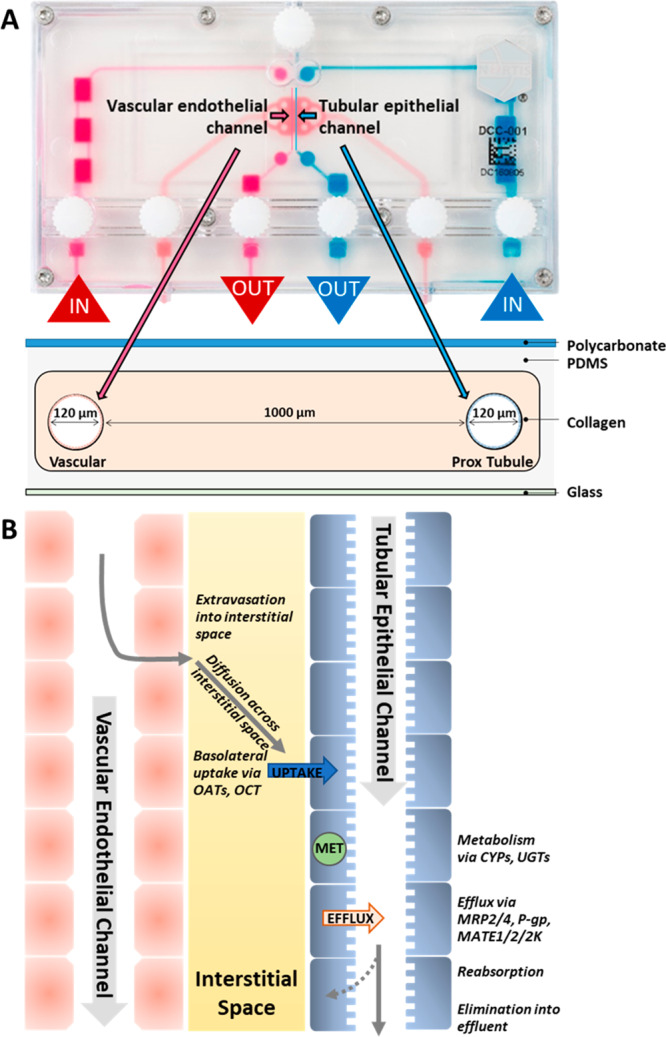
Vascularized proximal tubule MPS (VPT-MPS) construct. (A) Nortis dual-channel platform used for the establishment of VPT-MPS. Extracellular matrix space is depicted in pink, vascular media flow path is shown in magenta, and tubular media flow is shown in blue. Geometric specifications are shown in the cross-sectional scheme. (B) Biologically relevant steps of proximal tubule renal secretion modeled in the VPT-MPS closely simulating in vivo processes. Entry of solute into peritubular capillaries, extravasation of solute into interstitial space, diffusion of solute across the intervening portion of renal interstitium, partitioning and facilitated uptake of solute across basolateral epithelial cell membranes, passive partitioning and facilitated efflux of solute across apical epithelial cell membranes, and finally, passage of solute into distal portion of nephron.
Table 1. Evolution of an In Vitro VPT-MPSa.
Side-by-side comparison and improvements in vascularized PT-MPS relative to previously established single-cell MPS model (PT-MPS). “X” denotes either not possible or not tested in a particular model. “√” denotes that this feature is available in the VPT-MPS.
Figure 2.
Step-wise establishment of an epithelial–endothelial coculture within the VPT-MPS. (A) and (B) Bright-field images of the bioengineered coculture in the collagen I matrix; PTECs were first seeded and allowed to grow for 5 days, followed by seeding of HUVECs for 24 h. (C) Blue fluorescence shows DAPI-stained cell nuclei in epithelial and endothelial cells. Scale bar: 100 μm (40× magnification).
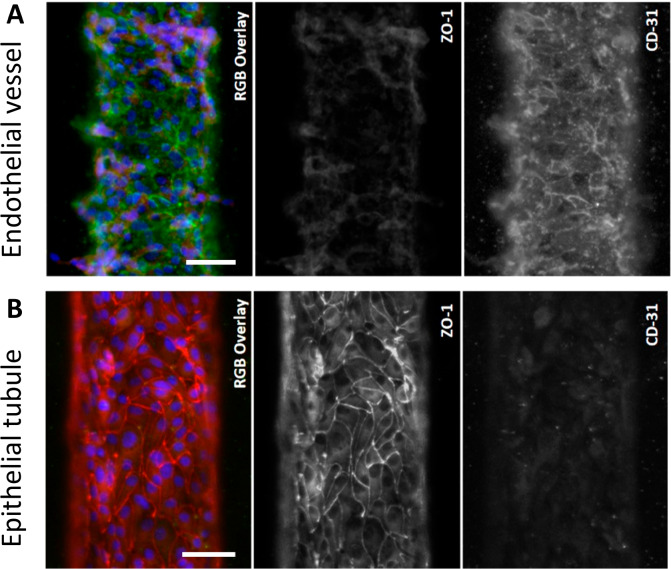
During coculture in VPT-MPS, HUVECs expressed adherent molecule CD31 but had not yet formed tight junctions (i.e., they lacked ZO-1), thus maintaining the vascular/endothelial phenotype (Figure 3A). In contrast, an epithelial tubule established from PTECs and cultured for 7 days showed expression of tight-junction marker ZO-1 (Figure 3B), demonstrating presence of a formidable cellular barrier.
Figure 3.
Morphological characterization of coculture in the VPT-MPS. (A) Endothelial vessel expressing general marker CD-31 (green) but very little ZO-1 (red). (B) Epithelial tubule expressing ZO-1 (red) but very little CD-31 (green). Average epithelial tubule and endothelial vessel diameters are 120 μm. Shown are representative images of cells isolated from a single donor (characterization was reproduced in n = 3 VPT-MPS devices, each from different cell donor). Scale bar: 50 μm.
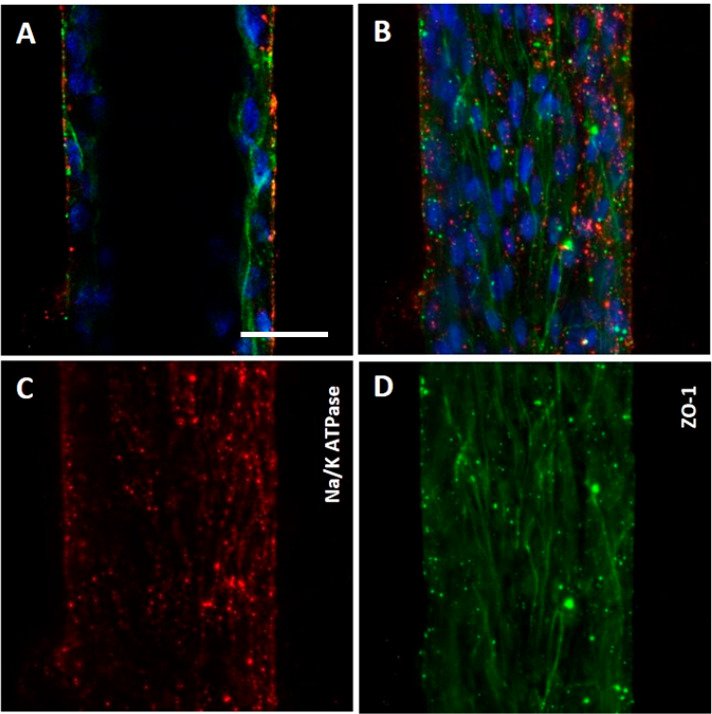
Another critical feature of VPT-MPS was maintenance of epithelial cell polarity (Figure 4). In the established culture conditions (i.e., in the presence of serum-defined media and endothelial cells), PTECs continued to expressed Na+/K+ ATPase and OAT1 on the basolateral side of the cells, while tight-junction marker ZO-1 was visibly expressed along the lateral and apical borders.
Figure 4.
Polarized epithelium in the VPT-MPS. Human proximal tubule epithelial cells in VPT-MPS maintained polarity as demonstrated by basal Na+/K+ ATPase signal adjacent to the interstitium (red) and ZO-1 signal (green) at the borderline between lateral and apical cellular domains (i.e., toward the tubule lumen). Nuclei are stained in blue. Estimated proportion of cells that are fully polarized is 33%. Shown are images from 1 VPT-MPS (single donor). (A) and (B) Merged cross-sectional images of the tubule (middle of the tubule and as monolayer from the top) showing nuclei (blue), Na+/K+ ATPase (red), and ZO-1 (green). (C) and (D) Independent images of Na+/K+ ATPase (red) and ZO-1 (green) and tubule viewed as a monolayer from the top under 200× magnification. Scale bar: 50 μm.
Disposition of FITC-dextran in the VPT-MPS
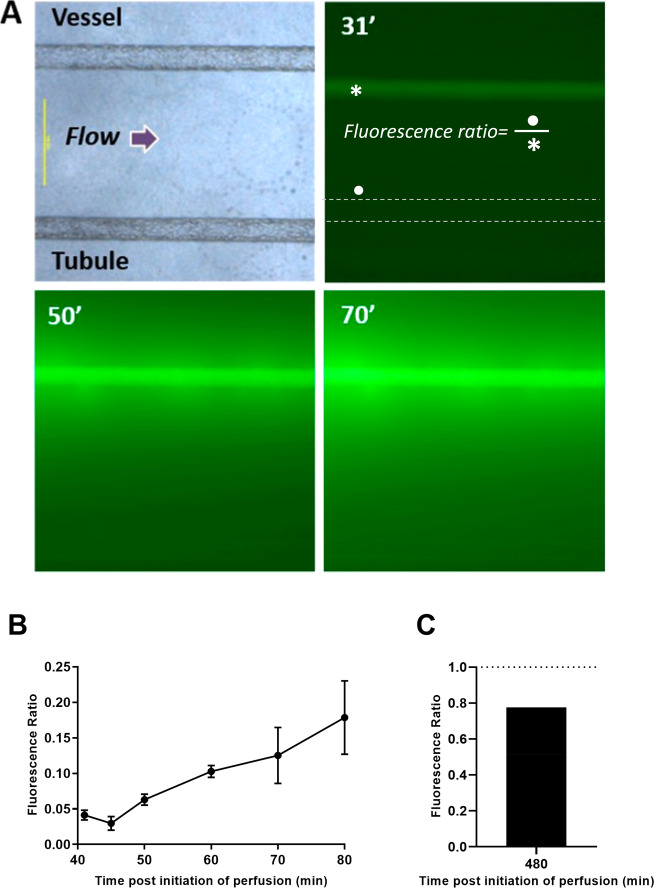
The spread of fluorescein isothiocyanate (FITC)-dextran (MW = 10 kDa) across all 3 compartments of the VPT-MPS is presented in Figures 5 and 6. Upon introducing FITC-dextran into the inlet port of the Nortis platform, FITC-associated fluorescence did not appear in the endothelial vessel until approximately 30 min afterward due to the dead volume passing through the bubble traps. Once FITC-dextran reached the endothelial channel, it rapidly filled the entire endothelial vessel compartment, which was followed by an unrestricted leakage of the marker out of the vessel and into the interstitial matrix. Within the next 10 min, FITC-dextran diffused across the interstitial matrix and reached the basolateral side of the epithelial tubule. Representative time-sequenced images of FITC-dextran extravasation and diffusion across the interstitial matrix are shown in Figure 5A. A progressive decline in fluorescence intensity across the interstitial distance reflects the diffusion gradient in FITC-dextran concentrations. Also, fluorescence intensity on the basolateral matrix side of the epithelial tubule increased over time: At 80 min, the matrix/intravessel fluorescence ratio was estimated to be 0.2 (Figure 5B). At 8 h, the ratio was estimated to be 0.78, indicating similar fluorescence intensities (reflecting dextran concentrations) between vessel and interstitial matrix on the basolateral side of the tubule and attainment of a near steady state (Figure 5C).
Figure 5.
Diffusion of FITC-dextran from vessel across interstitial space in the VPT-MPS. (A) Fluorescent images showing extravasation of FITC-dextran and diffusion across the interstitial matrix (diffusion distance ∼ 1000 μm) to the epithelial tubule over time. Scale bar: 500 μm (40× magnification); γ-function transformation = 0.30. (B) Time-course of fluorescence accumulation in the matrix adjacent to the basolateral aspect (•) of the epithelial tubule relative to fluorescence within the endothelial vessel (*). (C) Mean fluorescence accumulation at experimental end-point (8 h). Flow arrow indicates the direction of flow through the channels (left to right). Times given are after start of perfusion; an initial time delay occurred due to dead volume through bubble traps. Data points represent experiments from n = 3 VPT-MPS devices using cells from 3 separate donors (B) and n = 2 VPT-MPS devices using cells form 2 separate donors. Equation for fluorescence ratio can be found in the Materials and Methods.
Figure 6.
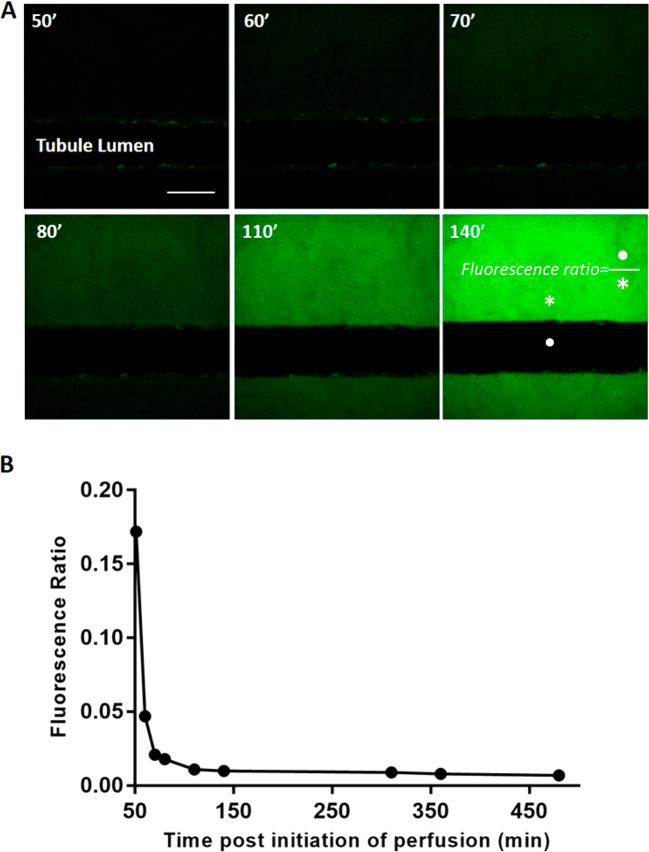
Minimal translocation of FITC-dextran across the tubular epithelium into the lumen over time. (A) Representative images of FITC-dextran accumulation on the basolateral side of the tubular epithelium. Elimination of out-of-plane fluorescence highlighted the true extent of FITC-dextran translocation; 200× magnification. Scale bar: 100 μm. (B) Time-dependent decrease in fluorescence tubule/interstitium ratio; the ratio plateaued at approximately 2 h. Fluorescence intensity in the interstitium was determined immediately adjacent to the epithelial lumen facing the endothelial channel (* basolateral intensity) and in the middle of the epithelial lumen (• tubule intensity). Changes in ratio were due to increased interstitial fluorescence accumulation. Times given are after start of perfusion; an initial time delay occurred due to dead volume through bubble traps. Data points compiled from n = 2 VPT-MPS devices (each experiment with a different cell donor).
Since conventional fluorescence microscopy does not allow for removal of out of focus FITC-dextran fluorescence emanating from the matrix above and below the epithelial tubule, we utilized a 2-photon microscope to study the uptake of the marker from the interstitium on the basolateral side of the tubule into the tubule lumen (Figure 6). While FITC-dextran readily diffused across the interstitium and accumulated at the basolateral side of the epithelial tubule, it did not significantly translocate into the tubule lumen. The very low level of FITC-dextran fluorescence appearing in the tubule lumen reflects access via the paracellular path. Representative time-sequenced images of FITC fluorescence are shown in Figure 6A. An initial sharp decrease in ratio of tubule lumen/interstitium presented in Figure 6B was due to rapid buildup of interstitial fluorescence with negligible increase in tubular lumen fluorescence. The lumen-to-interstitium ratio appeared to have plateaued at 2 h, to a minimal ratio of 0.01. Notably, the extended duration of fluorescence imaging in the lower, atmospheric CO2 environment showed no evidence of impairment of cell viability of either the endothelium or epithelium (Figure 7).
Figure 7.
Cell viability in atmospheric CO2. Tubule (consisting of human PTECs) and vessel (consisting of HUVECs) in VPT-MPS maintain cell viability for up to 8 h when exposed to atmospheric CO2 during time-lapse functional imaging studies; some cell death and gaps in cell coverage is observed in vessel. Shown are images from n = 2 VPT-MPS devices constructed from single cell donor. Scale bar: 100 μm
Secretory Transport across the Epithelial Tubule in the VPT-MPS
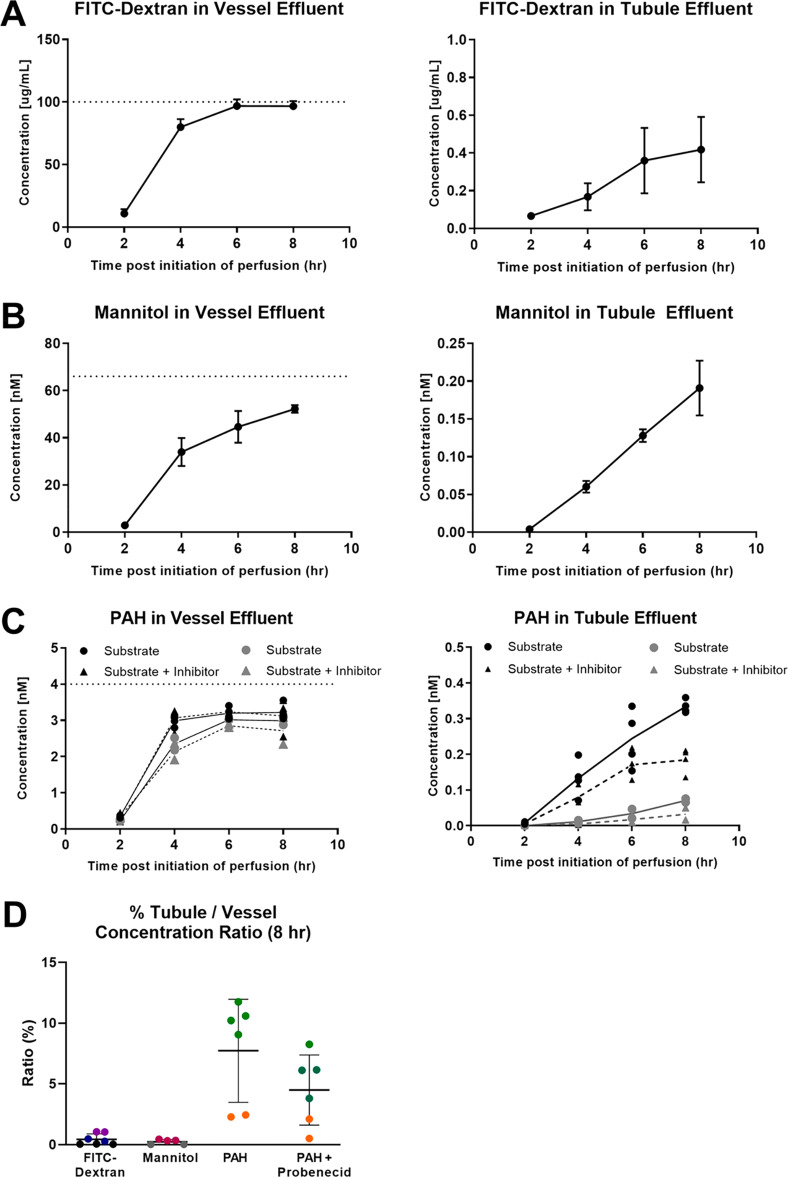
The disposition or routing of the secretory transport and paracellular markers introduced into the vascular channel were monitored by measuring their effluent concentrations from the endothelial vessel and epithelial tubule channels. Over the course of 8 h, cumulative recoveries of FITC-dextran, mannitol, and PAH from both channels were 97.5, 85.2, and 100.5%, respectively. It is noteworthy that adsorption of test compounds into the PDMS scaffold, a common concern in MPS systems, does not seem to be a problem in this situation. As shown in Figure 8A and Table 2, only trace amounts of FITC-dextran managed to reach the effluent of the tubule (tubule/input ratio of 0.4% at 8 h), while the concentration in the endothelial vessel effluent already approached the nominal input level by 4 h (vessel/input ratio of 97.1% at 8 h). Like FITC-dextran, mannitol has high polarity and is negatively charged, but it is much smaller in size. It is well-accepted as a marker for paracellular permeability across epithelial barriers.16,17 At 6–8 h after initiation of perfusion, mannitol concentration in the vessel effluent began to approach a plateau (Figure 8B), somewhat lower than that of FITC-dextran (Table 2), possibly due to slower equilibration and/or more extensive distribution in the interstitial space because of smaller molecule size. The level of mannitol in the tubule effluent increased linearly with time, and when standardized to the nominal input, it was nearly the same as that of FITC-dextran. PAH was selected as a solute that is known to translocate across the tubular epithelium by means of passive diffusion and active transport via basolateral uptake and apical efflux transporters.1 The concentration of PAH in the vessel effluent plateaued in 6 h at a level 75% that of its nominal input, while its concentration in the tubule effluent increased in a linear manner over time; it exhibited 15- to 20-fold higher output into the tubular outflow than mannitol and FITC-dextran (tubule outflow/vessel outflow concentration ratio of 7.7% vs 0.5 and 0.4%, respectively). The levels of PAH in the tubule effluent were also reduced by 45.0% in the presence of probenecid (Figure 8 and Table 2), although this difference was not considered statistically significant (p = 0.09), likely due to the variability in PAH tubular secretion introduced by constructing VPT-MPS from cells of different donors. Nevertheless, the inhibition could be attributed to the inhibition of PAH basolateral uptake via organic anion transporters (OAT1 and OAT3) expressed in the epithelial cells as revealed by immunocytochemistry (Figure 9. We further undertook proof-of-principle in vitro to in vivo scaling to predict the renal clearance of PAH based on the intrinsic secretory clearance data obtained from our VPT-MPS. As seen in Table 3, the predicted value of PAH renal clearance reasonably approximated (within 2-fold) previously reported in vivo PAH renal clearance.18
Figure 8.
Handling of secretory transport and paracellular markers in the VPT-MPS. Graphs show concentration–time course of solutes (mean ± SD) when sampled from the respective effluents of endothelial vessel and epithelial tubule. The dotted horizontal line represents vascular input concentration. (A) FITC-dextran. (B) Mannitol. (C) p-Aminohippuric acid (PAH) in the absence or presence of inhibitor probenecid (2 mM). (D) Relative percent of solute appearing in the tubule vs the vessel at the 8 h time point. FITC-dextran measurements were done in n = 7 VPT-MPS devices (assessed across 3 donors), mannitol in n = 5 VPT-MPS devices (assessed across 2 donors), and PAH in n = 12 VPT-MPS devices (with cells from 2 donors, 6 VPT-MPS devices per inhibitor and 6 VPT-MPS devices per control group). Each donor is shown in a different color.
Table 2. Handling of Solutes in the VPT-MPSa.
| vessel/input (%) | tubule/input (%) | tubule/vessel (%) | |
|---|---|---|---|
| FITC-dextran | 97.1 ± 4.1 | 0.4 ± 0.4 | 0.4 ± 0.4 |
| mannitol | 84.8 ± 8.0 | 0.4 ± 0.2 | 0.5 ± 0.2 |
| PAH | 93.2 ± 5.7 | 7.3 ± 3.6 | 7.7 ± 3.9 |
| PAH (+ probenecid) | 88.5 ± 12.2 | 4.0 ± 2.3 | 4.4 ± 3.8 |
Concentration data (mean ± SD) of FITC-dextran (n = 7 VPT-MPS devices), mannitol (n = 5 VPT-MPS devices), and PAH (± probenecid, n = 6 VPT-MPS devices per treatment group) in the effluents at the last collection interval (t = 8 h). Data are either standardized per nominal input or concentrations in the tubule effluent are compared to that of the concentration in the vessel. VPT-MPS were constructed from cells isolated from 2 donors (PAH), 2 donors (mannitol), or 3 donors (FITC-dextran).
Figure 9.
Determination of transporter expression in PTECs via immunocytochemistry. Top-down maximum intensity projection reveals expression of OAT1 and OAT3 in the cells in the channel; side and lower panels show XZ and YZ cross sections, where X is along the length of the channel and Y is across the curvature. The YZ projection sometimes shows compression of the channel from imaging. Cells expressed Organic Anion Transporter 1 (green (A)) and Organic Anion Transporter 3 (green (B)), with negative DAPI-only control (C). ZO-1 was stained in red. Nuclei are shown in blue. The average diameter of the tubule is 120 μm (200× magnification). Representative images of cells isolated from a single donor (n = 3 VPT-MPS devices). Scale bar: 25 μm.
Table 3. In Vitro to In Vivo Scaling of VPT-MPS Secretory Clearance Data to Predict In Vivo Renal Clearance of PAHa.
| estimate of PAH permeability–surface-area product in VPT-MPS |
|---|
| PA = 0.0909 (±0.0452) μL/min |
| estimation of scaling factor | ||
|---|---|---|
| parameters | VPT-MPS | in vivo (human) |
| length (l) | 6 mm | 15 mm |
| diameter (2r) | 120 μm | 70 μm |
| surface area (estimated as π × 2r × l) | 2.26 mm2 | 3.29 mm2 |
| scaling factor | 3.29 mm2/2.26 mm2 = 1.46 | |
| predicted in vivo unbound tubular clearance of PAH | |
|---|---|
| predicted in vivo renal clearance of PAH |
|---|
| Clrenal = 267.88 (±77.51) mL/min |
| ratio observed/predicted renal clearance of PAH |
|---|
| 469 mL/min/Clrenal = 1.96 (±0.71) |
Concentrations in the effluent and input were measured from an 8 h collection interval. Values represent mean (± SD) of clearance estimates for each VPT-MPS (n = 6 VPT-MPS devices).
We report the development of an improved VPT-MPS for the assessment of solute tubular secretion, a logical progression from our previously established single cell-type proximal tubule model.7 To our knowledge, the VPT-MPS was developed as the first microfluidic cell coculture model for the assessment of solute secretion that incorporates exclusively primary PTECs isolated from adult kidney tissues, while introducing a new, endothelial cell type that resembles features of a renal microvessel. Detailed characterization of the disposition of solutes in constructed VPT-MPS was done via time-course imaging, and functionality of the VPT-MPS was further demonstrated through a series of perfusion studies in which marker concentrations were measured, accounting for this fundamental aspect of the rate of epithelial transporter-mediated solute translocation in the vessel-to-tubule direction. The applicability of VPT-MPS is thus quite distinct from previously reported renal coculture models that have been established to investigate renal reabsorption.19 Besides these major considerations, many other technical improvements and advances were introduced over our previous model and are presented in Table 1.
The critical need for vascularization of organ or tissue models in a microfluidic platform is well recognized;20,21 vascularized MPS has been developed for several organs or tissues that employ endothelial cells to form a supportive microvasculature.22−25In vivo, human kidney microvascular endothelial cells form vessels in the proximal tubule. The hallmark feature of this specialized endothelium are fenestrae, through which xenobiotics and endobiotics can pass into the supporting interstitium.26 Because isolation of primary human kidney microvascular endothelial cells from renal cortical tissues does not provide sufficient yield for use of this cell type from an individual donor kidney to construct multiple VPT-MPS models required for our studies, we chose HUVECs as a surrogate for renal microvascular endothelium, which is a study limitation. While HUVECs have commonly been used as a cell type forming endothelial vessels in microfluidic platforms, have known morphology, and are a readily available cell source, they have been shown to also have morphological features that are distinct from those of the human kidney microvasculature after prolonged time in culture.26,27 Nevertheless, we have demonstrated that within the required time frame of coculture in VPT-MPS, HUVECs do not express tight junctions (Figure 3, which enabled their use as a model for “leaky” endothelium. Very recently, first successful attempts have been made to construct endothelial–epithelial coculture in microfluidic chips with human kidney microvascular cells (HKMECs) of either fetal or adult origin.19 We anticipate further progress in isolation and improved cell culture expansion of primary HKMECs, which will enable a broader use of this cell type in microfluidic coculture models like the VPT-MPS and their use in tubular secretion studies. In the interim, the widely commercially available HUVECs may prove to be a valuable endothelial cell source capable of meeting the material demands for higher throughput screening of drugs undertaken in the pharmaceutical industry. As such, refinement and characterization of MPS models that utilize HUVECs is warranted.
A technical limitation with the construction and functioning of the VPT-MPS is the large interstitial distance between the vessel and tubule (∼1000 μm) compared to what is observed in vivo in the human tubule interstitium, where the approximate distance of the interstitium typically does not exceed the diameter of a single cell.2 This is a common problem observed in organ-on-chip models and is primarily a physical limitation imposed by the design and architecture of device fabrication.20 While some microfluidic devices can apply engineering strategies to minimize the distance between two cell-populated channels,19 the current assembly of commercial Nortis dual-channel platform precludes this option.28 Nevertheless, in our experience, the increased distance between the vessel and tubule helped to stabilize the flow characteristics, as compared to our previous work in beta dual-channel platform, where this distance was shorter (∼700 μm).7 Importantly, the resultant steady flow dynamics allowed us for the first time to reproducibly assess solute output rate from the tubule channel via serial collection of perfusate outflow (Table S1).
What are the potential applications of a vascularized proximal tubule tissue model? Although not an aim in this study, VPT-MPS coupled with advanced imaging techniques could allow assessment of intracellular solute accumulation, which could then support further investigations of mechanisms of intratubular drug toxicity (e.g., tenofovir).29−31 In time, we expect this model will accommodate novel kinetic studies involving small drug molecules bound to plasma proteins (e.g., albumin) or extensively carried by blood cells as well as therapeutic proteins and nanoparticle drug delivery systems. The VPT-MPS model also sets the stage for the future integration of other cell types (e.g., pericytes) critical for the development of a truly holistic model that reflects the complexities of the kidney proximal tubulointerstitial microenvironment. Just as important, the VPT-MPS may also be used to study effects of chronic kidney disease (CKD). Currently, cells isolated for culture in the MPS are obtained from the healthy margins of surgically resected renal carcinomas. Cells from individuals with existing tubulo-interstitial disease can also be used to model the effects of these diseases on drug/solute handling by the proximal tubule.31−34
In conclusion, we have established a vascularized kidney proximal tubule model with key morphological features of renal vessel and tubule in the Nortis dual-channel microfluidic platform and demonstrated the model capacity to mediate the active tubular secretion of organic anions. Further validation (i.e., with other model organic cations) is required for ultimate confirmation of the VPT-MPS utility in modeling tubular secretion of compounds ex vivo.
Materials and Methods
Chemicals and Reagents
FITC-dextran (average MW = 10 kDa), bovine serum albumin, hydrocortisone, Triton X-100, and probenecid were purchased from Sigma-Aldrich (St. Louis, MO). d-Sucrose was acquired from Fisher Scientific (Itsaca, IL). Formaldehyde (16%, methanol-free) was purchased from Polysciences (Warrington, PA). 3H-PAH (40 Ci/mmol) was obtained from American Radiolabeled Chemicals (St. Louis, MO). 3H-mannitol (14.2 Ci/mmol) was obtained from PerkinElmer (Waltham, MA). Phosphate-buffered saline (PBS), 50:50 Dulbecco’s modified Eagle’s medium with Ham’s F-12 (DMEM/F12), penicillin–streptomycin–amphotericin B, insulin–transferrin–selenium A solution (ITS-A), fetal bovine serum (FBS), 0.05% Trypsin EDTA, and ProLong Gold Antifade reagent with 4′,6-diamidino-2-phenylindole (DAPI) were purchased from Thermo-Fisher (Waltham, MA). Alexa Fluor 594 conjugated donkey anti-mouse IgG, Alexa Fluor 488 conjugated donkey anti-rabbit IgG, Alexa Fluor 594 conjugated mouse anti-ZO1, rabbit anti-OAT3, and rabbit anti-CD31 were obtained from Abcam (Cambridge, MA). Rabbit anti-OAT1 was obtained from Fisher Scientific (Pittsburgh, PA), and rabbit anti-Na+/K+ ATPase was obtained from Invitrogen (Waltham, MA). Dual-channel MPS platforms were supplied by Nortis (Woodinville, WA). Rat tail collagen I was purchased from Ibidi (Martinsried, Germany). Collagen IV was obtained from Corning (Corning, NY). HUVECs and EGM-2 bullet kits were obtained from Lonza (Basel, Switzerland).
Isolation of PTECs
Human PTECs were isolated as previously described,7 in accordance with a protocol approved by the University of Washington Human Subjects Institutional Review Board (no. STUDY00001297). Detailed kidney tissue donor information is available in Table S2. Following isolation, cells were expanded in tissue culture flasks for 1–3 passages before use in all experiments.
Establishment of VPT-MPS
The Nortis dual-channel MPS is a commercially available microfluidic cell culture platform. The manufacturing process has previously been described in more detail.28 Briefly, the platform molds were made of machinable wax, and the separate halves of the MPS platforms were cast from PDMS. Then, the platform halves were joined (via sandwiching mandrels that spanned the legth of the channels), and finally, silicone septas were added in the cell seeding ports. The inner chamber of constructed Nortis dual-channel MPS platforms containing PBS–/– was dried, filled with 6 mg/mL of rat tail collagen I, and left overnight to allow the collagen I matrix to solidify. The mandrels of the MPS platforms were then removed, leaving behind two hollow channels through the collagen I matrix. One of the two channels in each MPS platform was coated with a 5 μg/mL mouse collagen IV. Human PTECs were then seeded into the collagen IV coated channel and allowed to attach for 1 h (seeding density at approximately 20–25 million cells/mL). A 0.5 μL/min perfusion of DMEM/F12 media containing ITS-A, 50 nM hydrocortisone, penicillin, streptomycin, and amphotericin B was then initiated. Following 5 days under these culture conditions, the epithelial tubule was established; its morphological and functional characteristics were previously described in detail.7 Perfusion to the channel was then stopped for a brief period. The parallel empty channel was equilibrated with EGM-2 media containing 2% FBS for 2 h at 1.5 μL/min. HUVECs (passages 5–10) were seeded into the equilibrated channel at a density of approximately 25 million cells/mL, which completely filled the channel and ensured uniform distribution of cells along the channel surface. HUVECs were allowed to attach for 30 min to establish an endothelial vessel. Flow to both channels was resumed at 0.5 μL/min with both channels receiving their respective culture medium. All experiments were completed between 8 and 24 h after HUVEC seeding to ensure “leakiness” of the established HUVEC vessel and maintenance of the stable barrier integrity of PTEC tubule. These coculture considerations were made in order to maintain epithelial barrier integrity shown in our previous model (and to avoid previously reported time-dependent barrier characteristics of PTEC cells grown on permeable supports),13 as well as to avoid observable tight-junction formation in HUVECs after prolonged culture.12,14,15 Prior to the beginning of experiments, a visual inspection under light microscope was performed to confirm complete (∼100%) coverage of both HUVEC vessel and PTEC tubule, respectively. Only VPT-MPS that exhibited even, nonperturbed media flow characteristics (i.e., nearly identical volume of output media from HUVEC vessel and PTEC tubule) were selected for use in functional experiments. Due to the high demands of quality assurance with respect to cell coverage and flow characteristics, the VPT-MPS production rate was moderate and estimated at 20%. All experiments were conducted at 1 μL/min flow rate through both channels, respectively.
Immunocytochemistry
VPT-MPS were fixed with a 20 min perfusion of 4% formaldehyde and 2% sucrose through both channels, followed by a wash with PBS+2 (containing calcium and magnesium). Blocking of nonspecific binding was achieved by exposing the cells to a solution of 0.1% Triton X-100 and 5% bovine serum albumin in PBS+2 (PTB). Primary antibodies, diluted in PTB, were then introduced into the channels at the following concentrations: rabbit anti-OAT1 1:20, rabbit anti-OAT3 1:100, anti-CD-31 1:50, conjugated mouse anti-ZO-1 1:100, rabbit anti-Na+/K+ ATPase 1:100 (incubation time: 16 h at 4 °C). Following a wash with PBS+2, secondary antibodies, diluted 1:1000 in PTB, were perfused (incubation time: 1–2 h at room temperature). The cells were again washed with PBS+2 and then finally exposed to a perfusion of a 1:4 (v/v) dilution of DAPI in ProLong Gold Antifade reagent for staining cell nuclei and mounting, respectively. Negative controls consisted of perfused samples that were not incubated with primary antibodies; their micrographs are shown in Figure S1 The vascularized proximal tubule MPS platforms were imaged with either a Leica microscope, a Nikon W1 spinning disk confocal system or an Olympus FV1000 MPE BX61 multiphoton microscope. Images were processed in ImageJ. For viability assessment of PTECs and HUVECs, LIVE/DEAD kit (Life Technologies) was used to distinguish between live and dead cells according to manufacturer’s instructions. Briefly, Calcein AM (2 μM) and EthD-1 (4 μM) were perfused through the VPT-MPS before and after imaging experiments at a room temperature. The viability was determined by acquiring green and red fluorescent images on a Nikon Ti fluorescent microscope.
FITC-dextran Extravasation and Interstitial Diffusion in the VPT-MPS
To characterize the time course of solute extravasation from the endothelial vessel, we conducted time-lapse imaging of FITC-dextran (average MW 10 kDa) infused through the vascular channel. FITC-dextran was chosen to demonstrate that solutes of its size (and smaller) can pass out of the endothelial vessel, but its size was small enough to demonstrate that the epithelial barrier is intact (i.e., marker of paracellular flux). The experiment was conducted with 3 VPT-MPS devices generated from cells isolated from 3 donors, and on different experimental days. Confluent VPT-MPS were perfused with EGM-2 media containing 0.1 mg/mL FITC-dextran at a rate of 1 μL/min for 80 min at room temperature on a Nikon Ti fluorescent microscope. The VPT-MPS were illuminated with a 480–535 nm excitation light at regular time intervals and images of green fluorescence were acquired at a standardized exposure. Background green fluorescence in the VPT-MPS samples was determined immediately prior to initiation of FITC-dextran perfusion. ImageJ software was used to quantify relative fluorescence units (RFU) and a ratio of background-subtracted fluorescence was calculated according to eq 1:
| 1 |
FITC-dextran Tubular Uptake in the VPT-MPS
A time course of FITC-dextran (0.1 mg/mL) uptake into the proximal tubule was acquired on an Olympus FV1000 MPE BX61 multiphoton microscope over 8 h at a perfusion flow rate of 1 μL/min. The temperature was held at 37 °C over the course of imaging; 2 VPT-MPS devices were imaged on different days. Time series images were captured by exposing the channels to 800 nm pulsed excitation light. Sequential green emission signals were acquired using a 25× XLPlan NA1.05 multiphoton objective. Background green fluorescence in the VPT-MPS samples was determined immediately prior to initiation of FITC-dextran perfusion. Fluorescence inside tubule was measured across the entire tubule lumen area acquired during imaging. A ratio of background-subtracted fluorescence was estimated according to eq 2:
| 2 |
Active Tubular Secretion in the VPT-MPS
EGM-2 media containing FITC-dextran (0.1 mg/mL), radiolabeled mannitol (65 nM), or radiolabeled PAH (4 nM) was perfused through the endothelial vessel, mimicking solute delivery via peritubular capillaries. Effluents from the vessel and the tubule were collected every 2 h, and solute concentrations in the samples were determined either by fluorescence plate reader (FITC-dextran) or liquid scintillation counting (mannitol and PAH). FITC-dextran measurements were done in n = 7 VPT-MPS devices (assessed across 3 donors), mannitol in n = 5 VPT-MPS devices (assessed across 2 donors), and PAH in n = 12 VPT-MPS devices (with cells from 2 donors, 6 VPT-MPS devices per inhibitor and 6 VPT-MPS devices per control group). Effluent measurements were extended out to 8 h in order to reach near steady-state levels in solute output.
Physiologically Based Pharmacokinetic Modeling of In Vivo PAH Renal Clearance
Prediction of PAH renal clearance based on data gathered in the VPT-MPS was accomplished through in vitro to in vivo scaling in a stepwise fashion. First, estimation of PAH permeability–surface-area product (PA) per VPT-MPS was made via eq 3:
| 3 |
where ΔA represents amount of PAH collected in the effluent (at 6–8 h collection interval), Δt represents the time interval (2 h), and Cb represents concentration of PAH on the basolateral side of the epithelial tubule. The latter value is calculated from inflow perfusate concentration of PAH at the HUVEC vessel, corrected for the solute concentration gradient across the interstitial matrix (i.e., between HUVEC vessel and PTEC tubule at steady-state; Figure 5C; at t = 8 h, ratio = 0.78). This was estimated by using 2 VPT-MPS devices constructed from cells isolated from 2 donors). The resultant PAH PA was then scaled to the proximal tubule surface area per nephron, and then per total number of nephrons in the two human kidneys in vivo; which yielded an estimate of unbound secretory clearance of PAH (Clu,int). For the scaling, relevant physiological parameters were acquired from the published literature.2,18,35−38 Parameters were collected almost exclusively from human (not animal) kidney studies. Finally, PAH renal clearance was predicted according to eq 4 as previously proposed by Janku, in the case when tubular secretion is operating at solute concentrations far below saturation:39
 |
4 |
where Clrenal represents PAH renal clearance, QR represents renal plasma flow (600 mL/min), fu represents unbound fraction of PAH in plasma (0.8), FF represents glomerular filtration as fraction of renal plasma flow (0.2), GFR represents the glomerular filtration rate (120 mL/min in healthy subjects), and FR represents fraction of PAH reabsorbed from the lumen along the tubule. Given that PAH is polar (log P – 2.2) and highly ionized at urinary pH (pKa = 3.8), tubular reabsorption was assumed to be negligible (FR = 0).
Statistical Analysis
Statistical analysis was conducted in GraphPad Prism 7. A 2-tailed Student’s t-test was employed to assess the effects of probenecid on tubular secretion of PAH in VPT-MPS (α = 0.05).
Acknowledgments
These studies were supported by funding from the National Institute of General Medical Sciences (grant R01GM121354), National Center for Advancing Translational Sciences (grants UG3TR002178 and UG3TR002158), and an unrestricted gift from the Northwest Kidney Centers to the Kidney Research Institute. A.C. was a recipient of Warren G. Magnuson Scholarship at the University of Washington and University of Washington Drug Metabolism, Transport, and Pharmacokinetics Research Fund (UW DMTPR).
Supporting Information Available
The Supporting Information is available free of charge at https://pubs.acs.org/doi/10.1021/acsptsci.9b00078.
Table S1: comparison of media output from dual-channel MPS platforms seeded solely with PTECs (previous model, PT-MPS) versus platforms seeded with both PTECs and HUVECs (current model, VPT-MPS); Table S2: donor information on kidney tissues used for isolation of proximal tubule epithelial cells; Figure S1: no primary antibody controls (negative controls) from immunocytochemistry experiments (PDF)
Author Contributions
A.C., B.D.C., K.E.T., E.J.K., J.H., D.D.S., and C.K.Y. developed and designed the experiments. A.C., B.D.C., D.W.H., S.Y.C., D.D.S., T.I., and C.K.Y. conducted the experiments and data analysis. All authors contributed to writing and editing the manuscript.
The authors declare no competing financial interest.
Supplementary Material
References
- Morrissey K. M.; Stocker S. L.; Wittwer M. B.; Xu L.; Giacomini K. M. (2013) Renal transporters in drug development. Annu. Rev. Pharmacol. Toxicol. 53, 503–29. 10.1146/annurev-pharmtox-011112-140317. [DOI] [PubMed] [Google Scholar]
- Yu A. S. L., Chertow G. M., Luyckx V. A., Marsden P. A., Skorecki K., and Taal M. W., Eds. (2008) Brenner & Rector's The Kidney, 8th ed., Saunders Elsevier. [Google Scholar]
- Taub M. (2004) Primary kidney proximal tubule cells. Methods in molecular biology (Clifton, N.J.) 290, 231–47. 10.1385/1-59259-838-2:231. [DOI] [PubMed] [Google Scholar]
- Detrisac C. J.; Sens M. A.; Garvin A. J.; Spicer S. S.; Sens D. A. (1984) Tissue culture of human kidney epithelial cells of proximal tubule origin. Kidney Int. 25 (2), 383–90. 10.1038/ki.1984.28. [DOI] [PubMed] [Google Scholar]
- Gibson-D’Ambrosio R. E.; Samuel M.; Chang C. C.; Trosko J. E.; D’Ambrosio S. M. (1987) Characteristics of long-term human epithelial cell cultures derived from normal human fetal kidney. In Vitro Cell. Dev. Biol. 23 (4), 279–87. 10.1007/BF02623711. [DOI] [PubMed] [Google Scholar]
- Brown C. D.; Sayer R.; Windass A. S.; Haslam I. S.; De Broe M. E.; D’Haese P. C.; Verhulst A. (2008) Characterisation of human tubular cell monolayers as a model of proximal tubular xenobiotic handling. Toxicol. Appl. Pharmacol. 233 (3), 428–38. 10.1016/j.taap.2008.09.018. [DOI] [PubMed] [Google Scholar]
- Weber E. J.; Chapron A.; Chapron B. D.; Voellinger J. L.; Lidberg K. A.; Yeung C. K.; Wang Z.; Yamaura Y.; Hailey D. W.; Neumann T.; Shen D. D.; Thummel K. E.; Muczynski K. A.; Himmelfarb J.; Kelly E. J. (2016) Development of a microphysiological model of human kidney proximal tubule function. Kidney Int. 90 (3), 627–37. 10.1016/j.kint.2016.06.011. [DOI] [PMC free article] [PubMed] [Google Scholar]
- DesRochers T. M.; Suter L.; Roth A.; Kaplan D. L. (2013) Bioengineered 3D human kidney tissue, a platform for the determination of nephrotoxicity. PLoS One 8 (3), e59219 10.1371/journal.pone.0059219. [DOI] [PMC free article] [PubMed] [Google Scholar]
- Jang K. J.; Mehr A. P.; Hamilton G. A.; McPartlin L. A.; Chung S.; Suh K. Y.; Ingber D. E. (2013) Human kidney proximal tubule-on-a-chip for drug transport and nephrotoxicity assessment. Integr Biol. (Camb) 5 (9), 1119–29. 10.1039/c3ib40049b. [DOI] [PubMed] [Google Scholar]
- Jansen J.; Fedecostante M.; Wilmer M. J.; Peters J. G.; Kreuser U. M.; van den Broek P. H.; Mensink R. A.; Boltje T. J.; Stamatialis D.; Wetzels J. F.; van den Heuvel L. P.; Hoenderop J. G.; Masereeuw R. (2016) Bioengineered kidney tubules efficiently excrete uremic toxins. Sci. Rep. 6, 26715. 10.1038/srep26715. [DOI] [PMC free article] [PubMed] [Google Scholar]
- Homan K. A.; Kolesky D. B.; Skylar-Scott M. A.; Herrmann J.; Obuobi H.; Moisan A.; Lewis J. A. (2016) Bioprinting of 3D Convoluted Renal Proximal Tubules on Perfusable Chips. Sci. Rep. 6, 34845. 10.1038/srep34845. [DOI] [PMC free article] [PubMed] [Google Scholar]
- Beese M.; Wyss K.; Haubitz M.; Kirsch T. (2010) Effect of cAMP derivates on assembly and maintenance of tight junctions in human umbilical vein endothelial cells. BMC Cell Biol. 11, 68. 10.1186/1471-2121-11-68. [DOI] [PMC free article] [PubMed] [Google Scholar]
- Van der Hauwaert C.; Savary G.; Gnemmi V.; Glowacki F.; Pottier N.; Bouillez A.; Maboudou P.; Zini L.; Leroy X.; Cauffiez C.; Perrais M.; Aubert S. (2013) Isolation and characterization of a primary proximal tubular epithelial cell model from human kidney by CD10/CD13 double labeling. PLoS One 8 (6), e66750 10.1371/journal.pone.0066750. [DOI] [PMC free article] [PubMed] [Google Scholar]
- Yeon J. H.; Ryu H. R.; Chung M.; Hu Q. P.; Jeon N. L. (2012) In vitro formation and characterization of a perfusable three-dimensional tubular capillary network in microfluidic devices. Lab Chip 12 (16), 2815–22. 10.1039/c2lc40131b. [DOI] [PubMed] [Google Scholar]
- Chattopadhyay R.; Dyukova E.; Singh N. K.; Ohba M.; Mobley J. A.; Rao G. N. (2014) Vascular endothelial tight junctions and barrier function are disrupted by 15(S)-hydroxyeicosatetraenoic acid partly via protein kinase C epsilon-mediated zona occludens-1 phosphorylation at threonine 770/772. J. Biol. Chem. 289 (6), 3148–63. 10.1074/jbc.M113.528190. [DOI] [PMC free article] [PubMed] [Google Scholar]
- Hubatsch I.; Ragnarsson E. G.; Artursson P. (2007) Determination of drug permeability and prediction of drug absorption in Caco-2 monolayers. Nat. Protoc. 2 (9), 2111–9. 10.1038/nprot.2007.303. [DOI] [PubMed] [Google Scholar]
- Mitchell L. A.; Overgaard C. E.; Ward C.; Margulies S. S.; Koval M. (2011) Differential effects of claudin-3 and claudin-4 on alveolar epithelial barrier function. American journal of physiology. Lung cellular and molecular physiology 301 (1), L40–9. 10.1152/ajplung.00299.2010. [DOI] [PMC free article] [PubMed] [Google Scholar]
- Gross A. S.; McLachlan A. J.; Minns I.; Beal J. B.; Tett S. E. (2001) Simultaneous administration of a cocktail of markers to measure renal drug elimination pathways: absence of a pharmacokinetic interaction between fluconazole and sinistrin, p-aminohippuric acid and pindolol. Br. J. Clin. Pharmacol. 51 (6), 547–55. 10.1046/j.1365-2125.2001.01390.x. [DOI] [PMC free article] [PubMed] [Google Scholar]
- Rayner S. G.; Phong K. T.; Xue J.; Lih D.; Shankland S. J.; Kelly E. J.; Himmelfarb J.; Zheng Y. (2018) Reconstructing the Human Renal Vascular-Tubular Unit In Vitro. Adv. Healthcare Mater. 7 (23), 1801120 10.1002/adhm.201801120. [DOI] [PMC free article] [PubMed] [Google Scholar]
- Abaci H. E.; Shuler M. L. (2015) Human-on-a-chip design strategies and principles for physiologically based pharmacokinetics/pharmacodynamics modeling. Integrative biology: quantitative biosciences from nano to macro 7 (4), 383–91. 10.1039/C4IB00292J. [DOI] [PMC free article] [PubMed] [Google Scholar]
- Low L. A.; Tagle D. A. (2017) Organs-on-chips: Progress, challenges, and future directions. Exp. Biol. Med. (London, U. K.) 242, 1573. 10.1177/1535370217700523. [DOI] [PMC free article] [PubMed] [Google Scholar]
- Lee-Montiel F. T.; George S. M.; Gough A. H.; Sharma A. D.; Wu J.; DeBiasio R.; Vernetti L. A.; Taylor D. L. (2017) Control of oxygen tension recapitulates zone-specific functions in human liver microphysiology systems. Exp. Biol. Med. (London, U. K.) 242, 1617. 10.1177/1535370217703978. [DOI] [PMC free article] [PubMed] [Google Scholar]
- Maoz B. M.; Herland A.; Henry O. Y. F.; Leineweber W. D.; Yadid M.; Doyle J.; Mannix R.; Kujala V. J.; FitzGerald E. A.; Parker K. K.; Ingber D. E. (2017) Organs-on-Chips with combined multi-electrode array and transepithelial electrical resistance measurement capabilities. Lab Chip 17 (13), 2294–2302. 10.1039/C7LC00412E. [DOI] [PubMed] [Google Scholar]
- Tang Y.; Soroush F.; Sun S.; Liverani E.; Langston J. C.; Yang Q.; Kilpatrick L. E.; Kiani M. F. (2018) Protein kinase C-delta inhibition protects blood-brain barrier from sepsis-induced vascular damage. J. Neuroinflammation 15 (1), 309. 10.1186/s12974-018-1342-y. [DOI] [PMC free article] [PubMed] [Google Scholar]
- Tang Y.; Soroush F.; Sheffield J. B.; Wang B.; Prabhakarpandian B.; Kiani M. F. (2017) A Biomimetic Microfluidic Tumor Microenvironment Platform Mimicking the EPR Effect for Rapid Screening of Drug Delivery Systems. Sci. Rep. 7 (1), 9359. 10.1038/s41598-017-09815-9. [DOI] [PMC free article] [PubMed] [Google Scholar]
- Ligresti G.; Nagao R. J.; Xue J.; Choi Y. J.; Xu J.; Ren S.; Aburatani T.; Anderson S. K.; MacDonald J. W.; Bammler T. K.; Schwartz S. M.; Muczynski K. A.; Duffield J. S.; Himmelfarb J.; Zheng Y. (2016) A Novel Three-Dimensional Human Peritubular Microvascular System. J. Am. Soc. Nephrol. 27 (8), 2370–81. 10.1681/ASN.2015070747. [DOI] [PMC free article] [PubMed] [Google Scholar]
- Kim S.; Kim W.; Lim S.; Jeon J. S. (2017) Vasculature-On-A-Chip for In Vitro Disease Models. Bioengineering 4 (1), 8. 10.3390/bioengineering4010008. [DOI] [PMC free article] [PubMed] [Google Scholar]
- Tourovskaia A.; Fauver M.; Kramer G.; Simonson S.; Neumann T. (2014) Tissue-engineered microenvironment systems for modeling human vasculature. Exp. Biol. Med. (London, U. K.) 239 (9), 1264–71. 10.1177/1535370214539228. [DOI] [PMC free article] [PubMed] [Google Scholar]
- Hailey D. W.; Esterberg R.; Linbo T. H.; Rubel E. W.; Raible D. W. (2017) Fluorescent aminoglycosides reveal intracellular trafficking routes in mechanosensory hair cells. J. Clin. Invest. 127 (2), 472–486. 10.1172/JCI85052. [DOI] [PMC free article] [PubMed] [Google Scholar]
- Miller D. S.; Letcher S.; Barnes D. M. (1996) Fluorescence imaging study of organic anion transport from renal proximal tubule cell to lumen. American journal of physiology 271 (3), F508–F520. 10.1152/ajprenal.1996.271.3.F508. [DOI] [PubMed] [Google Scholar]
- Hall A. M. (2013) Update on tenofovir toxicity in the kidney. Pediatr. Nephrol. (Berlin) 28 (7), 1011–23. 10.1007/s00467-012-2269-7. [DOI] [PubMed] [Google Scholar]
- Enomoto A.; Niwa T. (2007) Roles of organic anion transporters in the progression of chronic renal failure. Ther. Apheresis Dial. 11, S27–S31. 10.1111/j.1744-9987.2007.00515.x. [DOI] [PubMed] [Google Scholar]
- Kearney B. P.; Yale K.; Shah J.; Zhong L.; Flaherty J. F. (2006) Pharmacokinetics and dosing recommendations of tenofovir disoproxil fumarate in hepatic or renal impairment. Clin. Pharmacokinet. 45 (11), 1115–24. 10.2165/00003088-200645110-00005. [DOI] [PubMed] [Google Scholar]
- Motojima M.; Hosokawa A.; Yamato H.; Muraki T.; Yoshioka T. (2002) Uraemic toxins induce proximal tubular injury via organic anion transporter 1-mediated uptake. Br. J. Pharmacol. 135 (2), 555–63. 10.1038/sj.bjp.0704482. [DOI] [PMC free article] [PubMed] [Google Scholar]
- Bertram J. F.; Douglas-Denton R. N.; Diouf B.; Hughson M. D.; Hoy W. E. (2011) Human nephron number: implications for health and disease. Pediatr. Nephrol. (Berlin) 26 (9), 1529–33. 10.1007/s00467-011-1843-8. [DOI] [PubMed] [Google Scholar]
- Lote C. J. (2000) Principles of Renal Physiology, 4th ed., Kluwer Academic, London. [Google Scholar]
- Maass C.; Stokes C. L.; Griffith L. G.; Cirit M. (2017) Multi-functional scaling methodology for translational pharmacokinetic and pharmacodynamic applications using integrated microphysiological systems (MPS). Integrative biology: quantitative biosciences from nano to macro 9 (4), 290–302. 10.1039/C6IB00243A. [DOI] [PMC free article] [PubMed] [Google Scholar]
- Vanderbilt Institute for Integrative Biosystems Research and Education (VIIBRE) OoC Scaling Spreadsheet. https://www.vanderbilt.edu/viibre/organs-on-a-chip.php (accessed September 29, 2017).
- Janku I. (1993) Physiological modelling of renal drug clearance. Eur. J. Clin. Pharmacol. 44 (6), 513–9. 10.1007/BF02440850. [DOI] [PubMed] [Google Scholar]
Associated Data
This section collects any data citations, data availability statements, or supplementary materials included in this article.


