

Abstract
For more than 40 years, the contributions of nurture (i.e. the environment) and nature (i.e. genetics) have been touted for their aetiological importance in type 1 diabetes. Disappointingly, knowledge gains in these areas, while individually successful, have to a large extent occurred in isolation from each other. One reason underlying this divide is the lack of a testable model that simultaneously considers the contributions of genetic and environmental determinants in the formation of this and potentially other disorders that are subject to these variables. To address this void, we have designed a model based on the hypothesis that the aetiological influences of genetics and environment, when evaluated as intersecting and reciprocal trend lines based on odds ratios, result in a method of concurrently evaluating both facets and defining the attributable risk of clinical onset of type 1 diabetes. The model, which we have elected to term the ‘threshold hypothesis’, also provides a novel means of conceptualising the complex interactions of nurture with nature in type 1 diabetes across various geographical populations.
Keywords: Aetiopathogenesis, Disease modelling, Environment, Genetics, Immunology, Type 1 diabetes, Viruses
Introduction
Type 1 diabetes is characterised by the immunological destruction of insulin-producing pancreatic beta cells [1]. While the pathogenic mechanisms underlying this event remain unclear, both genetic and environmental factors are widely recognised as features of aetiological importance in disease progression and clinical onset [2]. Our knowledge of type 1 diabetes has certainly improved over the last few decades, and we are now able to predict (i.e. through increasing autoantibody positivity) which individuals will progress to clinical onset and insulin dependency. However, the complex features of genetics and environment have, to a large extent, precluded the development of a precise aetiological model that simultaneously embraces both disciplines in an intellectually satisfying and testable fashion [3]. Indeed, in many visual settings this relationship is often presented as a simple intersection of Venn diagrams whose areas of overlap are simplistically noted to represent the means whereby the two factors allow the formation of this disease, as shown in Fig. 1. In short, we find this model simplistic. To be sure, this statement is not intended to convey the notion that the research community does not care how genes and environment interact to result in the clinical onset of type 1 diabetes. Indeed, a series of large studies, such as the Diabetes Autoimmunity Study in the Young (DAISY), the Baby Diabetes (BABY-DIAB) study, the Environmental Diabetes Determinants in the Young (TEDDY) study and the Trial to Reduce IDDM in the Genetically at Risk (TRIGR) have been performed to identify environmental factors that act either globally (e.g. TEDDY) or specifically (e.g. TRIGR; cows’ milk). The question for our community is how a model could be developed to take into account the complex nature of gene–environment interactions. For example, genetic susceptibility may be conferred by allowing triggering by an environmental event, or genes may contribute to disease formation by modulating the ongoing autoimmune process (e.g. genes controlling immune regulation). Beyond this is the issue of the weighting of genes providing susceptibility or resistance to type 1 diabetes, as well as the ‘diabetogenic potential’ of environmental influences on disease.
Fig. 1.
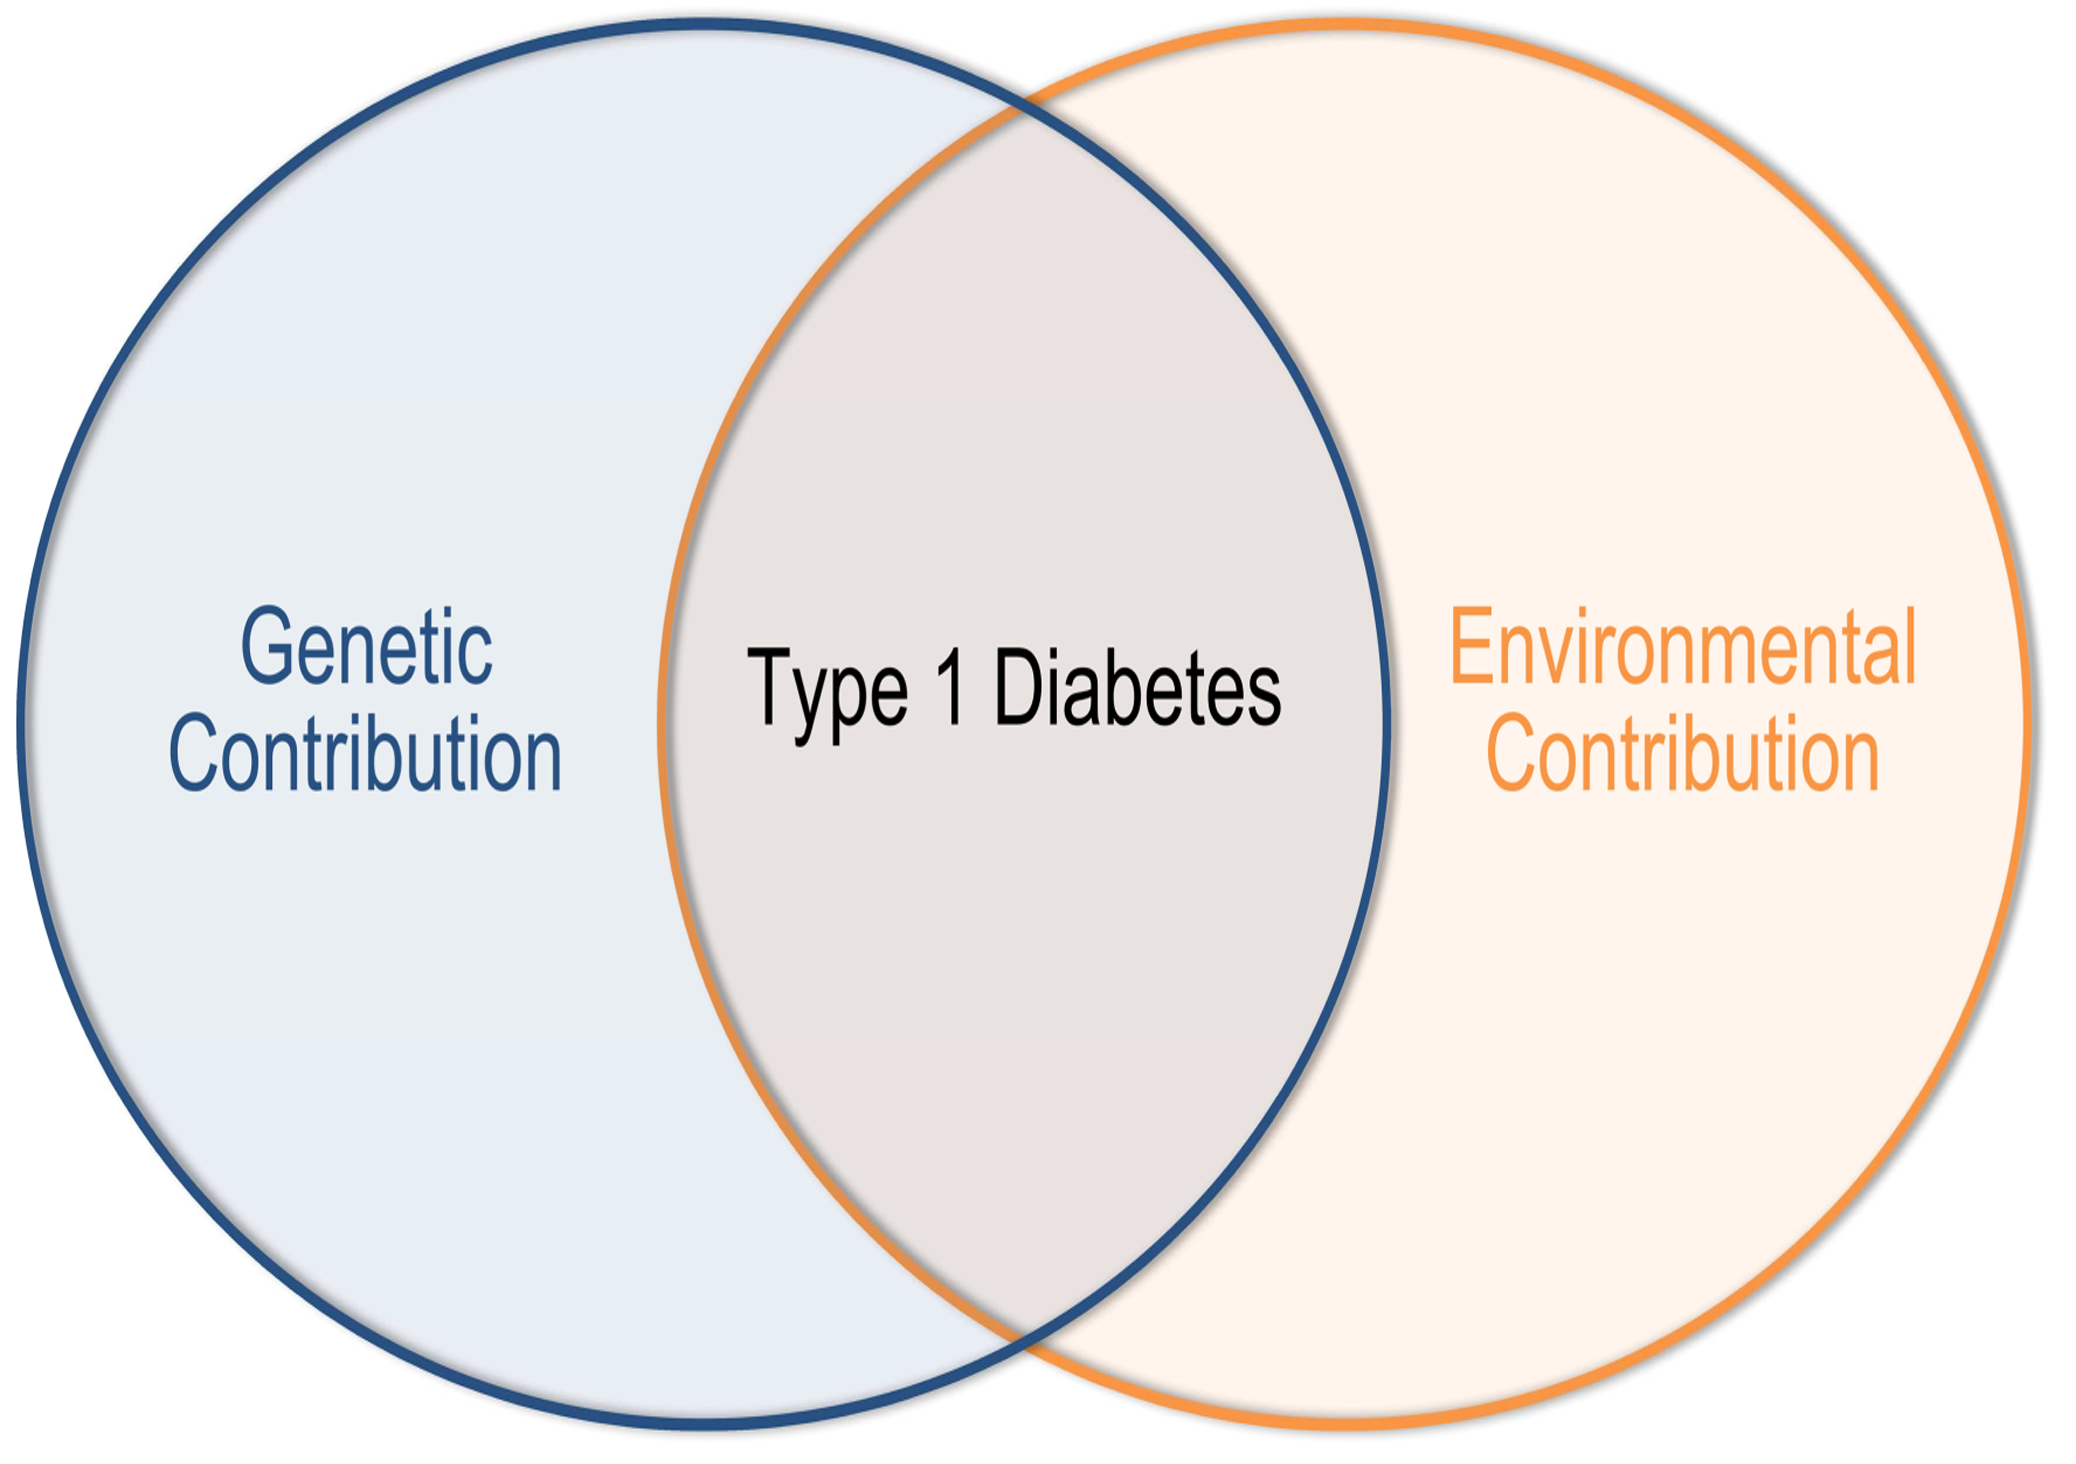
The traditional model describing the relationship and interplay between genetics and environment in type 1 diabetes
Indeed, a significant portion of the difficulties one encounters when attempting to define the aetiopathogenesis of type 1 diabetes can be attributed to the low disease risk conferred by the genetic and environmental factors that have been identified thus far. The genetic architecture of many polygenic disorders, including type 1 diabetes, is usually defined by a myriad of susceptibility alleles, each conferring a relatively small risk of disease. Recent genome-wide association studies in type 1 diabetes have identified variants of known genes or loci (e.g. CD25, also known as IL2RA), as well as supporting previously recognised regions of influence (e.g. HLA) [4]. However, the vast majority of these alleles consistently demonstrate odds ratios of quite modest value [5]. At the same time, the impact of genetic associations with type 1 diabetes cannot be ignored, especially when considering sibling probands, in whom a high degree of familial aggregation has been observed [6]. The influence of the environment on type 1 diabetes is also supported by a wide body of evidence, with a plethora of putative factors suggested, ranging from cow’s milk proteins and gluten to childhood vaccinations and temperature [7]. Yet none has been either conclusively or universally implicated is what is commonly considered autoimmune type 1 diabetes (i.e. type 1A diabetes). Epidemiological observations also support a role for the environment in type 1 diabetes, including a pronounced increase in the frequency of this disorder over the last half-century, along with what some have referred to as the ‘north–south gradient’ in the geographical incidence of this disease [8, 9]. One underlying theme amongst all studies of environmental factors is that in the vast majority of a given population, even those with a combination of the highest risk HLA haplotypes, most do not develop type 1 diabetes [10].
This is not to say that the field of type 1 diabetes research is one devoid of hypothetical models to explain its pathogenesis [11–19]. The ‘accelerator’ and ‘overload’ hypotheses suggest that environmental stresses, specifically childhood obesity for the former, increase insulin demand, thereby overloading the islet cells and accelerating beta cell autoimmune damage [11–13]. In the ‘Copenhagen model’, beta cell destruction is a result of interactions between the environment, the immune system and the beta cells themselves in genetically susceptible individuals [14]. The ‘hygiene hypothesis’ attributes the rising incidence of autoimmune disorders to the reduced or altered stimulation of the immune system by environmental factors [15–17]. Conversely, the ‘fertile field hypothesis’ proposes that microbial infection induces a temporary state in which other antigens can more easily react to yield autoreactive T cells [18]. Also implicating the gut, the ‘old friends’ hypothesis’, which is based on the role of normal gastrointestinal microbes, holds that dietary exposure is a possible direct regulator of the immune system and of self tolerance by altering gut microbiota and permeability [19]. Finally, other models suggest that macrophage infiltration in the islets is setting off a local ‘cytokine storm’, in which ‘sickening’ beta cells are engulfed by antigen-presenting cells, leading to the initiation of an immune response [20–21].
While each of these hypotheses may help explain the development of type 1 diabetes in some individuals or the general increase in disease incidence, they do not (to our thinking) adequately describe the complex landscape that defines type 1 diabetes in the context of genetics alongside that of the environment. Here, we propose a comprehensive, ultimately (if resources were not limiting) testable model of type 1 diabetes capable of incorporating the gamut of these factors, which we call the ‘threshold hypothesis’.
The threshold hypothesis
For illustrative purposes, if one arranges odds ratios in rank order, a curve for the genetic risk of type 1 diabetes can be drawn. Such a curve supports the above-mentioned concept that, even in polygenic disorders, only a small minority of genes contribute a dramatic risk, as shown in Fig. 2 (left y-axis). Rare genetic mutations in genes such as forkhead box P3 (FOXP3) and autoimmune regulator (AIRE) confer proneness to autoimmunity, including beta cell destruction, through their ability to dramatically modulate the immune system; no other identified regions marginally approach guaranteed or near-guaranteed disease [22]. Moving down the genetic risk curve towards the x-axis, the HLA region offers an odds ratio that approaches 7, significantly outpacing its closest counterparts in the INS or PTPN22 loci. Yet while certainly impressive, the HLA region remains far from reliable as a stand-alone proxy of disease susceptibility. Thereafter along the curve, genes and additional identified loci influencing type 1 diabetes rapidly approach an odds ratio of 1 [5]. So called protective loci, such as HLA-DQB, allow the curve to dip below 1, thereby reflecting the contribution of genetic factors offering protection against type 1 diabetes. As for combinations of these loci, little attention has previously been focused on defining a quantitative measure for their combination, additive or subtractive, to the risk of disease. By its design, this model takes these influences into collective account.
Fig. 2.
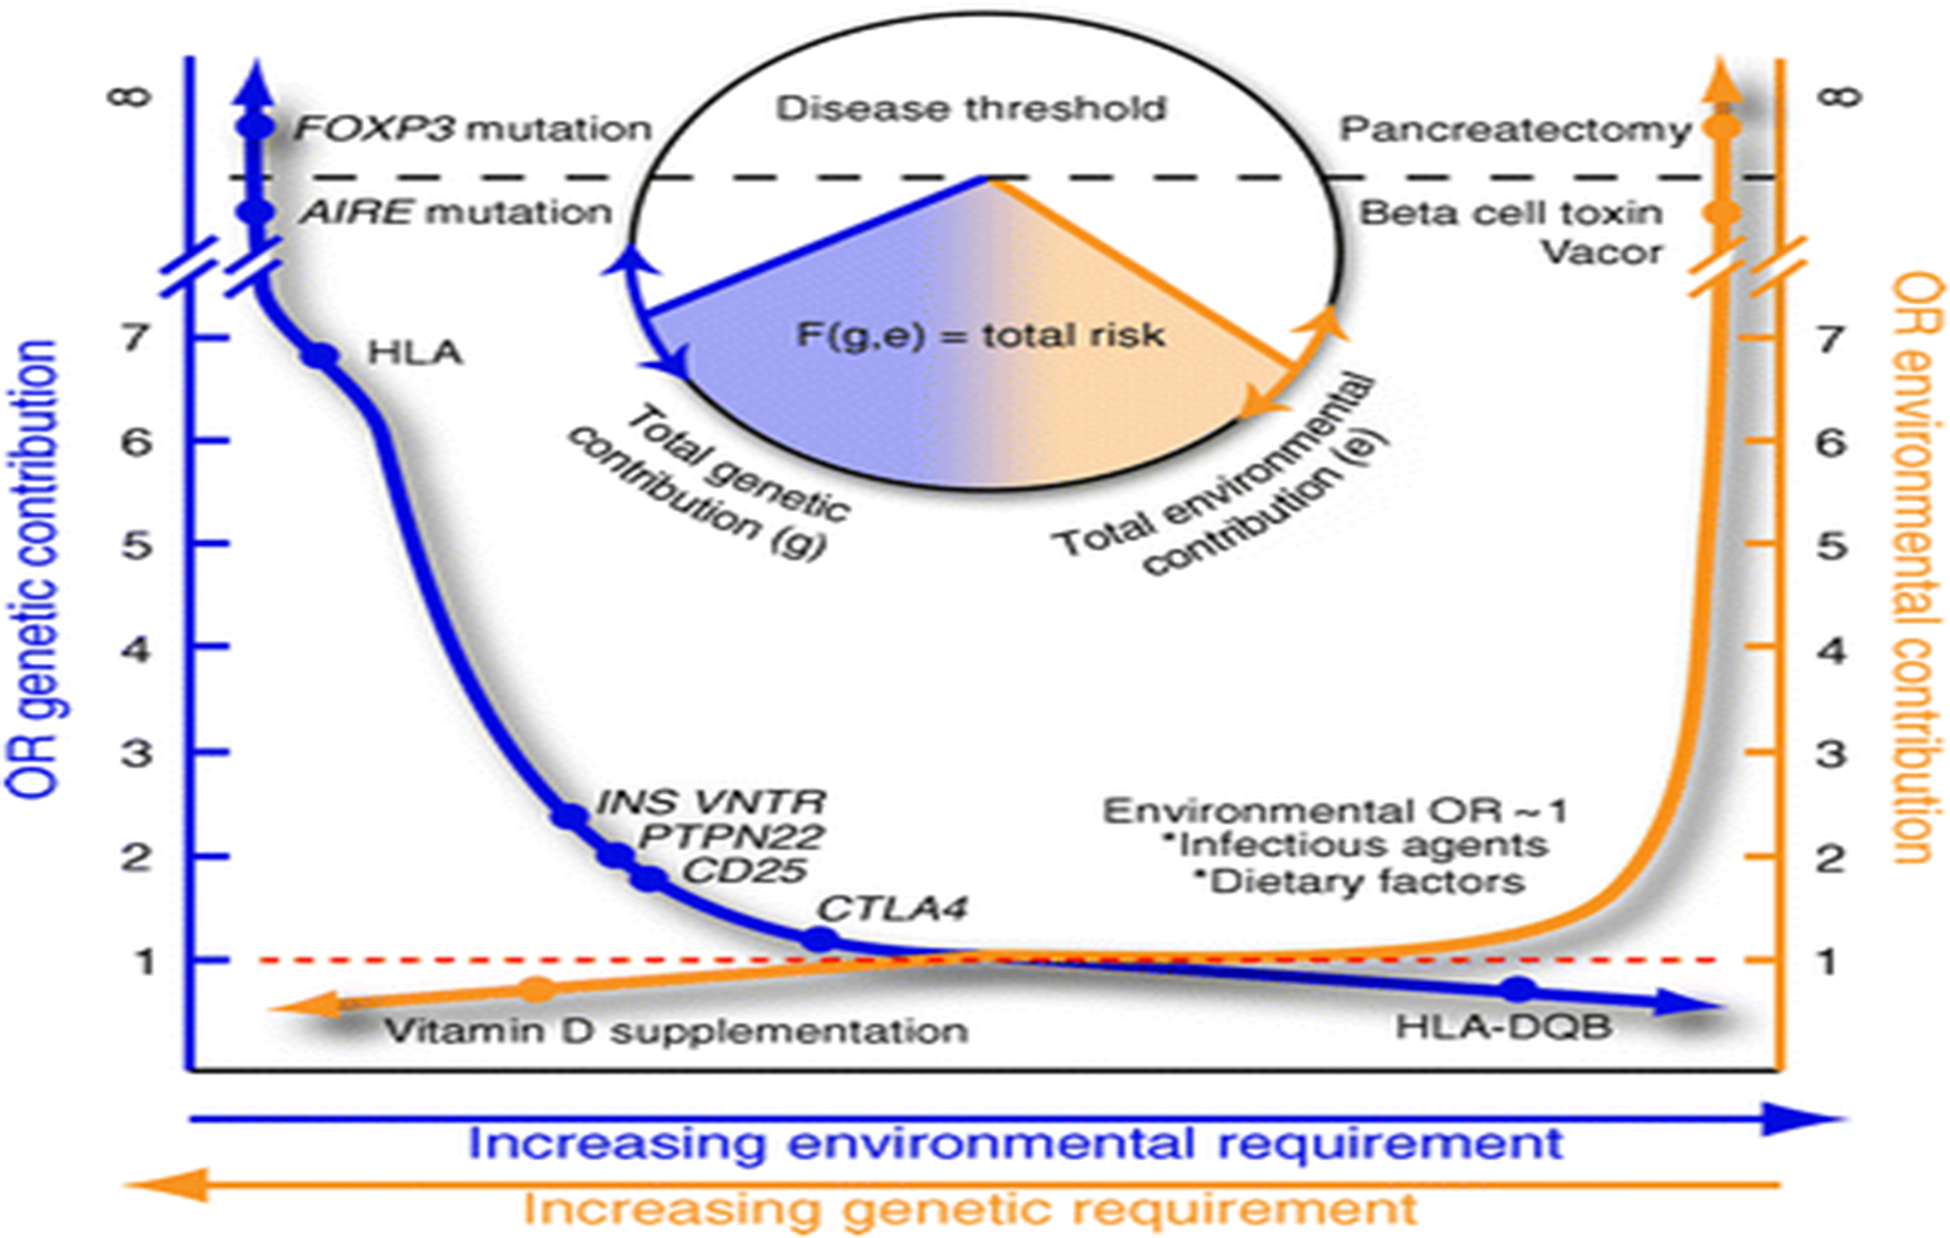
A novel, hypothetical model designed to describe the complex nature and interactions between genes and environment in type 1 diabetes. VNTR, variable number tandem repeat
Similarly, we postulate an analogous approach for modelling environmental agents, as demonstrated in Fig. 2 (right y-axis). Dramatic environmental insults, such as beta cell toxins (e.g. Vacor) or pancreatectomy, have an infinite odds ratio for type 1 diabetes (albeit not autoimmune diabetes), as do the FOXP3 and AIRE variants for genetics. We should note that a much more pronounced decline towards an odds ratio of 1 is present for environmental risk relative to the slope representing the actions of putative genetic influences. Protective events would again be present, though the picture is more ambiguous with dietary, infectious, perinatal and postnatal factors that are able to increase the risk of type 1 diabetes in addition to conferring protection (e.g. the hygiene hypothesis). A theoretical removal of all factors providing susceptibility to a disease, either by genetic modification or environmental modulation, would leave the model with a flat line of genetic and environmental risk, along with an odds ratio of 1. Positions on both forms of y-axis curve rise or fall based on the quantitative sum of genetic or environmental odds ratios for an individual or geographical region.
As noted, little is known regarding the odds ratios for the various combinations of these loci or the multiple environmental contributions and we have therefore not (as yet) attempted to graphically assign a specific number to combinatorial examples. Most would conceptualise that the environment provides a triggering event in genetically susceptible hosts. The question then becomes whether one needs additional environmental input if the genetic risk is lower. This we posit via a conceptual framework for our model, as indicated by the bidirectional arrows on the x-axis. As the total (positive and negative) genetic contribution approaches a threshold, additional environmental input is required (Fig. 2; blue arrow, x-axis). Conversely, additional genetic load is required as the total (positive and negative) environmental factors trend to this hypothetical neutral (Fig. 2; orange arrow, x-axis).
Total risk can then defined by an algorithm, F(g,e) (Fig. 2; circle chart), calculated based on the total genetic contribution and total environmental contribution, both positive and negative. This mathematical function is not solved as a general equation, since it is likely to be different for each gene–gene and gene–environment condition. The model also does not imply additive, subtractive or exponential integration of odds ratios, but instead takes the total genetic and total environment contributions independently and feeds this information into the function F with genetics (g) and environment (e) as variables. The algorithm could be any number of already established epidemiological and statistical approaches (such as principal component, cluster or neural network analyses). Solving the equation in effect yields a risk area that can pass the threshold (dotted line) through an elevated genetic contribution (circle chart, blue line) or an elevated environmental contribution (circle chart, orange line). This provides an integrated view of risk in which crossing the threshold makes disease certain but not crossing it leaves varying degrees of risk, with less certainty. For this reason, we considered it appropriate to refer to our notion as the ‘threshold hypothesis’.
What are the intellectual benefits of considering this hypothesis?
What does the model tell us? First, the environmental contribution alone is extremely modest and probably modulates not only the occurrence but also the rate of occurrence (or age at presentation) of type 1 diabetes [2]. Second, we believe it opens up a new means to envisage the simultaneous contributions of genetics and environment in type 1 diabetes. These relatively similar hyperbolic curves, when in mirror image, serve to illustrate the difficulties in identifying aetiopathic features underlying diseases of this nature. It is highly unlikely that a single risk factor on one curve will be capable of consistently triggering an immune response that leads to type 1 diabetes. Instead, it is far more likely that specific risk factor combinations that take into account multiple values from both curves are the key to understanding the pathogenesis of type 1 diabetes. For example, an individual (or a geographical region) whose genetic contribution to type 1 diabetes is high (i.e. there is a high odds ratio) may fail to develop the disease since their reciprocal environmental contribution score is low. Conversely, an individual (or geographical region) having a high environmental influence supporting type 1 diabetes development may overcome what could be a relatively low genetic contribution (i.e. a low odds ratio), resulting in overt disease. Our hypothesis is that each person will have a combinatorial-based risk of type 1 diabetes based on the sum of genetic and environmental odds ratios. Proper testing of this hypothesis will require prospective analysis of large populations that vary in their genetic and environmental risks of type 1 diabetes and that have also been well documented for the influences of nurture and nature. The debatable part of this postulate is multifold: whether this can ever realistically be tested; whether an environmental smoking gun can be found through studying only genetically high-risk persons; whether there is still an element wherein a stochastic event, for example T cell receptor rearrangement, simply trumps environment contributions in susceptible individuals; and whether there is observed support for these notions.
The fact that type 1 diabetes was not weeded out by natural selection, given the usual age at which this disorder develops, implies that the combination of genes has allowed autoimmunity to re-emerge in different populations with unique environmental niches. Indeed, Fourlanos et al. [23] demonstrated that, in the last five decades, the genetic contribution in individuals diagnosed with type 1 diabetes has not been fixed (i.e. open to change over time). This finding was recently confirmed, to a large extent, by examination of the HLA types in type 1 diabetes patients from the Type 1 Diabetes Genetics Consortium or at the Barbara Davis Diabetes Center [24]. There, investigators observed, over a period of up to 40 years, a change in the frequency of multiple different genotypes and a possible stepwise decrease in the percentage of individuals with HLA DR3/4. These studies suggest that changing environmental conditions have allowed increased penetrance of specific genotypes. This, added to globalisation and increased migration around the world, means that genes find themselves in environments for which they were not adapted. Therefore, our model is not only fluid, but also temporally dependent. This also implies that strong local trends may emerge (in the geographical sense) whereby environmental agents may select a genotype otherwise thought to have a lower risk than has been identified thus far. The model also provides proper recognition that the environment could impact other, non-fixed genetic influences (e.g. epigenetic modifications) whose activities are dependent on the dynamic variable of age. One can also view this model from the opposing perspective, whereby it could be considered that genes form a soil whose degree of fertility allows varying levels of environmental penetrance.
We wish to offer one final notion regarding disease models. They should be flexible and subject to change over time, in accordance with improvements in knowledge, much like that which occurs with a variety of aspects in our daily lives, be it an edition of an Oxford dictionary or a version of computer software (e.g. 2.0). Clearly, our model can only include aspects that we either know (or think we know) at the present time, while being receptive to future knowledge gained from up-and-coming fields (e.g. maternal/fetal influences, genetic imprinting), potential changes in the definition of type 1 diabetes (i.e. from a disorder in which hyperglycaemic onset is the major definitive factor to one where a combination of markers now viewed as elements of risk, such as genetic susceptibility, autoantibodies and metabolic potential, would be considered as type 1 diabetes; even without overt hyperglycaemia), as well as forthcoming disciplines that we are currently unaware of. Over time, if the threshold hypothesis is of value, our hope would be that either ourselves or others would find the hypothesis worthy of such effort and not one relegated to an academic archaeological dig.
Conclusions
Our model suggests that future studies on the aetiopathogenesis of type 1 diabetes should simultaneously address both genetic (including lower-risk genetic profiles) and environmental influences in populations that vary in their risks of type 1 diabetes (i.e. relatives of type 1 diabetes probands as well as in the general population). Studies such as TEDDY, mentioned above, clearly represent a step in the right direction and must continue to find strong support, and should be expanded. This action could dramatically increase the opportunity for identifying environmental agents that significantly modulate and interact with genetic loci, and vice versa. This may lead to the identification of specific combinations of environmental events with known genetic variants, all for the purpose of identifying the cause of type 1 diabetes and factors that protect against it. Finally, testing this model may also shed significant insights into the difficulties of replication and regional variation that have often been observed in studies of this complex disease.
Acknowledgements
The authors thank C. Myhr and D. Blanton (Department of Pathology, University of Florida) for their exceptional editorial assistance in the preparation of this manuscript. This work was supported, in part, by funding from The National Institutes of Health, The Juvenile Diabetes Research Foundation, The Howard Hughes Foundation, The Brehm Coalition for Type 1 Diabetes Research and the Jeffrey Keene Family Professorship.
Footnotes
Duality of interest
The authors declare that there is no duality of interest associated with this manuscript.
References
- 1.Daneman D (2006) Type 1 diabetes. Lancet 367:847–858 [DOI] [PubMed] [Google Scholar]
- 2.Gale EAM (2005) Spring harvest? Reflections on the rise of type 1 diabetes. Diabetologia 48:2445–2450 [DOI] [PubMed] [Google Scholar]
- 3.Atkinson MA, Eisenbarth GS (2001) Type 1 diabetes; new perspectives on disease pathogenesis and treatment. Lancet 358:221–229 [DOI] [PubMed] [Google Scholar]
- 4.Rich SS, Onengut-Gumuscu S, Concannon P (2009) Recent progress in the genetics of diabetes. Horm Res 71:17–23 [DOI] [PubMed] [Google Scholar]
- 5.Cooper JD, Smyth DJ, Smiles AM et al. (2008) Meta-analysis of genome-wide association study data identifies additional type 1 diabetes risk loci. Nat Genet 40:1399–1401 [DOI] [PMC free article] [PubMed] [Google Scholar]
- 6.Redondo MJ, Yu L, Hawa M et al. (2001) Heterogeneity of type I diabetes: analysis of monozygotic twins in Great Britain and the United States. Diabetologia 44:354–362 [DOI] [PubMed] [Google Scholar]
- 7.Soltesz G, Patterson CC, Dahlquist G, EURODIAB Study Group (2007) Worldwide childhood type 1 diabetes incidence—what can we learn from epidemiology? Pediatr Diabetes 8:6–14 [DOI] [PubMed] [Google Scholar]
- 8.Gale EA (2005) Type 1 diabetes in the young: the harvest of sorrow goes on. Diabetologia 48:1435–1438 [DOI] [PubMed] [Google Scholar]
- 9.Green A, Gale EA, Patterson CC (1992) Incidence of childhood-onset insulin-dependent diabetes mellitus: the EURODIAB ACE Study. Lancet 339:905–909 [DOI] [PubMed] [Google Scholar]
- 10.Ilonen J, Sjöroos M, Knip M et al. (2002) Estimation of genetic risk for type 1 diabetes. Am J Med Genet 115:30–36 [DOI] [PubMed] [Google Scholar]
- 11.Wilkin TJ (2001) The accelerator hypothesis: weight gain as the missing link between type I and type II diabetes. Diabetologia 44:914–922 [DOI] [PubMed] [Google Scholar]
- 12.Fourlanos S, Harrison LC, Colman PG (2008) The accelerator hypothesis and increasing incidence of type 1 diabetes. Curr Opin Endocrinol Diabetes Obes 15:321–325 [DOI] [PubMed] [Google Scholar]
- 13.Dahlquist G (2006) Can we slow the rising incidence of childhood-onset autoimmune diabetes? The overload hypothesis. Diabetologia 49:20–24 [DOI] [PubMed] [Google Scholar]
- 14.Nerup J, Mandrap-Poulsen T, Helqvist S et al. (1994) On the pathogenesis of IDDM. Diabetologia 37:S82–S89 [DOI] [PubMed] [Google Scholar]
- 15.Kukreja A, Maclaren NK (2002) NKT cells and type-1 diabetes and the “hygiene hypothesis” to explain the rising incidence rates. Diabetes Technol Ther 2002; 4:323–33 [DOI] [PubMed] [Google Scholar]
- 16.Bach JF (2005) Six questions about the hygiene hypothesis. Cell Immunol 233:158–161 [DOI] [PubMed] [Google Scholar]
- 17.Cooke A (2009) Review series on helminths, immune modulation and the hygiene hypothesis: how might infection modulate the onset of type 1 diabetes? Immunology 126:12–17 [DOI] [PMC free article] [PubMed] [Google Scholar]
- 18.von Herrath MG, Fujinami RS, Whitton JL (2003) Microorganisms and autoimmunity: making the barren field fertile? Nat Rev Microbiol 1:151–157 [DOI] [PubMed] [Google Scholar]
- 19.Vaarala O, Atkinson MA, Neu J (2008) The “perfect storm” for type 1 diabetes: the complex interplay between intestinal microbiota, gut permeability, and mucosal immunity. Diabetes 57:2555–2562 [DOI] [PMC free article] [PubMed] [Google Scholar]
- 20.Freiesleben de Blasio B, Bak P, Pociot F, Karlsen AE, Nerup J (1999) Onset of type 1 diabetes: a dynamical instability. Diabetes 9:1677–1685 [DOI] [PubMed] [Google Scholar]
- 21.Magombedze G, Nduru P, Bhunu CP, Mushayabasa S (2010) Mathematical modeling of immune regulation of type 1 diabetes. Biosystems 102:88–98 [DOI] [PubMed] [Google Scholar]
- 22.Nomura T, Sakaguchi S (2007) Foxp3 and Aire in thymus-generated Treg cells: a link in self-tolerance. Nat Immunol 8:333–334 [DOI] [PubMed] [Google Scholar]
- 23.Fourlanos S, Varney MD, Morahan G et al. (2008) The rising incidence of type 1 diabetes is accounted for by cases with lower-risk human leukocyte antigen genotypes. Diabetes Care 31:1546–1549 [DOI] [PMC free article] [PubMed] [Google Scholar]
- 24.Steck AK, Armstrong TK, Babu SR, et al. (2011) Stepwise or linear decrease in penetrance of type 1 diabetes with lower-risk HLA genotypes over the past 40 years. Diabetes 60:1045–1049 [DOI] [PMC free article] [PubMed] [Google Scholar]