Abstract
Immune evasion is a major obstacle for cancer treatment. Common mechanisms include impaired antigen presentation through mutations or loss of heterozygosity (LOH) of the major histocompatibility complex class I (MHC-I), which has been implicated in resistance to immune checkpoint blockade (ICB) therapy1–3. However, in pancreatic ductal adenocarcinoma (PDAC), a malignancy refractory to most therapies including ICB4, mutations causing MHC-I loss are rarely found5 despite the frequent downregulation of MHC-I expression6–8. Here we find that, in PDAC, MHC-I molecules are selectively targeted for lysosomal degradation through an autophagy-dependent mechanism that involves the autophagy cargo receptor NBR1. PDAC cells display reduced MHC-I cell surface expression and instead demonstrate predominant localization within autophagosomes and lysosomes. Notably, autophagy inhibition restores surface MHC-I levels, leading to improved antigen presentation, enhanced anti-tumour T cell response and reduced tumour growth in syngeneic hosts. Accordingly, anti-tumour effects of autophagy inhibition are reversed by depleting CD8+ T cells or reducing surface MHC-I expression. Autophagy inhibition, either genetically or pharmacologically with Chloroquine (CQ), synergizes with dual ICB (anti-PD1 and anti-CTLA4), and leads to an enhanced anti-tumour immune response. Our findings uncover a role for enhanced autophagy/lysosome function in immune evasion through selective targeting of MHC-I molecules for degradation, and provide a rationale for the combination of autophagy inhibition and dual ICB as a therapeutic strategy against PDAC.
Results
MHC-I is enriched within autophagosomes and lysosomes
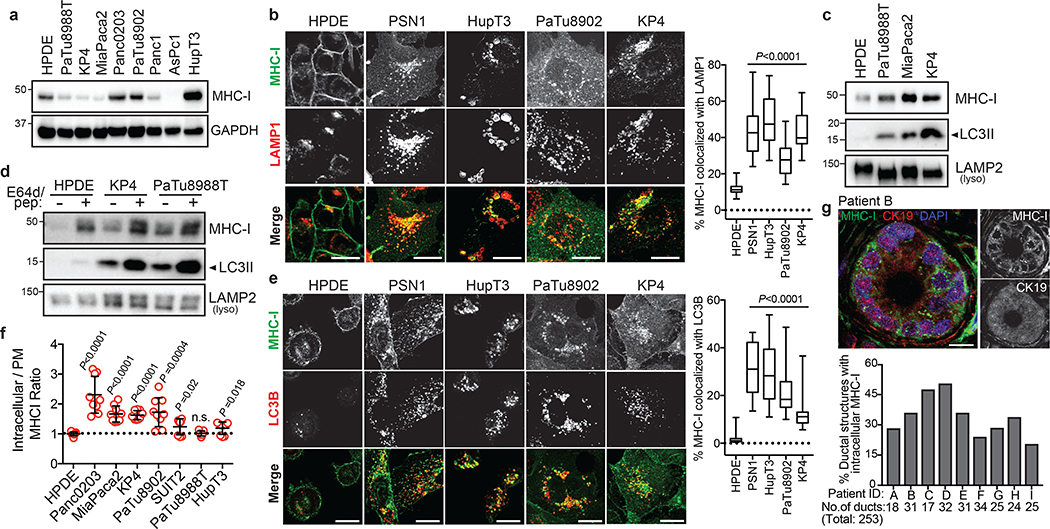
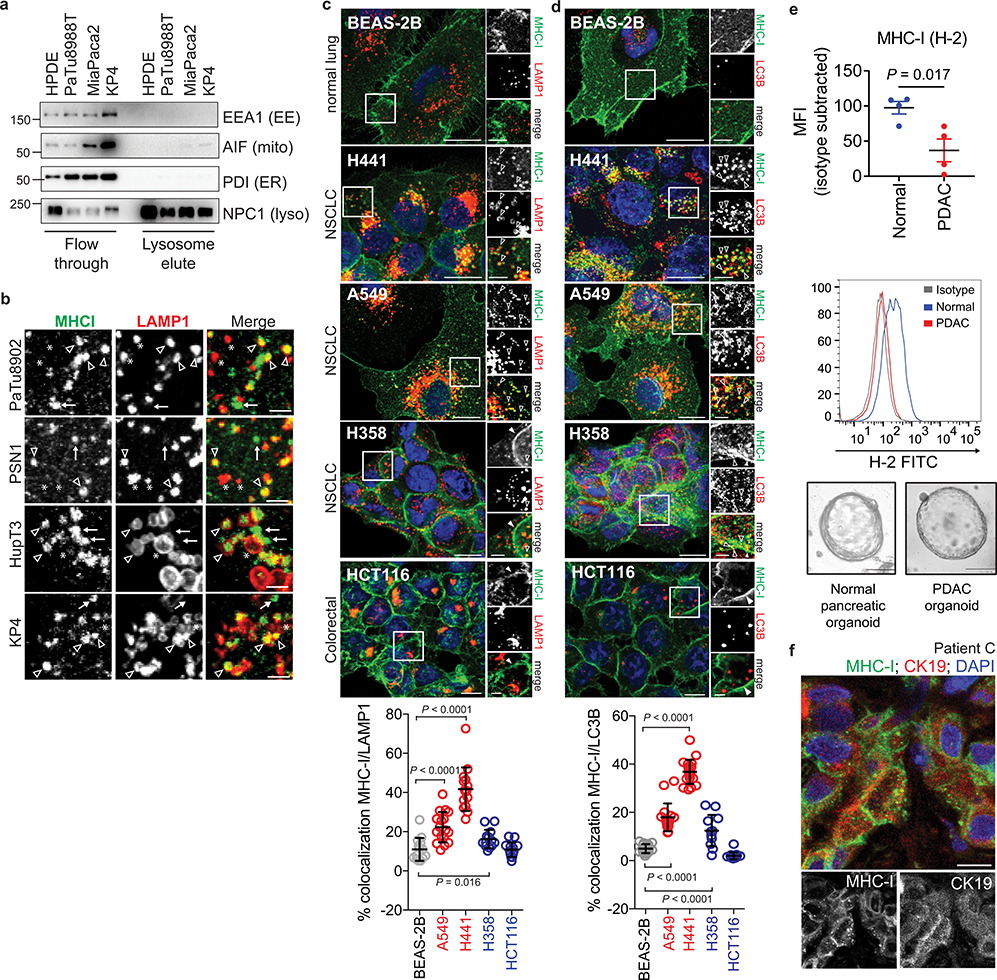
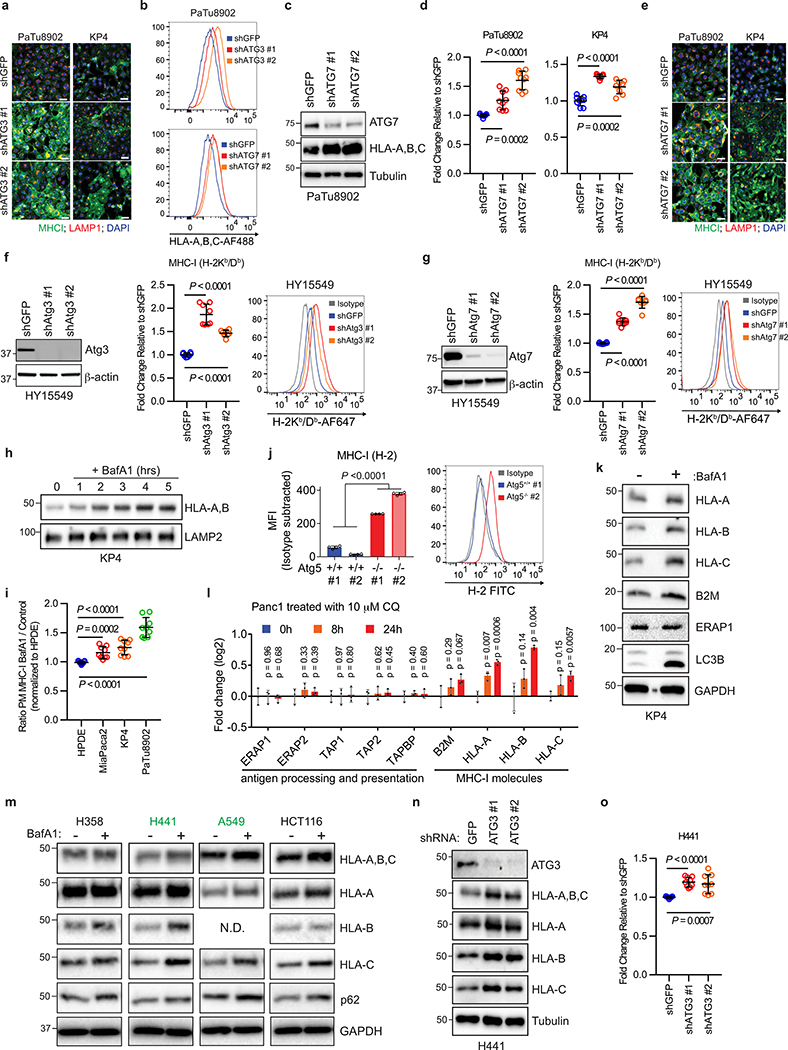
Human PDAC cell lines expressed heterogeneous levels of total MHC-I protein (Fig. 1a), and importantly, exhibited a punctate cytoplasmic distribution of MHC-I which co-localized with lysosomes (Fig. 1b). In contrast, non-transformed human pancreatic ductal epithelial (HPDE) cells showed predominant localization of MHC-I on the plasma membrane (Fig. 1b). Indeed, MHC-I molecules were highly enriched in PDAC lysosomes as compared to HPDE lysosomes (Fig. 1c, Extended Data Fig. 1a). Moreover, lysosomal inhibition resulted in MHC-I accumulation within lysosomes, confirming that MHC-I is actively routed to the lysosome for degradation (Fig. 1d). A substantial fraction of the MHC-I puncta also co-localized with LC3B-labeled autophagosomes in PDAC cells, consistent with the elevated autophagy levels in PDAC9–11 (Fig. 1e, Extended Data Fig. 1b). Notably, similar phenotypes were observed in several non-small-cell lung cancer (NSCLC) cell lines (Extended Data Fig. 1c,d). Flow cytometry-based analysis of total intracellular versus plasma membrane MHC-I confirmed a higher relative abundance of intracellular MHC-I in the majority of PDAC cell lines (Fig. 1f). Similarly, surface MHC-I levels were lower in PDAC cells derived from a genetically engineered mouse model (GEMM) of PDAC12 than normal pancreas cells (Extended Data Fig. 1e). Furthermore, immunofluorescence staining revealed that all human PDAC tumours analyzed contained significant regions with intracellular MHC-I localization (Fig. 1g, Extended Data Fig. 1f), supporting our in vitro findings. Together, these data suggest that MHC-I molecules are reduced at the cell surface and predominantly localized within autophagosomes and lysosomes in PDAC. Indeed, autophagy inhibition by ATG3 and ATG7 knockdown as well as lysosomal inhibition with Bafilomycin A1 (BafA1), increased total and plasma membrane MHC-I levels in PDAC cells (Fig. 2a,b, Extended Data Fig. 2a–i). Moreover, surface MHC-I levels of Atg5−/− mouse PDAC cells10 were higher than those of Atg5+/+ PDAC cells (Extended Data Fig. 2j). Importantly, lysosomal inhibition with BafA1 or chloroquine (CQ) increased MHC-I proteins but did not affect those involved in antigen processing and presentation (Extended Data Fig. 2k,l), suggesting that autophagy inhibition would not impair these steps. Similar phenotypes were also observed in several NSCLC cell lines (Extended Data Fig. 2m–o).
Fig. 1 |. MHC-I is enriched in lysosomes of PDAC cells and displays reduced cell surface expression.
a, Levels of MHC-I (HLA-A,B,C) in HPDE and human PDAC cell lines. b, Localization of MHC-I (green) relative to LAMP1 (red) positive lysosomes. Graph shows the percentage co-localization (n = 14–20 fields). Scale, 20 μm. c, Presence of MHC-I in immuno-isolated lysosomes. d, Accumulation of MHC-I in immuno-isolated lysosomes following treatment with E64d/Pepstatin A for 6 hrs. e, Localization of MHC-I (green) relative to LC3B (red) positive autophagosomes. Graph shows the percentage co-localization (n = 14–20 fields). Scale, 20 μm. f, Flow cytometry-based analysis of intracellular versus plasma membrane (PM) MHC-I levels. Graph shows higher intracellular MHC-I relative to plasma membrane MHC-I in PDAC cells (n = 9 replicates pooled from 3 independent experiments per cell line). Data are mean ± s.d. g, Intracellular localization of MHC-I (green) in CK19 positive (red) ducts from patient PDAC specimens. Graph shows the percentage of ducts showing intracellular MHC-I localization. Scale, 20 μm. A representative of at least two independent experiments is shown in a,c,d. For box-and-whisker plots (b,e), centerlines indicate median and whiskers represent minimum and maximum values. P values determined by unpaired two-tailed t-tests. See Source Data for exact n for b,e. For gel source data of a,c,d, see Supplementary Fig. 1.
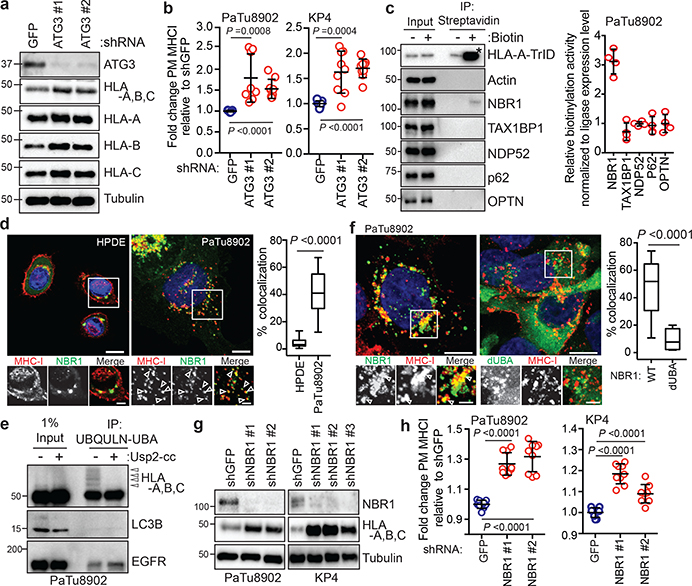
Fig. 2 |. NBR1 promotes MHC-I trafficking to the lysosome through an autophagy dependent pathway.
a, Effect of ATG3 knockdown on HLA-A,B,C levels in PaTu8902 cells. b, Flow cytometry-based quantification of plasma membrane (PM) MHC-I (HLA-A,B,C) levels (PaTu8902, n = 9, 8, 9; KP4, n = 9 per group; data pooled from 3 independent experiments) following ATG3 knockdown. c, KP4 cells expressing HLA-A-TurboID-Flag (HLA-A-TrID) were labeled with 10 μM biotin for 30 min. Biotinylation of proteins was detected following streptavidin pull down. Asterisk denotes self-biotinylation of HLA-A-TrID. Graph shows enrichment for each receptor (n = 4 independent experiments). d, Localization of MHC-I (red) relative to GFP-NBR1 (green) in HPDE and PaTu8902 cells. Arrowheads show examples of co-localization. Scale, 20 μm. Graph shows quantification of co-localization (HPDE, n = 23 fields; PaTu8902, n = 20 fields). e, Endogenous ubiquitylated proteins were affinity captured from PaTu8902 cells with UBQLN1 UBA conjugated beads. Arrowheads indicate MHC-I polyubiquitylation. Treatment of affinity captured samples for 1 hr with purified Usp2-cc (+) to induce deubiquitylation leads to loss of MHC-I polyubiquitylation. Control proteins: LC3B (no ubiquitylation) and EGFR (mono-ubiquitylation). f, Endogenous MHC-I co-localizes with WT GFP-NBR1 but not GFP-NBR1 lacking its UBA domain (dUBA). Graph shows quantification of colocalization (GFP-NBR1; n = 17 fields; GFP-NBR1 dUBA; n = 14 fields). Scale, 20 μm (inset 10 μm). g, Effect of NBR1 knockdown on MHC-I levels. h, Flow cytometry-based quantification of PM MHC-I (n = 9 replicates from 3 independent experiments) following NBR1 knockdown. Scale bar, 50 μm (d,f). A representative of at least two independent experiments is shown in a,e,g. Data are mean ± s.d. (b,c,h). For box-and-whisker plots (d,f), centerlines indicate median and whiskers represent minimum and maximum values. P values determined by unpaired two-tailed t-tests. For gel source data of a,c,e,g, see Supplementary Fig. 1.
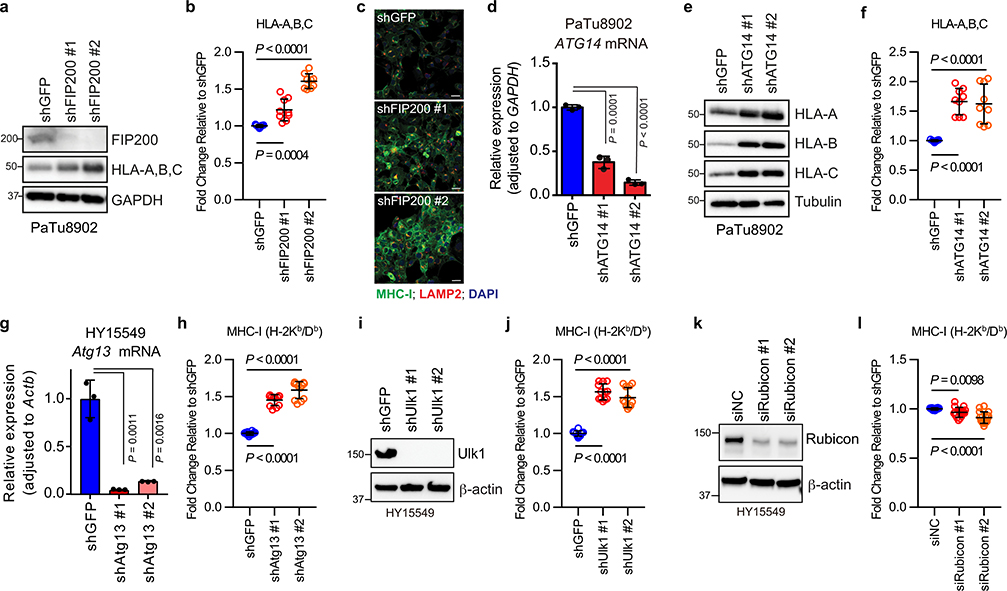
Recent studies have revealed non-canonical functions for a subset of autophagy proteins in alternate trafficking pathways such as LC3-associated phagocytosis (LAP)13 and endocytosis (LANDO)14. Knockdown of FIP200, which is required for autophagy but not for LAP/LANDO, led to an increase in MHC-I levels (Extended Data Fig. 3a–c). Similarly, knockdown of ATG14, Atg13 or Ulk1, all required for autophagy but dispensable for LAP, increased surface MHC-I levels (Extended Data Fig. 3d–j). In contrast, no obvious increase in surface MHC-I was observed upon knockdown of Rubicon, which is required for LAP/LANDO but not for autophagy (Extended Data Fig. 3k,l). Collectively, these data suggest a specific role for macroautophagy in the trafficking of MHC-I to the lysosome.
NBR1 mediates selective autophagy of MHC-I
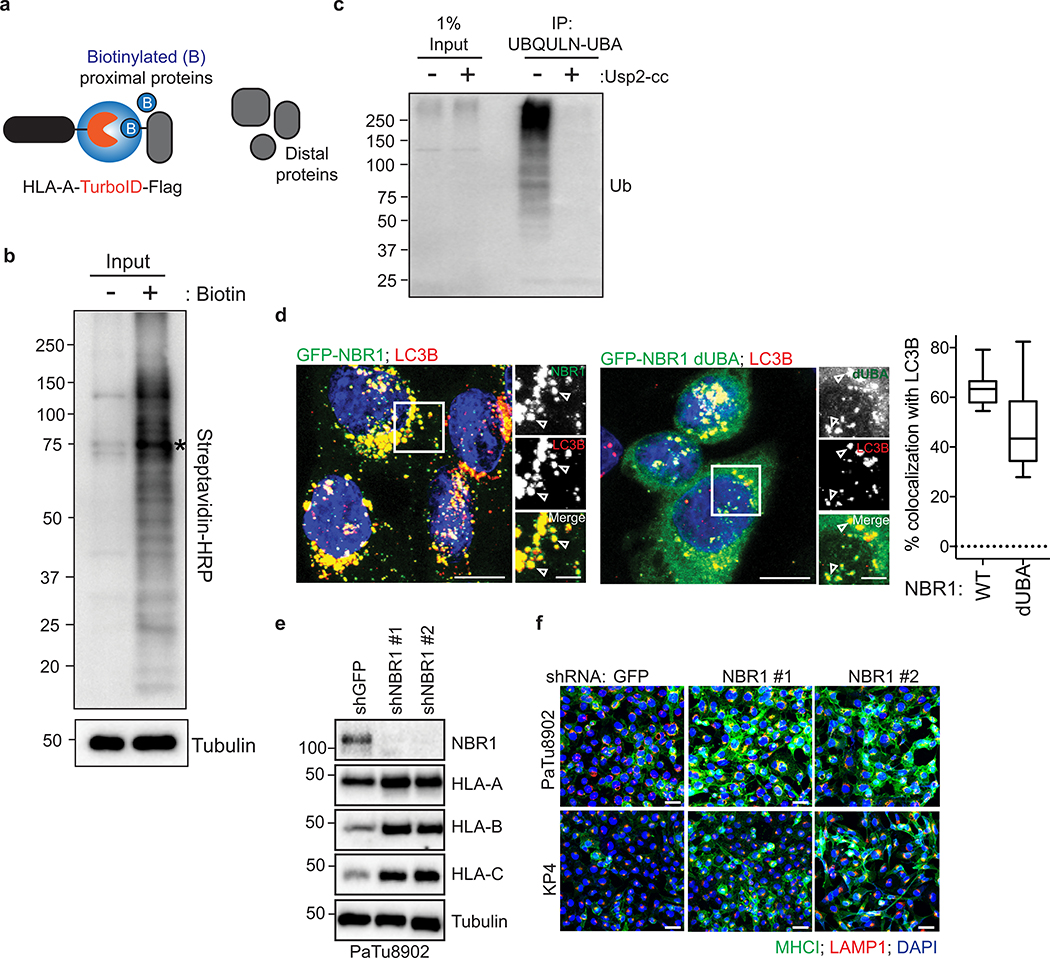
Recent studies have revealed that autophagy can selectively degrade target molecules using autophagy cargo receptor proteins that bind to and recruit substrates to autophagosomal membranes15. To identify autophagy receptor protein(s) involved in MHC-I degradation in PDAC cells, we generated a proximity biotinylation assay whereby HLA-A was fused to the biotin ligase, TurboID (TrID)16 and Flag (HLA-A-TrID). Upon biotin addition, HLA-A-TrID covalently tags endogenous proteins within a few nanometers of the ligase with biotin (Extended Data Fig. 4a,b). Among the autophagy receptors tested, only NBR1 showed significant biotinylation, indicating that NBR1 interacts with MHC-I (Fig. 2c). Additionally, immunofluorescence revealed more frequent co-localization between NBR1 and MHC-I in PDAC cells relative to HPDE cells (Fig. 2d). NBR1 has been shown to interact with and target ubiquitylated substrates for degradation17. Indeed, MHC-I is poly-ubiquitylated in PDA cells (Fig. 2e, Extended Data Fig. 4c) while LC3B is not ubiquitylated and EGFR is mono-ubiquitylated as previously described18. Accordingly, NBR1 lacking its ubiquitin-associated (UBA) domain failed to co-localize with MHC-I, despite retaining localization with LC3B (Fig. 2f, Extended Data Fig. 4d). Finally, NBR1 knockdown increased total and plasma membrane MHC-I levels in PDAC cells (Fig. 2g,h, Extended Data Fig. 4e,f), confirming a role for NBR1 in MHC-I regulation. Together, these data demonstrate that surface MHC-I is decreased in PDAC via an NBR1 mediated autophagy-lysosomal pathway.
Autophagy inhibition enhances anti-tumour immunity
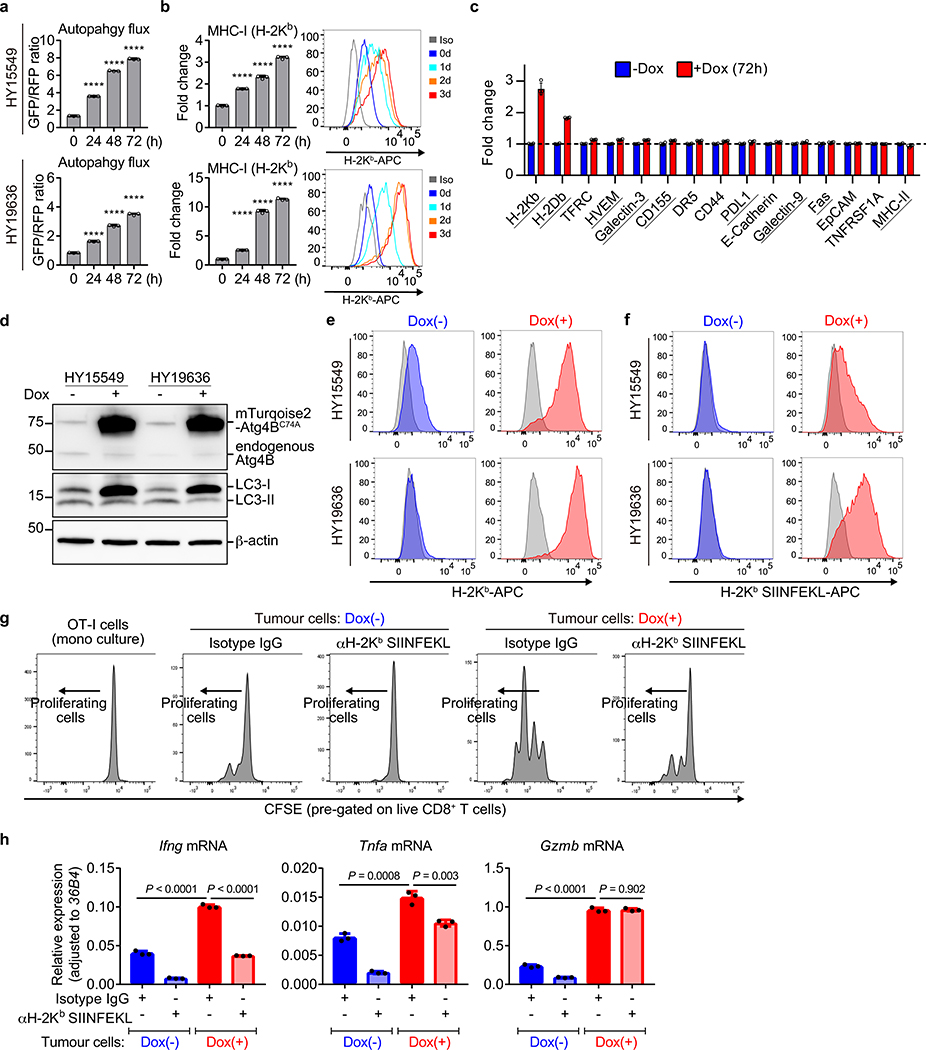
CD8+ cytotoxic T cells play critical roles in anti-tumour immunity. We hypothesized that reduced surface MHC-I levels on PDAC cells may facilitate their evasion from CD8+ T cells, which recognize tumour antigens presented by MHC-I. To test this, we used mouse PDAC cells derived from C57Bl/6 mice and engineered them to express a doxycycline (Dox)-inducible dominant-negative mutant of Atg4B (Atg4BC74A), which potently inhibits autophagy12,19. Dox treatment efficiently inhibited autophagy and increased surface MHC-I levels (Extended Data Fig. 5a,b) but did not affect other cell surface molecules, such as those that are immune inhibitory (Extended Data Fig. 5c). These data support a specific mechanism that links surface MHC-I levels and autophagy.
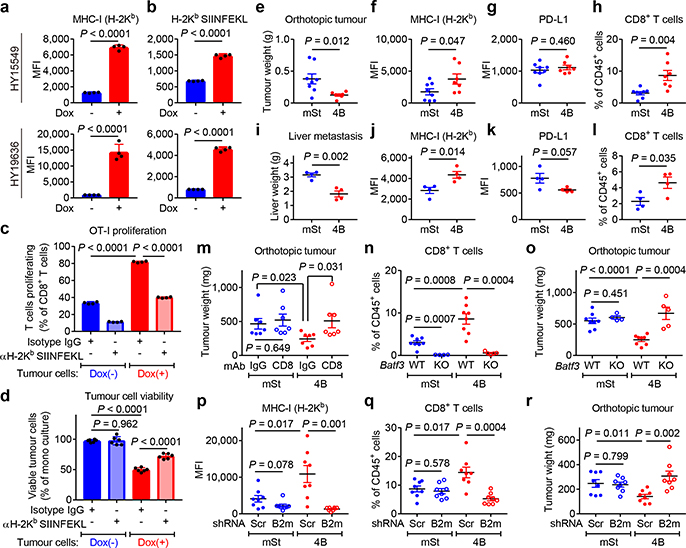
To evaluate antigen presentation, the model neoantigen ovalbumin (OVA) was expressed in mouse PDAC cells carrying Dox-inducible Atg4BC74A (Extended Data Fig. 5d). Dox treatment increased surface expression of both MHC-I and OVA-derived peptide SIINFEKL bound to H-2Kb, confirming enhanced peptide presentation (Fig. 3a,b, Extended Data Fig. 5e,f). OVA-specific CD8+ T cells (OT-I cells) co-cultured with Dox-pretreated PDAC cells showed higher proliferation and expression of Interferon-γ and TNF-α than those co-cultured with non-pretreated PDAC cells (Fig. 3c, Extended Data Fig. 5g,h). Accordingly, Dox-pretreated PDAC cells showed reduced viability upon co-culture with OT-I cells (Fig. 3d), indicating enhanced T cell mediated tumour cell killing. Importantly, these effects were MHC-I specific, as a SIINFEKL-H-2Kb blocking antibody partially inhibited OT-I proliferation and rescued PDAC cell viability in the setting of autophagy inhibition (Fig. 3c,d). Collectively, these results indicate that tumour-specific autophagy inhibition leads to increased antigen presentation, which enhances CD8+ T cell proliferation, activation and tumour cell killing in vitro.
Fig. 3 |. Autophagy inhibition enhances anti-tumour T cell response.
a,b, Surface H-2Kb (a) and H-2Kb-SIINFEKL (b) measured by flow cytometry. Mouse PDAC cells expressing OVA and Dox-inducible mTurquoise2-Atg4BC74A were grown as organoids and treated ± Dox (1 μg/mL) for 96 hrs (n = 4 per group). c,d, Co-culture of OT-I cells with HY19636 cells shown in a,b. After 48 hrs, OT-I proliferation was measured by CFSE dilution (c) (n = 4 per group) and PDAC cell viability was measured by Cell-Titer Glo (d) (n = 6 per group). e-r, HY15549 cells carrying Dox-inducible mStrawberry (mSt) or mSt-Atg4BC74A (4B) were orthotopically (e-h, m-r) or intrasplenically (i-l) injected into syngeneic mice (C57BL/6). MHC-I and PD-L1 expression on PDAC cells (f,g,j,k,p) and tumour-infiltrating CD8+ T cells (h,l,n,q) quantified by flow cytometry. e-h, Orthotopic tumours harvested on day 20 (mSt, n = 8; 4B, n = 7). i-l, Livers harvested on day 15 (n = 4 per group). Weight of tumours (e) and livers (i). Flow cytometry analysis (f-h, j-l). m, Weight of tumours following treatment with isotype control IgG or neutralizing monoclonal antibody against CD8 (n = 7 per group). n,o, Tumours in wild type mice (WT) or Batf3−/− mice (KO) (n = 8, 4, 8, and 5; left to right). Quantification of CD8+ T cells (n). Tumour weight (o). p-r, Tumours expressing control shRNA (Scr) or shRNA against B2m (n = 8 per group) harvested on day 20. Flow cytometry analysis (p,q). Tumour weight (r). Data are mean ± s.d. (a-d) or s.e.m. (e-r). n indicates biological replicates (a-d) or individual mice (e-r). For a-m, p-r, experiments were performed at least twice and representative data of one experiment are shown. P values determined by unpaired two-tailed t-tests.
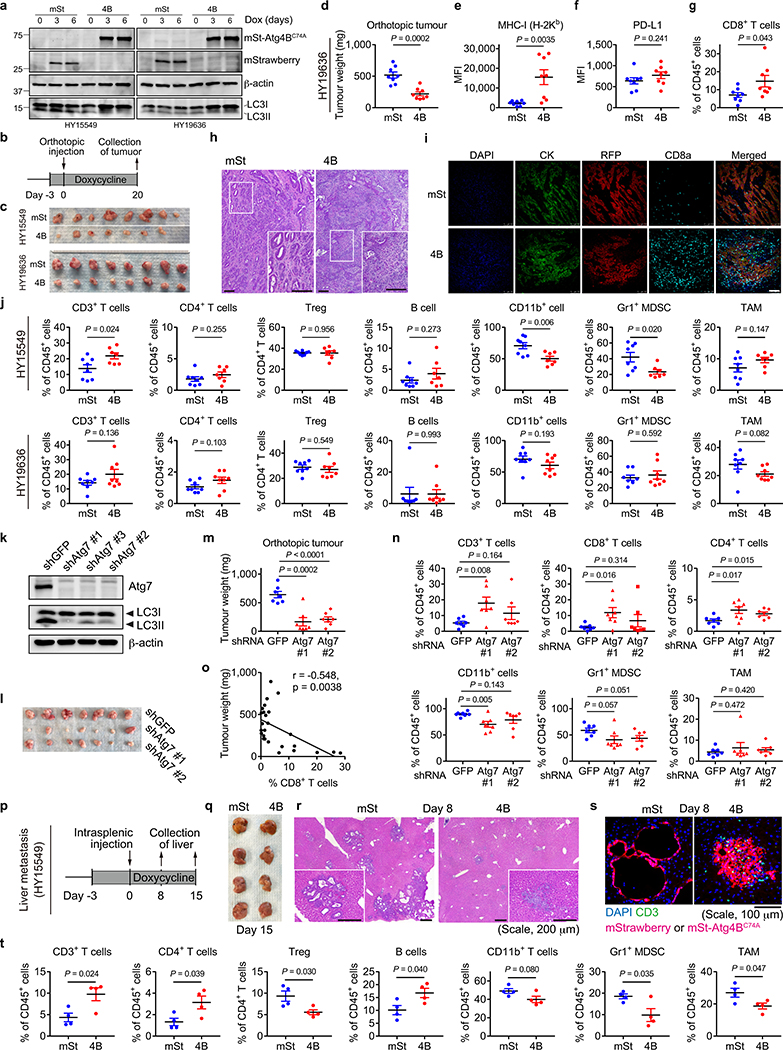
To test the impact of autophagy inhibition on anti-tumour immune responses in vivo, mouse PDAC cells expressing Dox-inducible mStrawberry (mSt) or mSt-Atg4BC74A (4B) (Extended Data Fig. 6a) were orthotopically transplanted into syngeneic (C57BL/6) mice. Autophagy-inhibited cells (4B) formed smaller tumours with higher MHC-I expression than control cells (mSt) while PD-L1 expression was unchanged (Fig. 3e–g, Extended Data Fig. 6b–f and 7k). Moreover, autophagy-inhibited tumours (4B) exhibited a significant increase in infiltrating CD8+ T cells and a decrease in myeloid derived suppressor cells (MDSC), a major immunosuppressive cell type in PDAC tumours (Fig. 3h, Extended Data Fig. 6g–j)20. Similarly, knockdown of Atg7 resulted in a significant reduction in tumour burden and an increase in tumour-infiltrating T cells (Extended Data Fig. 6k–n). Notably, there was a significant correlation between smaller tumour sizes and increased CD8+ T cell infiltration (Extended Data Fig. 6o), supporting a role of T cell immunity in control of autophagy-deficient tumours. Similar results were obtained in a liver metastasis model: mice injected with autophagy-inhibited cells (4B) exhibited lower metastatic burden, higher MHC-I expression on cancer cells, and more tumour-infiltrating CD8+ T cells than mice injected with control cells (mSt) (Fig. 3i–l, Extended Data Fig. 6p–t). Together, these results confirm that autophagy-inhibition restores surface MHC-I levels on cancer cells and enhances anti-tumour T cell response in vivo.
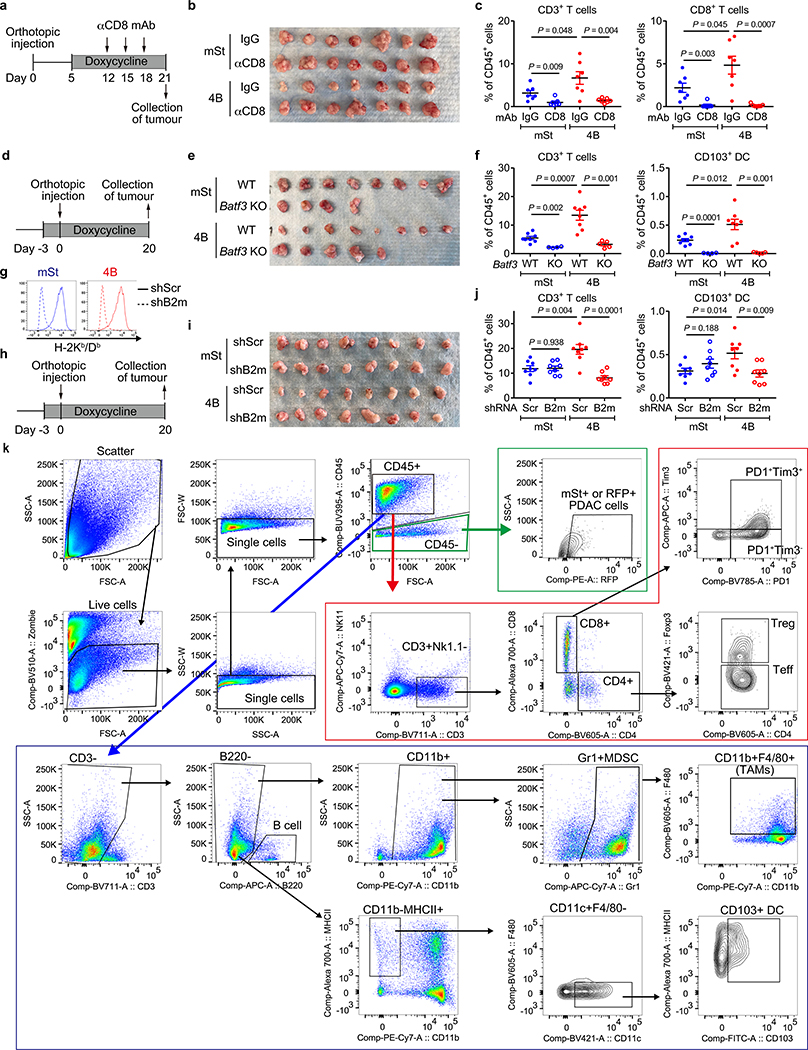
Importantly, antibody-mediated CD8+ T cell depletion restored the growth of autophagy-inhibited tumours (4B) (Fig. 3m, Extended Data Fig. 7a–c), confirming the role of CD8+ T cells in tumour control. We also find that mice deficient for CD103+ dendritic cells (DCs; Batf3−/−)21, which play pivotal roles in CD8+ T-cell priming22 and recruitment into tumours20,23, showed almost complete loss of tumour-infiltrating CD8+ T cells (Fig. 3n, Extended Data Fig. 7d–f). Accordingly, growth of autophagy-inhibited tumours (4B) was restored in Batf3−/− mice (Fig. 3o). These results indicate that the anti-tumour effects of tumour-specific autophagy inhibition are mediated, at least in part, by CD8+ T cells, and this process requires CD103+ DCs.
Finally, to confirm the impact of increased MHC-I expression following autophagy inhibition on tumour growth in vivo, cell surface MHC-I was depleted by knocking down beta-2 microglobulin (B2m), a critical component of the MHC-I complex (Extended Data Fig. 7g). B2m knockdown led to MHC-I depletion in vivo, decreased the number of CD8+ T cells in autophagy-inhibited tumours (4B), and rescued the growth of autophagy-inhibited tumours (4B)(Fig. 3p–r, Extended Data Fig. 7h–k). We also found that tumour-infiltrating CD103+ DCs, which are increased in autophagy-inhibited tumours (4B), were decreased following B2m knockdown (Extended Data Fig. 7f,j). This is in line with a recent study showing that MHC-I-restricted antigen-recognition by CD8+ T cells can trigger DC activation, which further augments CD8+ T cell recruitment into the tumour24. Overall, these data indicate that increased surface MHC-I expression on PDAC cells following tumor-specific autophagy inhibition is a prerequisite for increased CD8+ T cell infiltration and tumor cell killing.
Basal autophagy determines immunogenicity
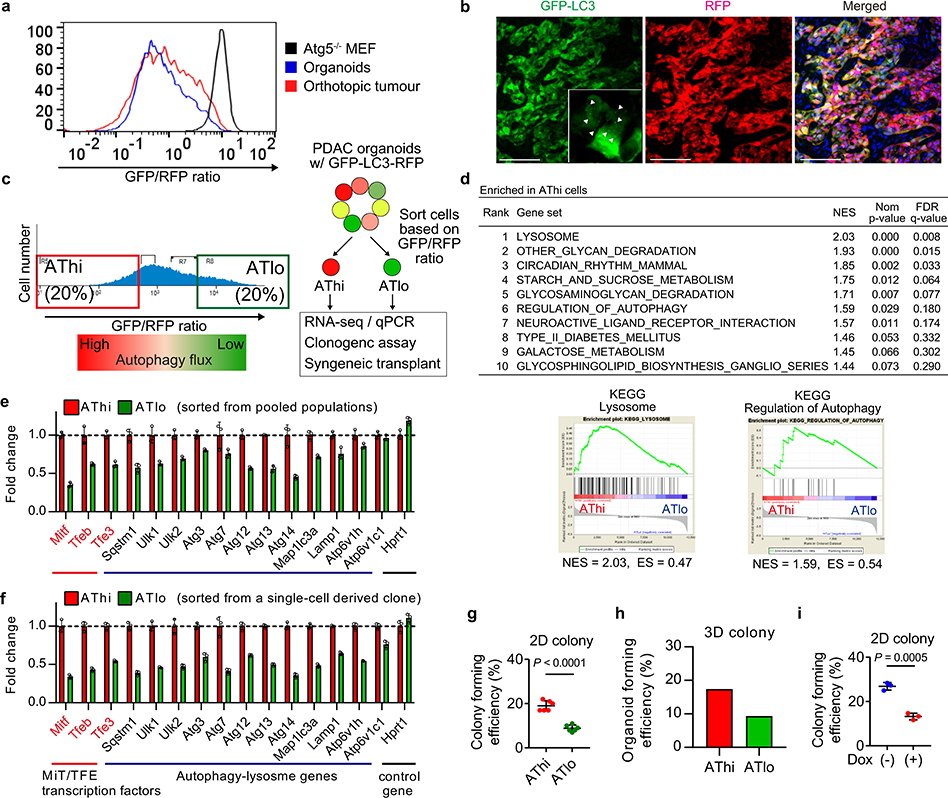
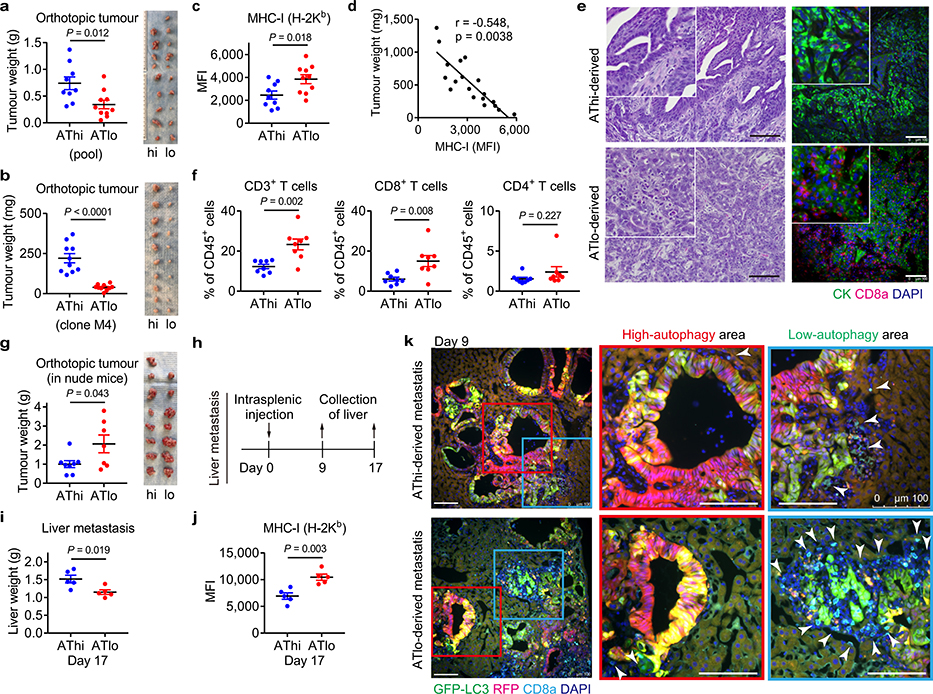
Our data prompted us to hypothesize that basal autophagy flux might determine the immunogenicity of PDAC cells. Mouse PDAC cells grown as organoids25 exhibited considerable heterogeneity in autophagy flux, which closely resembled that of orthotopic tumours (Extended Data Fig. 8a, b). Taking advantage of this heterogeneity, PDAC cells with the lowest and highest 20% of GFP/RFP ratio were isolated as the autophagy-high (AThi) and -low (ATlo) cells (Extended Data Fig. 8c). Transcriptome analysis confirmed upregulation of autophagy/lysosome related genes and the MiT/TFE transcription factors, master regulators of autophagy/lysosome gene expression11, in the AThi population (Extended Data Fig. 8d,e). Importantly, AThi and ATlo cells derived from a clonal population showed a similar transcriptional profile (Extended Data Fig. 8f), suggesting that diversities in basal autophagy flux arise not from genetic variations but instead from heterogeneous expression of the autophagy/lysosome gene program11.
Consistent with the cell-autonomous roles of autophagy in PDAC9,10, ATlo cells exhibited reduced clonogenic capacity in vitro (Extended Data Fig. 8g,h), a result similar to the decreased clonogenic growth of Atg4BC74A expressing cells (Extended Data Fig. 8i). Upon orthotopic transplantation into syngeneic hosts, ATlo cells gave rise to smaller tumours than AThi cells (Extended Data Fig. 9a). Importantly, this was reproduced using cells sorted from a clonal population (Extended Data Fig. 9b), suggesting that tumour-cell intrinsic factors account for the observed phenotypes rather than differences in retroviral-vector integration sites or copy numbers of the reporter. Furthermore, ATlo-derived tumours exhibited higher MHC-I expression and more tumour-infiltrating CD8+ T cells, which inversely correlated with tumour weight, compared to AThi-derived tumours (Extended Data Fig. 9c–f). This growth advantage of AThi-derived tumours was lost in nude mice (Extended Data Fig. 9g), confirming a role of T cells in the suppression of ATlo-derived tumours. In the liver metastasis model, mice injected with ATlo cells exhibited lower metastatic burden and higher MHC-I expression on PDAC cells than mice injected with AThi cells (Extended Data Fig. 9h–j). Notably, CD8+ T cells tended to accumulate around PDAC cells with low-autophagy flux, while CD8+ T cells were scarce around PDAC cells with high-autophagy flux (Extended Data Fig. 9k). These results, along with the data in autophagy inhibition models, indicate that autophagy is a critical determinant of immunogenicity in PDAC cells.
Autophagy inhibition sensitizes PDAC to dual ICB
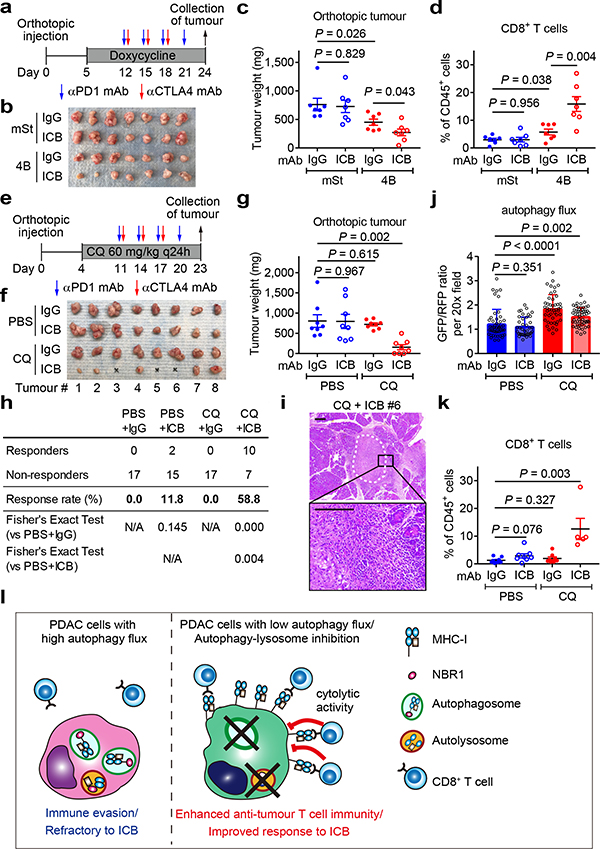
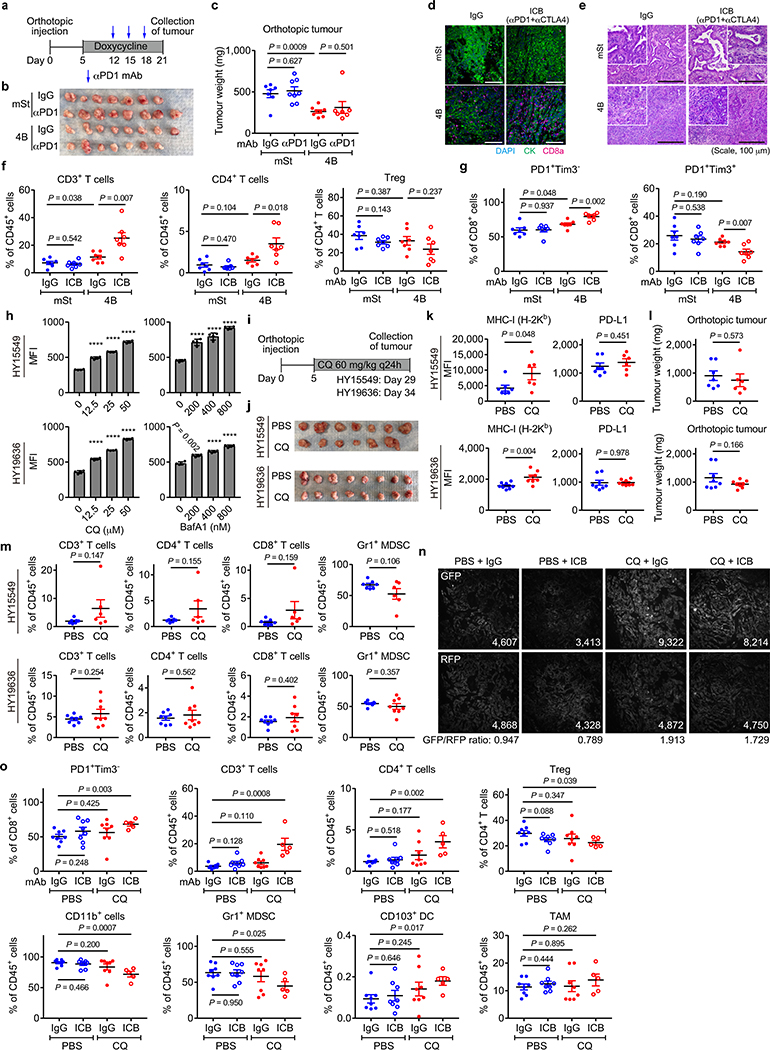
PDAC is refractory to immune checkpoint blockade (ICB)4. To test if autophagy inhibition might sensitize PDAC to ICB, we treated established syngeneic orthotopic tumours with anti-PD-1 antibody alone or dual ICB (anti-PD-1/CTLA4 antibodies). Consistent with a recent clinical trial4, control tumours (mSt) did not respond to either treatment. In contrast, autophagy-inhibited tumours (4B) responded significantly to dual ICB (Fig. 4a–c), but not to anti-PD-1 antibody alone (Extended Data Fig. 10a–c). These tumours showed increased infiltration with bulk CD8+ T cells and PD1+Tim3− cells (Fig. 4d, Extended Data Fig. 10d–g), which retain greater function than the most severely exhausted/dysfunctional PD1+Tim3+ cells26. These results indicate that tumour-specific autophagy inhibition sensitizes PDAC tumours to dual ICB.
Fig. 4 |. Autophagy inhibition sensitizes PDAC to dual ICB.
a-d, Mice bearing orthotopic tumors (HY15549) expressing Dox-inducible mSt or 4B received isotype control IgG or dual ICB (anti-PD1/CTLA4 monoclonal antibodies; mAb) (n = 7 per group). Study design (a). Images (b) and weight (c) of tumours. Quantification of tumour-infiltrating CD8+ T cells by flow cytometry (d). e-k, Mice bearing orthotopic tumours (HY15549) expressing GFP-LC3-RFP reporter received CQ and ICB (n = 8 per group). Study design (e). Images (f) and weight (g) of tumours. No macroscopic tumour was identified in three animals receiving CQ + dual ICB (#3, 5, and 6). h, Response rates from two independent experiments. Response is defined as more than 80% reduction in tumour weight as compared with control tumours (PBS + IgG). i, Representative H&E images of the pancreas undergoing tumour regression (# 6). White dashed line indicates tumour remnants. Scales, 250 and 100 μm. j, Autophagy flux represented by GFP/RFP ratio per 20x field (n = 49, 39, 47 and 54; left to right). Increased GFP/RFP ratio indicates reduced autophagy flux. k, Quantification of tumour-infiltrating CD8+ T cells by flow cytometry (n = 8, 8, 8, and 5; left to right). l, In PDAC cells, surface MHC-I is downregulated by active degradation through the autophagy/lysosome system, contributing to the primary resistance to ICB. NBR1 binds to MHC-I, facilitating its trafficking to autophagosomes (left). Inhibition of autophagy or the lysosome restores surface MHC-I expression, leading to enhanced anti-tumour T cell immunity and improved response to ICB (right). Data are mean ± s.e.m. (c,d,g,k) or s.d. (j). n indicates individual mice (c,d,g,k) or individual 20x fields (j). All experiments were performed twice and representative data of one experiment are shown. P values determined by unpaired two-tailed t-tests.
Finally, we assessed the translatability of our findings to systemic autophagy inhibition using chloroquine (CQ), a clinically available antimalarial agent that inhibits acidification of the lysosome and has been used to inhibit autophagy in patients27–29. Treatment with lysosomal inhibitors CQ or BafA1 increased surface MHC-I levels in mouse PDAC cells in vitro (Extended Data Fig. 10h). CQ treatment also increased surface expression of MHC-I, but not PD-L1, in orthotopic tumours (Extended Data Fig. 10i–k). However, CQ monotherapy failed to significantly reduce tumour weight or increase T cell infiltration (Extended Data Fig. 10l,m), possibly due to the unfavorable pharmacokinetics of this drug in vivo27. Strikingly, the combination of CQ and dual ICB (CQ + ICB) exerted potent anti-tumour activity (Fig. 4e–i) and a reduction in autophagy flux was confirmed in CQ-treated tumours (Fig. 4j, Extended Data Fig. 10n). Moreover, CQ + ICB treated tumours exhibited increased CD8+ T cell infiltration (Fig. 4k) and an increase in functional PD-1+Tim3− CD8+ T cells (Extended Data Fig. 10o). Overall, these data indicate that autophagy inhibition, either in cancer cells alone or systemically, sensitizes PDAC tumours to dual ICB (Fig. 4l).
Discussion
Our results suggest that autophagy is a critical regulator of immunogenicity in PDAC cells. This is in line with a recent study showing the lysosomal pathway as strongly correlated with reduced CD8+ T cell infiltration in human PDAC30. Additionally, autophagy-related genes are enriched in MHC-I negative PDAC cells that reside in liver metastasis8, also suggesting a role for autophagy as a negative regulator of MHC-I. Given the critical roles for the autophagy/lysosome system in supporting PDAC metabolism and growth9,11, our data on immune evasion adds to the growing list of cell-autonomous and non-cell-autonomous functions of the autophagy/lysosome system in PDAC pathogenesis10,12.
We found that systemic autophagy inhibition by CQ, as well as tumour-specific autophagy inhibition, sensitizes PDAC to dual ICB. In addition, recent evidence accounts for the improved therapeutic effects of systemic autophagy inhibition: First, host autophagy supports tumour growth by providing nutrients31–33. Second, loss of autophagy proteins or CQ treatment increases surface MHC-I levels in dendritic cells, leading to enhanced CD8+ T cell response in virus infection models34. Also, autophagy inhibition directly enhances anti-tumour activity of CD8+ T cells35. Lastly, loss of LAP, a process also inhibited by CQ, polarizes tumour-associated macrophages (TAMs) into a tumour suppressive phenotype (M1), promoting anti-tumour T cell responses13. In line with these, recent clinical trials have shown that hydroxychloroquine, a derivative of CQ, has activity in PDAC patients28,29. Whether the addition of ICB would be synergistic remains to be determined.
In this study, we focused on CD8+ T cells, given their direct interaction with MHC-I on cancer cells. However, we also observed changes in other immune cells such as MDSCs, CD4+ T cells and CD103+ DCs upon autophagy inhibition. Investigating how these and changes in other immune cell types are mediated, such as the potential involvement of secreted proteins from PDAC cells upon autophagy inhibition, will be important subjects of future work.
Despite the evidence mentioned above and recent work demonstrating that autophagy inhibition does not impair anti-tumour adaptive immunity36, autophagy inhibition has also been reported to effect some aspects of the immune system such as memory formation in virus specific CD8+ T cells and CD4+ T cell priming by DCs37,38 and may impair chemotherapy-induced immunogenic cell death39. Therefore, further studies will be needed to define more subtle aspects of the immune response upon autophagy inhibition and how to best combine autophagy/lysosome blockade with cytotoxic and immune based therapies. For instance, deeper insights into the potential impact of basal immunogenicity40 on response to autophagy inhibition, the differences in mutational burden in mouse and human tumors41, the impact of potential dominant antigens in experimental systems41, and the heterogeneity described here in terms of MHC-I expression in patients will likely contribute to the successful clinical translation of our findings. Importantly, the mechanistic insights described here regarding how autophagy can promote immune evasion, provide strong rationale to pursue these studies with the ultimate goal of developing new therapeutic approaches for PDAC patients.
Methods
Cell culture
The cell lines PaTu-8988T, KP4, MiaPaca2, Panc 2.03, PaTu-8902, Panc1, AsPc1, HupT3, A549 were obtained from the American Type Culture Collection (ATCC) or the DSMZ. H441, H358, HCT116 and BEAS-2B were provided by Eric Collisson, UCSF. HPDE was provided by Ming Tsao42. Cells were cultured in the following media: PaTu-8988T, KP4, MiaPaca2, PaTu-8902, Panc1, AsPc1 and BEAS-2B in DMEM supplemented with 10% FBS; Panc 2.03 and HupT3 in RPMI with 10% FBS; HPDE cells were cultured in keratinocyte serum-free (KSF) medium supplemented by epidermal growth factor and bovine pituitary extract (Life Technologies, Inc., Grand Island, NY), supplemented with 1% Pen/Strep (Gibco). Cell lines were regularly tested and verified to be mycoplasma negative using MycoAlert Detection Kit (Lonza) or via PCR.
Primary murine PDAC cell lines were established from pancreatic tumours in respective GEMMs as described previously12. HY15549 and HY19636 cells were established from female KPC mice (p48-Cre+, KrasLSL-G12D/+, Trp53lox/+)43 that were fully backcrossed into a C57BL/6 background. The other cell lines were derived from the following animals10,12: Atg5+/+ KPC cells, Pdx1-Cre+, KrasLSL-G12D/+, Trp53lox/+, Atg5+/+ mice; Atg5−/− KPC cells, Pdx1-Cre+, KrasLSL-G12D/+, Trp53lox/+, Atg5lox/lox mice; AY6284 cells, p48-Cre+, KrasLSL-G12D/+, Trp53lox/+, RosaLSL-rtTA, mSt-Atg4BC74A mice12. All mice PDAC cells were maintained in DMEM (Corning) supplemented with 10% FBS (Atlanta Biologicals S11550H) and 1% Pen/Strep (Gibco).
Cells were grown in a humidified incubator with 5% CO2 at 37°C. Cultures were routinely verified to be negative for mycoplasma. Cell lines were authenticated by fingerprinting, and low passage cultures were carefully maintained in a central lab cell bank.
Constructs
GFP-NBR1 and GFP-NBR1 dUBA were provided by Jayanta Debnath. LysoTag - TMEM192-mRFP-3xHA (TMRHA) - was generated by subcloning the cDNA of TMEM192 (Origene) together with monomeric Red Fluorescent Protein (mRFP) and 3xHA tag into the NheI and EcoRI sites of pLJM1 lentiviral vector. HLA-A-TurboID-FLAG (HLA-A-TrID) was generated by subcloning the cDNA of HLA-A (Addgene plasmid, #85162) into the EcoRI and NotI sites of the TurboID pLVX vector (gift from Roberto Zoncu, UC Berkeley). pMXs GFP-LC3-RFP was a gift from Noboru Mizushima (Addgene, plasmid #117413). For Dox-inducible expression of Atg4BC74A, mTurquoise2 or mStrawberry was fused to Atg4BC74A and inserted into either pSLIK-Hygro (used for in vitro studies) (Addgene, plasmid #25737) or pINDUCER20 (used for in vivo studies) (Addgene, plasmid #44012), using the Gateway Cloning system (Thermo Fisher Science). For the generation of OVA-expressing cells, the cOVA fragment was cloned from pCI-neo-cOVA (Addgene, plasmid #25097), fused with 2A peptide and mStrawberry sequences using NEBuilder HiFi DNA Assembly Cloning Kit (New England BioLabs) according to manufacturer’s instruction, and inserted into the EcoRI and SalI sites of pBabe-zeo (Addgene, plasmid #1766) to generate pBabe-cOVA-2A-mStrawberry. Stable cOVA expression was confirmed and monitored with mStrawberry fluorescence.
shRNAs
shRNA vectors (pLKO.1 puro) were obtained from the Sigma MISSION TRC shRNA library. The sequences and RNAi Consortium clone IDs for the shRNAs used are as follows:
shATG3#1 (human): 5’-GATGTGACCATTGACCATATT-3’ (TRCN0000148120); shATG3#2 (human): 5’-GCTGTCATTCCAACAATAGAA-3’ (TRCN0000147381); shATG7#1 (human): 5’-CCCAGCTATTGGAACACTGTA-3’ (TRCN0000007587); shATG7#2 (human): 5’-GCCTGCTGAGGAGCTCTCCAT-3’ (TRCN0000007584); shNRB1#1 (human): 5’-GCTTCATAGTTATTTGGCATT-3’ (TRCN0000123159); shNBR1#2 (human): 5’-GCAGCATTTGTGGATGAGAAT-3’ (TRCN0000123160); shNBR1#3 (human): 5’GCCAGGAACCAAGTTTATCAA-3’ (TRCN0000123161); shFIP200#1 (human): 5’- GCACTCTTTAACACATTCTTT-3’ (TRCN0000013523); shFIP200#2 (human): 5’- GCTGTGAATGAGTTTGTAATA-3’ (TRCN0000013524); shATG14#1 (human): 5’-CCATAGAACTTGGTCATGTTT-3’ (TRCN0000144080); shATG14#2 (human): 5’-GATCAATTACAACCACTGCAT-3’ (TRCN0000145367); shAtg3#1 (mouse): 5’-CATATCACAACACAGGTATTA-3’ (TRCN0000247440); shAtg3#2 (mouse): 5’- GTACATCACTTACGACAAATA-3’ (TRCN0000247442); shAtg7#1 (mouse): 5’-TTCTGTCACGGTTCGATAATG-3’ (TRCN0000305991); shAtg7#2 (mouse): 5’- GCCAACATCCCTGGATACAAG-3’ (TRCN0000375444); shAtg7#3 (mouse): 5’- TCTTACCCTGCTCCATCAAGA-3’ (TRCN0000375421); shB2m (mouse): 5’-CCAGTTTCTAATATGCTATAC-3’ (TRCN0000295705); shAtg13#1 (mouse): 5’-TGAAGTCTCTTCTCGCTATTA-3’ (TRCN0000277121); shAtg13#2 (mouse): 5’-GACATACCTTTCGCCATGTTT-3’ (TRCN0000176029); shUlk1#1 (mouse): 5’-CGCTTCTTTCTGGACAAACAA-3’ (TRCN0000319764), shUlk1#2 (mouse): 5’-CGCTTCTTTCTGGACAAACAA-3’ (TRCN0000028768); shGFP: 5’-TGCCCGACAACCACTACCTGA-3’ (TRCN0000072186). shGFP and shScr (Addgene, plasmid #17920) were used as controls.
siRNAs
The siRNAs used in this study are: siNC (Silencer Negative Control #1 siRNA, Thermo, Cat #13778030), siRubicon #1 (s104762, Ambion), and siRubicon #2 (s104763, Ambion). Cells were transfected with siRNAs using Lipofectamine RNAi Max Transfection Reagent (Life Technologies).
Retroviral and lentiviral transduction
For the transfection of pMXs GFP-LC3-RFP44 and pBabe-cOVA-2A-mStrawberry, retrovirus was produced by co-transfection of HEK293FT cells with a retroviral vector and the packaging plasmids pHit60 and VSVG at a 0.5:0.25:0.25 ratio. For the transfection of lentiviral vectors (pSLIK-hygro, pINDUCER20, and pLKO.1-puro), lentivirus was produced by co-transfection of HEK293FT cells with a lentiviral vector and the packaging plasmids psPAX2 (Addgene, plasmid #12260) and pMD2.G (Addgene, plasmid #12259) at a 0.5:0.25:0.25 ratio. Transfection was performed using Lipofectamine 3000 Reagent (Thermo Fisher Scientific) according to manufacturer’s instructions. The viral supernatant was collected 48 hrs after transfection, filtered through a 0.45 μm filter, and used for infection together with Polybrene reagent (EMD Millipore). Cells expressing Dox-inducible constructs were sorted for positive fluorescent expression upon Dox treatment to select inducible cells, and then sorted for no fluorescent expression after Dox withdrawal to remove cells with leaking expression, as described previously8.
Immunofluorescence
Human cell lines were cultured for two days on coverslips coated with fibronectin. After two PBS washes, cells were fixed and permeabilized with paraformaldehyde for 15 min at room temperature or ice-cold methanol for 5 min at −20°C. PFA fixed cells were permeabilized with 0.1% Saponin. Samples were then blocked with 5% normal goat serum for 15 min at room temperature prior to incubation with primary antibodies (Supplementary Table 1) overnight at 4°C. After washing three times with PBS, cells were incubated in secondary antibody at room temperature for 20 min. Slides were mounted on glass slides using DAPI Fluoromount-G (0100–20, SouthernBiotech) and imaged on a Zeiss Laser Scanning Microsope (LSM) 710 using a 63x objective. Image processing and quantification were performed using ImageJ.
Lysosome immunoprecipitation
For lysosome immunoprecipitation experiments, HPDE and human PDAC cell lines stably expressing TMRHA were ruptured and intact lysosomes from 1–2 mg of total protein per sample was immunoprecipitated using HA-conjugated Dynabeads as previously described45,46.
Poly-Ubiquilin UBA affinity capture
Cells were washed twice with ice-cold PBS and lysed in lysis buffer (50 mM Tris-HCl pH 7.5, 150 mM NaCl, 1 % NP-40, 10 mM N-ethylmaleimide) supplemented fresh with protease inhibitor cocktail. Lysates were incubated at 4˚ C for 15 min and clarified by centrifugation at 20,000 xg at 4˚ C for 15 min. Samples were quantified by BCA Protein Assay Kit and diluted to 1 mg/mL with Dilution Buffer (50 mM Tris-HCl, pH 7.5, 150 mM NaCl, 5 mM EDTA, protease inhibitor). 1–1.5 mg of protein lysates were incubated with 50 μl of Ubiquilin 1 Tandem UBA Agarose (BostonBiochem AM-130) overnight at 4˚ C. Samples were then washed 3x in High Salt Wash Buffer (50 mM Tris-HCl pH 7.5, 250 mM NaCl, 0.5 % NP-40) and once with 10 mM Tris-HCl, pH 7.5. Samples were eluted by adding Laemlli buffer and incubating at 65˚ C for 15–20 min.
For DUB digestions, affinity captured material was washed 1x with DUB digestion buffer (50mM Tris-HCl, pH 7.5, 150mM NaCl, 20mM DTT). Liquid was removed and beads were resuspended in 20ml of DUB digestion buffer and 5mg of USP2 catalytic domain (Usp2cc; BostonBiochem E-506) for 1hr with gentle shaking at 30˚ C. Beads were washed once in High Salt Wash Buffer and once with 10 mM Tris-HCl, pH 7.5 prior to eluting affinity captured material by adding Laemmli buffer and incubating at 65 ˚ C for 15min.
Proximity biotinylation
Human PDAC cells stably expressing HLA-A-TrID were cultured in DMEM supplemented with 10% dialyzed FBS (DMEM + dFBS) for 48 h. Cells were incubated with 10 μM Biotin (Sigma) and incubated at 37˚ C for 30 min. Media was replaced with DMEM + dFBS and incubated at 37˚C for a further 2–3 hrs. For negative controls, we omitted exogenous biotin. Cells were then washed 2x in ice-cold PBS and lysed in ice-cold lysis buffer (1 % Triton X-100, 130 mM NaCl, 2.5 mM MgCl2, 2 mM EGTA, 25 mM HEPES pH 7.4, supplemented fresh with protease inhibitor cocktail) for 30 min on ice. Samples were clarified by centrifugation at 13,300 rpm for 10 min at 4˚ C. Protein content was measured using BCA Protein Assay Kit (Life Technologies 23227). 1–2 mg of protein lysates were incubated with 50 μl of Dynabeads MyOne Streptavidin C1 (Life Technologies) overnight. The beads were washed twice in Wash Buffer 1 (2 % SDS in dH2O), once in Wash Buffer 2 (0.1 % deoxycholate, 1 % Triton X-100, 500 mM NaCl, 1 mM EDTA, and 50 mM HEPES, pH 7.5), once in Wash Buffer 3 (250 mM LiCl, 0.5 % NP-40, 0.5 % deoxycholate, 1 mM EDTA, and 10 mM Tris, pH 8.1), and twice in Wash Buffer 4 (50 mM Tris, pH 7.4, and 50 mM NaCl). Washes were performed at RT for 5 min with gentle agitation. Samples were eluted in Laemlli buffer and boiled at 95˚ C. Quantification of biotinylation activity was measured as intensity of each lane in the +/−Biotin immune-precipitation condition divided by the corresponding intensity of the ligase expression band in the input. +Biotin ratios were then normalized to the -Biotin control ratio and to background.
Organoid culture
Murine normal pancreatic organoids were established as described previously25,47 with slight modifications. Briefly, pancreas was harvested from female C57BL/6 mice (4–10 weeks of age), mechanically minced with scissors, and digested with 1 mg/mL Collagenase P (Sigma), 4 mg/mL Dispase II (Sigma), 10 mM HEPES (Thermo Fisher Scientific), 1% FBS, 1 mg/mL Trypsin Inhibitor from Soybean (Sigma) in DMEM for 20 min at 37°C. Digested tissues were embedded in Matrigel (Corning 356231) and cultured in Advanced DMEM (Thermo Fisher Scientific) supplemented with 200 mM L-Glutamine (Thermo Fisher Scientific), 10 mM HEPES (ThermoFisher Scientific), 1% Antibiotic-Antimycotic (Thermo Fisher Scientific), 500 ng/mL recombinant murine Rspondin-1 (Peprotech), 50 ng/mL recombinant murine EGF (Peprotech), 100 ng/mL recombinant murine Noggin (Peprotech), 1 μM Jagged-1 (188–204) (AnaSpec, AS-61298), 100 μg/mL Trypsin inhibitor from soybean (Sigma), and 10 μM Y-27632 (Enzo). Two days before analysis, culture media was replaced with DMEM supplemented with 10% FBS. PDAC organoids were generated by embedding murine PDAC cell lines in Matrigel and were grown in DMEM with 10% FBS. For the dissociation of organoids for further assays, organoids were digested with TrypLE (ThermoFisher, A1217701) solution at a 2x concentration for 20 min at 37°C, followed by filtration through a 40-μm nylon strainer.
Quantitative proteomics
Quantitative mass spectrometry-based proteomics was performed as previously described48,49 based on the SL-TMT workflow50. Briefly, cells were lysed in a lysis buffer (200mM HEPES pH 8.5, 8M Urea, 1x Complete Protease Inhibitor Cocktail (Roche), 1× PhosStop (Roche)) and homogenized by passing through a 21-gauge needle. Lysates were collected by centrifuging at 20,000 × g for 5 min at 4 °C, followed by disulfide bond reduction with 5 mM dithiothreitol at 37°C for 25 min and alkylation with 10mM iodoacetamide at room temperature for 30 min in the dark. Chloroform–methanol precipitation of protein was performed, followed by protease digestion in HEPES buffer (200mM, pH 8.5). Each sample containing 100 μg protein was digested at a 1:100 protease-to-protein ratio with LysC protease at room temperature overnight, followed by digestion with trypsin at 37°C for 6 hrs. Approximately 50 μg of peptides from each sample was labelled with 100 μg TMT reagent which were dissolved in anhydrous ACN to achieve a final concentration of 30 % (v/v). TMT labelled samples was acidified, vacuum centrifuged to near dryness and subjected to C18 SPE (Sep-Pak, Waters). Samples were subjected to basic pH reversed-phase HPLC. Data were obtained with Orbitrap Fusion mass spectrometer (Thermo Fisher Scientific) coupled with a Proxeon EASY-nLC 1000 LC pump (Thermo Fisher Scientific). Peptide separation was done using a custom Accucore C18 resin (2.6 μm, 100Å, ThermoFisher Scientific) column for 3 hrs using a gradient of 6–30% ACN in 0.125% formic acid with a flow rate of 300 nl/min. All analysis involved an MS3-based TMT method as previously mentioned51 and mass spectra was processed as described earlier48.
Tumour cell and OT-I cell co-culture experiment
Mouse PDAC cells stably expressing OVA and carrying doxycycline (Dox)-inducible mTurquoise2-Atg4BC74A were grown as organoids, treated with or without Dox (1 μg/mL) for 96 hrs. Organoids were dissociated into single cells, which were then incubated with either anti-H-2Kb-SIINFEKL antibody (clone 25-D1.16, BioXCell, BE0207) or isotype control (clone MOPC-21, BioXCell, BE0083) at 100 μg/mL for 30 min at 4 °C. Total splenocytes were harvested from OT-I mice and CD8+ T cells were enriched using Dynabeads® Untouched™ Mouse CD8 Cells (Invitrogen, 11417D) following manufacturer’s instructions. Isolated CD8+ T cells were labelled with 10 μM CFSE (BioLegend) for 10 min at RT in the dark, washed 3x with RPMI-1640 supplemented with 10% FBS. Ten thousand PDAC cells and forty thousand CD8+ cells were seeded in 96-well plates and cultured in 100 μL 50% DMEM and 50% RPMI-1640 supplemented with 10% FBS, 10 ng/mL recombinant murine IL-2 (Peprotech), 27.5 μM 2-Mercaptoehanol (Gibco), and 100 μg/mL of respective antibodies. After 48 hrs, CD8+ T cells were harvested and stained with anti-CD8a antibody (AF647, clone 53–6.7, BioLegend) and DAPI, and proliferation was analyzed by CFSE dilution using flow cytometry. After removal of CD8+ T cells, the viability of remaining PDAC cells were measured by CellTiter-Glo (Promega).
Clonogenic assay
For 2D clonogenic assays9, cells were plated in 6-well plates at 300 cells per well in 2 mL DMEM supplemented with 10% FBS. After 7 days, colonies were fixed with 80% methanol, stained with 0.2% crystal violet, and counted. For 3D clonogenic assay, single cells were sorted directly into 384-well round bottom Ultra-Low Attachment plates (Corning 3830) and grown in DMEM supplemented with 10% FBS and 2% Matrigel (Corning 356231). After 10 days, the number of wells with spheroids were counted.
Mice
Female 8–10 week old C57BL/6 mice or NCr nude (B6NTac, Taconic) were used for allograft experiments. OT-I transgenic mice (Cat# 003831) and Batf3−/− mice (Cat# 013755) were purchased from Jackson Laboratory. All mice were bred and maintained in the animal facility of the New York University School of Medicine. All animal procedures were approved by the New York University School of Medicine Institutional Animal Care and Use Committee (IACUC) under protocol numbers IA16–00507 and IA16–01331.
Animal experiments
Orthotopic and intrasplenic injections of PDAC cells were performed as described previously31,52. Briefly, mice were anesthetized by an intra-peritoneal (i.p.) injection of ketamine and xylazine. A small incision was made on the upper left quadrant of the abdomen, and either the pancreas or the spleen was externalized. For orthotopic injection, cells were suspended in 20 μL of Matrigel (Corning 356231): HBSS (1:1) solution and injected into the pancreatic tail with insulin syringes (29-gauge needle, BD 324702). 1 × 10⁴ HY15549 cells or 2 × 10⁴ HY19636 cells were injected unless otherwise indicated. For intrasplenic injection, 1 × 10⁶ cells were suspended in 100 μL HBSS and then drawn into an insulin syringe (28-gauge needle, BD 329461) which were pre-loaded with 200 μL HBSS. The externalized spleen was divided by ligating clips (Teleflex, #002200), and cells were injected into the hemispleen. After injection, splenic vein was ligated with ligating clips (Teleflex, #001200) at the hilum of the spleen, and then the hemispleen was removed. After the procedures, the peritoneum was closed with a 3–0 VICRYL VIOLET suture (Ethicon, J311H), and the skin was closed using the BD AutoClip Wound Closing System (BD). For some experiments, mice were fed with Dox-containing diet (625mg/kg) for the indicated period. Mice were euthanized at the indicated time points and tumours or the liver were collected after trans-cardiac perfusion with PBS.
For CD8+ T cell depletion, mice received i.p. injection of anti-mouse CD8a antibody (200 μg, clone 53–6.7, Cat# BE0004–1) or isotype control (200 μg, clone 2A3, Cat# BE0089). For immune checkpoint blockade experiments, mice received i.p. injection of anti-mouse PD-1 antibody (200 μg, clone RMP1–14, Cat# BE0146) and anti-mouse CTLA-4 antibody (200 μg, Cat# BE0131), or rat IgG2a isotype control (200 μg, clone 2A3, Cat# BE0089) and polyclonal Syrian hamster IgG (200 μg, Cat# BE0087). All antibodies used in in vivo experiments were obtained from BioXCell. For CQ treatment, mice received i.p. injection of CQ solution in PBS at 60 mg/kg or PBS every day starting day 4 or 5 after tumour cell implantation. Mice were randomly assigned to specific treatment groups at the beginning of treatment.
All experiments were carried out in a clean conventional facility, where mice were housed in pre-packaged disposable irradiated cages, and fed with irradiated diet and acidified water. Microisolator cages were located on ventilated racks. No tumours in the mice exceeded IACUC-defined maximum diameters of > 2 cm. Sample sizes were determined based on our preliminary experiments and no sample size calculation was done. Blinding was not perfomred as the investigator needed to know the treatment groups in order to perform study. Tumour weights (an objective measurement) were measured only at the study endpoints after mice were euthanized and tumours were harvested.
Flow cytometry
For surface and intracellular MHC-I staining of human cell lines, cells were stained with Alexa Fluor® 488 anti-human HLA-A, B, C antibody (BioLegend, clone W6/32) at a 1:75 dilution for 45 minutes at 4°C in the dark and washed with PBS plus 2% FBS and 2mM EDTA (FACS buffer). Cells were then fixed and permeabilized prior to staining with PE conjugated anti-human HLA-A, B, C antibody (BioLegend, clone W6/32) at a 1:75 dilution for 45 min at room temperature and washed with FACS buffer. For cell surface molecule staining of mouse cells, single cell suspensions were prepared as described above. Cells were washed with FCM buffer (HBSS containing 1% FBS, 1 mM EDTA, and 10 mM HEPES) and stained with antibodies (Supplementary Table 1) at 4°C in the dark for 20 min. Dead cells were depleted by DAPI staining.
For the immunophenotyping of tumours, tissues were mechanically minced with scissors, and then digested in DMEM containing 1 mg/mL Collagenase IV (Gibco), 100 μg/mL DNase I (Roche), 1% FBS, 10 mM HEPES, 2% Antibiotic-Antimycotic (ThermoFisher Scientific) for 40 min at 37°C in the dark with gentle agitation every 10 min. Digested tissues were then washed twice in DMEM containing 10% FBS, filtered through a 40-μm nylon mesh strainer (Corning). Cells were suspended in ACK Lysing Buffer (ThermoFisher Scientific), incubated for 10 min at 4°C in the dark to remove red blood cells. Cells were washed twice in FCM buffer and counted. Cells were stained with Zombie Aqua Fixable Viability Kit (BioLegend) and blocked with anti-mouse CD16/CD32 antibody (Mouse BD Fc Block™, clone 2.4G2, BD Bioscience). One million cells were incubated with appropriate antibodies (Supplementary Table 1) diluted in FCM buffer at 4°C in the dark for 40 min. Cells were then washed twice with FCM buffer and analyzed or further fixed in 2% PL solution (phosphate-buffered saline (PBS) containing 0.1 M L-Lysine (Sigma) and 2% paraformaldehyde (Ted Pella))53 at 4°C in the dark overnight. Intracellular staining was performed using Foxp3/Transcription Factor Staining Buffer Set (eBioscience). Cells were analyzed on a BD LSR Fortessa or a BD LSR-II UV and analyzed by FlowJo software (FlowJo, LLC, version 10.4). Gating strategies were described in Extended Data Fig. 7k and Supplementary Table 2.
Cell sorting
Mouse PDAC cells (HY15549) expressing the GFP-LC3-RFP reporter were grown as organoids for 8 days, harvested and dissociated into single cells as mentioned above. Cells were sorted on MoFlo XDP (Beckman Coulter) based on the GFP/RFP ratio as described in detail elsewhere54,55. The purity of cells after sorting was confirmed by post-sort analyses and was usually > 90%.
Histology and immunohistochemistry
For formalin fixed paraffin-embedded (FFPE) sections, tissues were fixed in 10% buffered formalin, and embedded in paraffin. 5-μm-thick FFPE sections were used for H&E staining. For immunohistochemical staining, FFPE sections were deparaffinized, rehydrated, and incubated in boiling 10 mM pH 6.0 citrate buffer for 20 min for antigen retrieval. To visualize the GFP-LC3-RFP reporter signal or mStrawberry/mSt-Atg4BC74A expression in PDAC cells, tissues were fixed in 2% PL solution at 4°C overnight, incubated in PBS containing 30% sucrose, and embedded in Tissu-Tek OCT compound (Sakura Finetek) on dry ice53. For immunohistochemical staining, 7-μm frozen sections were washed with Tris-buffered saline (pH 7.4) containing 0.05 % Tween-20 (TBS-T), blocked with TBS-T containing 5% goat serum for 1hr at room temperature (RT), and stained with primary antibodies (Supplementary Table 1) at 4°C overnight, followed by incubation with fluorescent-conjugated secondary antibodies (1:400, Supplementary Table 1) at RT for 1 hr. Sections were counter stained with 4 μg/mL Hoechst 33342 (Thermo Fisher) and mounted in ProLong™ Diamond Antifade Mountant (Thermo Fisher Scientific, P36970). Fluorescent images were obtained with Leica DM6 and analyzed using LAS X software (version 2.0.0.14332.2). Bright light images were obtained with a Leica DM2000 bright-field microscope.
For the measurement of GFP-LC3/RFP signal ratio, frozen sections as prepared above were washed with TBS-T 3 times and coverslips were mounted with ProLong™ Diamond Antifade Mountant. Slides were dried at 4°C overnight. Fluorescence images were obtained from at least 4 random fields/tumour with a 20x objective lens. Gray scale, raw-image files (16-bit) were analyzed using ImageJ Software to obtain mean intensities of GFP and RFP signals.
Primary human PDAC specimens (Supplementary Table 3) were generated under Institutional Review Board (IRB)-approved protocol 18–25787 at UCSF. Sections were co-stained with antibodies against CK-19 (1:300) and HLA-A,B (1:300) (Supplementary Table 1). An average of 28 ducts per sample from 9 patient specimens were imaged based on CK-19 expression to ensure analysis of tumour epithelia. The corresponding MHC-I localization per CK-19 positive ductal structure was classified as intracellular if greater than 50% of the staining displayed a non-membrane, punctate distribution.
Quantitative reverse-transcription PCR
Total RNA was extracted using TRIzol (ThermoFisher Scientific) and PureLink RNA Mini Kit (ThermoFisher Scientific), and then reversed transcribed using Superscript Vilo IV (ThermoFisher Scientific) with oligo-dT primers. Quantitative PCR was performed with SYBR Green Supermix (Bio-rad) on the CFX96 real-time PCR machine (Bio-Rad). The quantity of mRNA was calculated using ΔCT method and normalized by the GAPDH, Actb or 36B4 genes. Sequences for qPCR primers are listed in Supplementary Table 4.
Transcriptome analysis
RNA-seq libraries were prepared using the Illumina TruSeq Stranded mRNA library preparation kit according to manufacturer’s instructions by the NYU Genome Technology Center. The libraries were pooled and sequenced as 50-base, single-end reads on an Illumina HiSeq 4000 using high output mode (v4 chemistry). The raw fastq reads were aligned to mm10 mouse reference genome using STAR aligner56. Fastq Screen was used to check for any contaminations in the samples and Picard RnaSeqMetrics was used to obtain the metrics of all aligned RNA-Seq reads. featureCounts was used to quantify the gene expression levels57. FPKM (fragments per kilobase of transcript per million fragments mapped) data were used as input for gene set enrichment analysis (GSEA)58.
Immunoblotting
Cells were lysed in Cell Lysis Buffer (Cell Signaling Technology, #9803) supplemented with protease inhibitor (Thermo Fisher Scientific, # A32953) and phosphatase inhibitor (PhosSTOP, Sigma Aldrich, #04906837001). Proteins were separated on 12% or 4–20% Mini-PROTEAN® TGX™ Precast Protein Gels by SDS PAGE electrophoresis and transferred to onto PVDF membranes (IPVH00010, EMD Millipore) or nitrocellulose membranes (GE Healthcare Amersham™ Protran™ NC Rolls, Fisher, #10600000). Membranes were blocked in 5% non-fat dry milk (Blotting-Grade Blocker, BioRad, #1706404) dissolved in TBS-T for 1 hr and incubated overnight at 4 °C with primary antibodies (Supplementary Table 1). Membranes were washed three times with TBS-T and incubated with secondary antibodies for 1 hr at room temperature: anti-rabbit IgG, HRP-linked (Cell Signaling Technology, #7074), anti-mouse IgG, HRP-linked (Cell Signaling Technology, #7076). Images were obtained by chemiluminescence (Bio-rad 1705061) using a ChemiDoc (Bio-Rad).
Statistical analysis
Statistical analysis was performed using Graphpad Prism 7.0 (GraphPad). Results are expressed as mean +/− standard deviation unless otherwise indicated. For each box-and-whisker plot, centerline is the median and whiskers represent the minimum and maximum values.
Reporting summary
Further information on research design is available in the Nature Research Reporting Summary linked to this paper.
Data availability
RNA-seq data are deposited to the Gene Expression Omnibus (GEO) data repository with accession number GSE145766. Source Data are provided for all experiments. Other data that support the findings of this study are available on request from the corresponding author upon reasonable request.
Extended Data
Extended Data Figure 1 |. Heterogeneous distribution of MHC-I in KRas mutant cancers.
a, Immuno-isolation of intact lysosomes from HPDE and PDAC cell lines showing absence of non-lysosome markers as indicated. EE, early endosome; mito, mitochondria; ER, endoplasmic reticulum; lyso, lysosome. b, High power images showing MHC-I positive / LAMP1 positive (arrowheads), MHC-I positive / LAMP1 negative (arrows) and MHC-I negative / LAMP1 positive (asterisk) puncta. Scale bar, 5 μm. c,d, Localization of MHC-I (green) relative to LAMP1 (red) positive lysosomes (BEAS-2B, n = 14; A549, n = 17; H441, n = 15; H358, n = 13; HCT116, n = 13) (c) or LC3B (red) positive autophagosomes (BEAS-2B, n = 18; A549, n = 17; H441, n = 20; H358, n = 12; HCT116, n = 15) (d) in the indicated cell lines. Graphs show quantification of percentage co-localization. Cell lines indicated in red show significantly increased co-localization relative to BEAS-2B cells while cell lines indicated in blue show a modest increase (H358) or no difference (HCT116). Data are mean ± s.d. (c,d). Scale bar, 20 μm and 10 μm (insert). e, Flow cytometry-based analysis of surface MHC-I (H-2) in murine normal pancreas (C57Bl/6) and murine PDAC cells grown as organoids. (Top) Isotype-subtracted geometric mean fluorescence intensity (MFI). Each dot represents different animals/lines (n = 4). Data are mean ± s.e.m. (Middle) Representative flow cytometry plots. (Bottom) Representative images of organoids. f, Immunofluorescent staining images from a patient in Fig. 1g showing intracellular localization of MHC-I (green) in CK19 positive (red) ducts. Scale, 20 μm. A representative of at least two independent experiments is shown in a,b,e. P values determined by unpaired two-tailed t-tests (c-e). For gel source data of a, see Supplementary Fig. 1.
Extended Data Figure 2 |. Autophagy and lysosome inhibition restores MHC-I levels and plasma membrane localization.
a, Immunofluorescence staining of MHC-I following ATG3 knockdown. Scale, 50 μm. b, Representative flow cytometry plots for PaTu8902 cells following ATG3 (related to Fig. 2b) and ATG7 (see also panel d) knockdown. Representative plots from Fig. 2b and Extended Data Fig. 2d are shown. c, Effect of ATG7 knockdown on MHC-I (HLA-A,B,C) expression in PaTu8902 cells. d, Flow cytometry-based quantification of plasma membrane MHC-I (HLA-A,B,C) levels following ATG7 knockdown (n = 9 replicates from 3 independent experiments). e, Immunofluorescence staining of MHC-I following ATG7 knockdown. Scale bar, 50 μm. f,g, Surface MHC-I levels upon Atg3 (f) or Atg7 (g) knockdown in mouse PDAC cells. (left) Knockdown efficiency was confirmed by immunoblots. (middle) Cell surface MHC-I (H-2Kb/Db) levels measured by flow cytometry (n = 8 replicates from 2 independent experiments). (right) Representative flow cytometry plots are shown. h, Treatment of KP4 cells with 150 nM Bafilomycin A1 (BafA1), a lysosomal V-ATPase inhibitor, for the indicated times causes an increase in HLA-A,B levels. i, Flow cytometry-based quantification of plasma membrane (PM) MHC-I in the indicated cell lines following treatment with BafA1 for 16 hrs (n = 9 replicates from 3 independent experiments). j, Surface MHC-I (H-2) levels measured by flow cytometry. Murine PDAC organoids were established from Atg5+/+ and Atg5−/− KPC cells. n = 4 biological replicates. Data are representative of three independent experiments. (right) Representative flow cytometry plots. k, Effect of BafA1 treatment on the expression levels of antigen presentation machinery. l, Quantitative proteomics analysis of Panc1 cells that were treated with CQ (10 μM) for the indicated periods. n = 3 biological replicates. m, Effect of BafA1 treatment on expression levels of MHC-I in the indicated cell lines. Cell lines denoted in green show a significant change across all HLA isoforms following BafA1 treatment. n,o, Effect of ATG3 knockdown in H441 cells on total MHC-I (n) and plasma membrane MHC-I (o) as measured by flow cytometry-based quantification (n = 9 replicates from 3 independent experiments). A representative of at least two independent experiments is shown in a-c,e-h,j,k,m,n. Data are mean ± s.d. and P values determined by unpaired two-tailed t-tests (d,f,g,i,j,l,o). For gel source data of a,c,f,g,h,k,m,n, see Supplementary Fig. 1.
Extended Data Figure 3 |. Inhibition of macroautophagy, but not LAP/LANDO, restores MHC-I levels.
Knockdown of FIP200, ATG14, Atg13, and Ulk1, but not Rubicon, increased MHC-I levels in PDAC cells. a,d,g,i,k, Knockdown efficiency was confirmed by immunoblot (a,i,k) and qPCR (d,g). Data are mean ± s.d. from three biological replicates per group (d,g). a,e, Whole cell abundance of MHC-I was assessed by immunoblot. c, Immunofluorescence staining of MHC-I (green) and LAMP2 (red). Scale bar, 50 μm. b,f,h,j,l, Cell surface MHC-I levels were measured by flow cytometry (b,f, n = 9; h,j, n = 12; l, n = 16). Data are pooled from at least three independent experiments. Graphs are mean ± s.d. a-f, PaTu8902 cells (human). g-l, HY15549 cells (mouse). A representative of at least two independent experiments is shown in a,c,e,i,k. P values determined by unpaired two-tailed t-tests. For gel source data of a,e,i,k, see Supplementary Fig. 1.
Extended Data Figure 4 |. The UBA domain of NBR1 is required for interaction with MHC-I.
a, (Related to Fig. 2c) Proximity-dependent biotinylation catalyzed by the TurboID biotin ligase conjugated to the C-terminus of HLA-A and Flag (HLA-A-TrID). Following addition of biotin, TurboID catalyzes the formation of biotin-5’-AMP anhydride which enables covalent tagging of endogenous proteins with biotin within a few nanometers of the ligase. b, (Related to Fig. 2c) HLA-A-TurboID was stably expressed in KP4 cells. Cells were treated with 10 μM of exogenous biotin for 30 min. After labeling, cells were lysed and biotinylated proteins were enriched with streptavidin conjugated beads. Biotinylated proteins were detected using streptavidin-HRP (b) or with antibodies against the indicated proteins (refer to Fig. 2c). Asterisks indicates ligase self-biotinylation. c, (Related to Fig. 2e) Endogenous ubiquitylated proteins were affinity captured from PaTu8902 cells with UBQLN1 UBA conjugated beads. Treatment of affinity captured samples for 1 hr with purified Usp2-cc (+) to induce deubiquitylation leads to loss of ubiquitylation. d, (Related to Fig. 2f) PaTu8902 cells stably expressing WT NBR1 (GFP-NBR1, n = 19 fields) or lacking the UBA domain (GFP-NBR1 dUBA, n = 16 fields) were co-stained for endogenous LC3B. Graph shows quantification of percent colocalization. Centerline indicates the median and whiskers represent the minimum and maximum values. Scale, 20 μm (insert 10 μm). e, (Related to Fig. 2g) Effect of NBR1 knockdown on respective HLA-A, B, and C levels in PaTu8902 cells. Note that blotting images for NBR1 and Tubulin are the same ones as in Fig. 2g. f, Immunofluorescence staining of MHC-I following NBR1 knockdown. Scale, 50 μm. A representative of at least three independent experiments is shown in b,c,e,f. For gel source data of b,c,e, see Supplementary Fig. 1.
Extended Data Figure 5 |. Autophagy inhibition restores MHC-I expression, leading to enhanced anti-tumour T cell response in vitro.
a,b, Autophagy flux (a) and cell surface MHC-I levels (b) in PDAC cells measured by flow cytometry. Mouse PDAC cells expressing the GFP-LC3-RFP reporter and doxycycline (Dox)-inducible mTurquoise2-Atg4BC74A were grown as organoids for 8 days and treated with Dox (1 μg/ml) for the indicated hours. a, Autophagy flux represented by GFP/RFP ratio. Note that increased GFP/RFP ratio indicates reduced autophagy flux. b, Cell surface MHC-I (H-2Kb) levels. Representative flow cytometry plots were shown. Data are mean ± s.d. n = 3 biological replicates. Data are representative of at least four independent experiments. c, Fold changes of respective molecules on the cell surface quantified by flow cytometry. HY15549 cells expressing Dox-inducible mTurquoise2-tagged Atg4BC74A were grown as organoids for 8 days and treated ± Dox (1 μg/ml) for 72 hrs. Positive surface expression of each molecule was confirmed using respective isotype controls. Molecules found in immunological synapses are underlined. TFRC, transferrin receptor. Data are mean ± s.d. n = 4 biological replicates. Representative data from two independent experiments are shown. d-f, (Related to Fig. 3a,b) Mouse PDAC cells expressing OVA and carrying doxycycline (Dox)-inducible mTurquoise2-Atg4BC74A were grown as organoids and treated ± Dox (1 μg/mL) for 96 hrs. d, Autophagy inhibition was confirmed by immunoblot. mTurquoise2-Atg4BC74A or endogenous Atg4B were detected by anti-ATG4B antibody. e,f, Flow cytometry plots for H-2Kb (e) and H-2Kb-SIINFEKL (f). Representative plots from Fig. 3a,b are shown. Grey, isotype control. g, Representative flow cytometry plots of the OT-I cells co-cultured with mouse PDAC cells from Fig. 3c. h, (Related to Fig. 3c) Quantitative reverse transcription PCR (qRT-PCR) analysis of OT-I cells that were co-cultured with PDAC cells for 48 hrs. Data are mean ± s.d. n = 3 biological replicates. For g, h, Dox(+) or Dox(−) indicates that PDAC cells were grown ± Dox (1 μg/mL) before co-culture. Dox was not added in co-culture. A representative of at least three independent experiments is shown in d-g. P values determined by unpaired two-tailed t-tests (a,b,h). ****P < 0.0001. For gel source data of d, see Supplementary Fig. 1.
Extended Data Figure 6 |. Autophagy inhibition modulates anti-tumour immunity in both orthotopic tumours and liver metastasis.
a, Immunoblots showing autophagy inhibition in mSt-Atg4BC74A expressing cells. Mouse PDAC cells carrying doxycycline (Dox)-inducible mStrawberry (mSt) or mSt-Atg4BC74A (4B) were treated with Dox (1 μg/mL) for the indicated days. mSt or mSt-Atg4BC74A was detected by anti-RFP antibody. A representative of two independent experiments is shown. b-j, (Related to Fig. 3e–h) Mouse PDAC cells shown in (a) were orthotopically transplanted into syngeneic (C57Bl/6) mice. HY15549 cells (mSt, n = 8; 4B, n = 7) and HY19636 cells (n = 8 per group) were injected. b, Study design. c, Images of tumours at end point. d-g, HY19636 tumour weight (d), cell surface MHC-I levels (e) and PD-L1 levels (f) on PDAC cells and (g) tumour-infiltrating CD8+ T cells measured by flow cytometry. h,i, Representative H&E staining (h) and immunofluorescent staining (i) of HY15549 tumours (mSt, n = 8; 4B, n = 7). Scale bars, 100 μm. j, Quantification of tumour-infiltrating immune cells by flow cytometry (HY15549, n = 8 and 7; HY19636, n = 8 per group). Gating strategies are shown in Extended Data Fig. 7k and Supplementary Table 2. Treg, T regulatory cells; MDSC, myeloid-derived suppressor cells; TAM, tumour-associated macrophages. k-o, Autophagy-inhibition by Atg7 knockdown elicits similar anti-tumour T cell responses. k, Immunoblots for Atg7, LC3, and β-actin in PDAC cells (HY15549) expressing shRNAs against GFP or Atg7. A representative of at least two independent experiments is shown. l-o, Mouse PDAC cells shown in (k) were orthotopically transplanted into syngeneic mice (n = 7 per group). Images of tumours harvested on day 22 (l). Tumour weight (m). Tumour-infiltrating immune cells as measured by flow cytometry (n). Correlation between CD8+ T cell frequency among CD45+ cells and tumour weight (o). p-t, (Related to Fig. 3i–l) Autophagy inhibition modulates anti-tumour immunity in metastatic tumours in the liver. Mouse PDAC cells (HY15549) carrying Dox-inducible mSt or 4B were injected into the spleen of syngeneic (C57Bl/6) mice that were pre-fed with Dox-containing diet (n = 4 per group). PDAC cells were pre-treated with Dox (1 μg/mL) for 7 days before injection. Study design (p). Images of the liver (q). Representative images of H&E staining (r) and immunofluorescent staining (s) (n = 4 per group). Scale bars, 200 μm (r) and 100 μm (s). Quantification of immune cells in the liver metastasis as measured by flow cytometry (t). Data are mean ± s.e.m. n indicates individual mice. Statistical differences were determined by unpaired two-tailed t-tests (d-g,j,m,n,t), and Pearson correlation analysis (o). For gel source data of a,k, see Supplementary Fig. 1.
Extended Data Figure 7 |. Tumour regression upon autophagy inhibition is rescued by depletion of CD8+ T cells or ablation of cell surface MHC-I.
a-c, (Related to Fig. 3m) HY15549 cells with doxycycline (Dox)-inducible mStrawberry (mSt) or mSt-Atg4BC74A (4B) were orthotopically injected into C57Bl/6 mice and fed with Dox-containing diet starting on day 5, and then received i.p. injection of anti-CD8 or isotype control IgG (n = 7 per group). a, Study design. b, Images of tumours. c, Tumour-infiltrating leukocytes as quantified by flow cytometry. d-f, (Related to Fig. 3n,o) HY15549 cells with Dox-inducible mSt or 4B were orthotopically injected into C57Bl/6 mice (WT) or Batf3−/− mice (KO) (n = 8, 4, 8, and 5). d, Study design. e, Images of tumours. f, Quantification of tumour-infiltrating leukocytes by flow cytometry. g-j, (Related to Fig. 3p–r) HY15549 cells carrying Dox-inducible mSt or 4B were stably transfected with lentiviral vectors expressing control shRNA (shScr, solid line) or shRNA against B2m (shB2m, dashed line). g, Cell surface MHC-I as measured by flow cytometry. Cells were treated with IFN-γ (200 unit/mL) for 24 hrs before flow cytometry analysis. Representative data from three independent experiments are shown. h-j, Cells shown in (g) (4 × 10⁴ cells) were orthotopically transplanted into syngeneic (C57Bl/6) mice that were pre-fed with doxycycline diet (n = 8 per group). h, Study design. i, Images of tumours. j, Tumour-infiltrating leukocytes as quantified by flow cytometry. k, Gating strategies for flow cytometry analysis of tumours used in this study. See also Supplementary Table 2. Data are mean ± s.e.m. n indicates individual mice. P values determined by unpaired two-tailed t-tests (c,f,j).
Extended Data Figure 8 |. Separation of PDAC cells with distinct autophagy flux using the GFP-LC3-RFP reporter.
Heterogeneity in basal autophagy flux was explored using mouse PDAC cells (HY15549) expressing the GFP-LC3-RFP reporter. a,b, HY15549 cells were grown as organoids or transplanted into C57Bl/6 mice to form orthotopic tumours. a, Autophagy flux, as represented by GFP/RFP ratio, was measured by flow cytometry. Atg5−/− MEF with the GFP-LC3-RFP reporter (black) was used as a control. Representative flow plots from three independent experiments are shown. b, Representative fluorescent images of orthotopic tumours. Cells with high autophagy flux show GFP-LC3 puncta formation (inset, arrowhead) and a decrease in total GFP-fluorescent signals, displaying red appearance in the merged image. Scale bar, 100 μm. c-h, Mouse PDAC organoids were dissociated into single cells and sorted into autophagy-high (AThi) or -low (ATlo) cells according to the GPF/RFP ratio. c, Sorting strategies. d, Top KEGG pathways enriched in AThi cells compared to ATlo cells. Gene set enrichment analysis (GSEA) was performed using RNA-sequencing (RNA-seq) data from sorted AThi and ATlo cells (n = 2 and 3 biologically independent samples), showing enrichment of the autophagy-lysosome gene signatures in AThi cells as compared with the ATlo cells. FDR, false discovery rate; NES, normalized enrichment score; Nom., nominal. e,f, Relative mRNA expression of autophagy/lysosome-related genes in the respective populations sorted from pooled populations (e) or a single-cell derived clone (f). n = 3 technical replicates. Representative results from four (e) and two (f) independent sorting experiments are shown. g-i, Clonogenic potential of sorted AThi and ATlo cells (g,h) and PDAC cells with Dox-inducible Atg4BC74A (AY6284) (i). Representative data from at least two independent experiments are shown. n = 4 (g) and n = 3 (i) per group. Data are mean ± s.d. (e-i). P values determined by unpaired two-tailed t-tests (g-i).
Extended Data Figure 9 |. Basal autophagy flux determines immunogenicity of PDAC cells.
Mouse PDAC cells (HY15549) expressing the GFP-LC3-RFP reporter were sorted into AThi and ATlo cells (Extended Data Fig. 8c) and injected into the pancreas (a-g) or the spleen (h-k) of C57Bl/6 mice (a-f, h-k) or nude mice (g). Cells were sorted from pooled populations except for (b). a,b, Tumour weight on day 21. AThi and ATlo cells were sorted from either pooled populations (a) (n = 9 and 10) or a single-cell derived clone (b) (n = 10 per group). c-e, Tumours shown in (a) were analyzed. Cell surface MHC-I levels on PDAC cells measured by flow cytometry (c). Correlation between MHC-I levels on PDAC cells and tumour weight (d). Representative images of H&E (left) and immunofluorescent staining (right) (e). Scale bars, 100 μm. f, Quantification of tumour-infiltrating immune cells by flow cytometry (n = 8 per group). Orthotopic tumours harvested on day 21 were analyzed. g, Orthotopic tumours in nude mice harvested on day 19 (n = 8 and 7). h-k, Liver metastasis model. Study design (h). Weight of livers (i) and cell surface MHC-I levels on PDAC cells measured by flow cytometry (j) on day 17 (n = 5 per group). Representative immunofluorescence images of livers harvested on day 9 (n = 3 per group)(k). Frozen sections were stained with anti-CD8a antibody and DAPI. In these merged images, cells with high autophagy flux appear as red, reflecting the relative loss of GFP-fluorescence and lower GFP/RFP ratio, while cells with low autophagy flux appear as yellow to green, reflecting high GFP/RFP ratio. In the enlarged images, CD8a+ cells were indicated by white arrow heads. Scale bars, 100 μm. For a, c-f, and i-k, experiments were performed at least twice and representative data of one experiment are shown. Data are mean ± s.e.m. (a-c,f,g,i,j). n indicates individual mice. P values determined by unpaired two-tailed t-tests (a-c,f,g,i,j), and Pearson correlation analysis (d).
Extended Data Figure 10 |. Autophagy inhibition synergizes with dual ICB.
a-c, Anti-PD1 antibody treatment did not affect tumour growth in either control or autophagy-inhibited tumours. Mice bearing orthotopic PDAC tumours (HY15549) carrying doxycycline (Dox)-inducible mStrawberry (mSt) or mS-Atg4BC74A (4B) were treated with Dox beginning on day 5 and received either isotype control IgG or anti-PD1 antibody (n = 7, 8, 8 and 7 per group). Study design (a). Images (b) and weight (c) of tumours. d-g, (Related to Fig. 4a–d) Mice bearing orthotopic PDAC tumours (HY15549) expressing Dox-inducible mSt or 4B were treated with Dox beginning on day 5 and received either isotype control IgG or dual ICB (anti-PD1/CTLA4 antibodies) (n = 7 per group). Representative images of immunofluorescence staining (d) and H&E staining (e). Scale bars, 100 μm. Quantification of tumour-infiltrating immune cells by flow cytometry (f,g). h, Cell surface MHC-I (H-2Kb/Db) levels measured by flow cytometry. Mouse PDAC cells were treated with chloroquine (CQ) or Bafilomycin A1 (BafA1) at the indicated concentrations for 48 hrs (n = 4). Mouse PDAC cells were grown in 2D culture (CQ) or as organoids (BafA1). Representative results from at least three independent experiments are shown. i-m, Mice bearing orthotopic PDAC tumours expressing the GFP-LC3-RFP reporter were treated with PBS or CQ beginning on day 5 (n = 7 vs 6 for HY15549 and n = 8 vs 8 for HY19636). Study design (i). Images of tumours (j). Cell surface MHC-I and PD-L1 levels on PDAC cells measured by flow cytometry (k). Tumour weight (l). Quantification of tumour-infiltrating immune cells by flow cytometry (m). n, Representative fluorescence images of tumours expressing the GFP-LC3-RFP reporter from Fig. 4j. Numerical values represent mean fluorescent intensity of each field. o, Quantification of tumour-infiltrating immune cells by flow cytometry (n = 8, 8, 8, and 5; left to right). Tumours in Fig. 4k were analyzed. Data are mean ± s.e.m. (c,f,g,k-m,o) or ± s.d. (h). n indicates individual mice (c,f,g,k-m,o) or biological replicates (h). Except for the orthotopic implantation of HY19636 cells (j-m), all experiments were performed at least twice and representative data of one experiment are shown. P values determined by unpaired two-tailed t-tests (c,f-h,k-m,o). ****P < 0.0001.
Supplementary Material
Acknowledgements
This work was supported by National Cancer Institute Grants R01CA157490, R01CA188048, P01CA117969, R35CA232124; ACS Research Scholar Grant RSG-13-298-01-TBG; NIH grant R01GM095567; and the Lustgarten Foundation, and SU2C to A.C.K. R.M.P is the Nadia’s Gift Foundation Innovator of the Damon Runyon Cancer Research Foundation (DRR-46-17) and is additionally supported by an NIH Director’s New Innovator Award (1DP2CA216364) and the Pancreatic Cancer Action Network Career Development Award. K.Y was supported by the Uehara Memorial Foundation Research Fellowship. A.V is supported by a National Science Foundation Graduate Research Fellowship. D.E.B. is supported by a Ruth L. Kirschstein Institutional National Research Service Award, T32 CA009161 (Levy), and the NCI Predoctoral to Postdoctoral Fellow Transition Award (F99/K00) F99 CA245822. M.K. was supported by the Uehara Memorial Foundation Research Fellowship and Postdoctoral Fellowship for Research Abroad (Japan Society for the Promotion of Science). S.J.P. was supported by American Cancer Society grant 132942-PF-18-215-01-TBG. R.S.B. is a Merck Fellow of the Damon Runyon Cancer Research Foundation (DRG-2348-18).
We thank Haoqiang Ying for providing the HY19636 and HY15549 cells. We thank the New York University (NYU) Langone Health Experimental Pathology Laboratory, Flow Cytometry Core, and Genome Technology Center, each supported in part by the Cancer Center Support grant P30CA016087 at the Laura and Isaac Perlmutter Cancer Center. We thank Zahid Dewan for the technical assists on the staining of frozen sections. We acknowledge the UCSF Parnassus Flow Cytometry Core (PFCC) supported in part by the DRC Center Grant P30DK063720 for assistance generating flow cytometry data. We thank Dr. James Olzmann (UC Berkeley) for advice on ubiquitylation experiments. We thank all the members of Perera lab, Kimmelman lab, Debnath Lab and Pacold lab for helpful suggestions.
Footnotes
Competing interests
A.C.K. has financial interests in Vescor Therapeutics, LLC. A.C.K. is an inventor on patents pertaining to KRAS regulated metabolic pathways, redox control pathways in pancreatic cancer, targeting GOT1 as a therapeutic approach, and the autophagic control of iron metabolism. A.C.K. is on the SAB of Rafael/Cornerstone Pharmaceuticals. A.C.K. is a consultant for Deciphera. J.D. is on the Scientific Advisory Board of Vescor Therapeutics, LLC. The other authors declare no competing interests.
References
- 1.Rooney MS, Shukla SA, Wu CJ, Getz G & Hacohen N Molecular and genetic properties of tumors associated with local immune cytolytic activity. Cell 160, 48–61 (2015). [DOI] [PMC free article] [PubMed] [Google Scholar]
- 2.McGranahan N et al. Allele-Specific HLA Loss and Immune Escape in Lung Cancer Evolution. Cell 171, 1259–1271 e1211 (2017). [DOI] [PMC free article] [PubMed] [Google Scholar]
- 3.Rodig SJ et al. MHC proteins confer differential sensitivity to CTLA-4 and PD-1 blockade in untreated metastatic melanoma. Sci Transl Med 10, eaar3342 (2018). [DOI] [PubMed] [Google Scholar]
- 4.O’Reilly EM et al. Durvalumab With or Without Tremelimumab for Patients With Metastatic Pancreatic Ductal Adenocarcinoma: A Phase 2 Randomized Clinical Trial. JAMA Oncol, doi: 10.1001/jamaoncol.2019.1588 (2019). [DOI] [PMC free article] [PubMed] [Google Scholar]
- 5.Waddell N et al. Whole genomes redefine the mutational landscape of pancreatic cancer. Nature 518, 495–501 (2015). [DOI] [PMC free article] [PubMed] [Google Scholar]
- 6.Ryschich E et al. Control of T-cell-mediated immune response by HLA class I in human pancreatic carcinoma. Clin Cancer Res 11, 498–504 (2005). [PubMed] [Google Scholar]
- 7.Pandha H, Rigg A, John J & Lemoine N Loss of expression of antigen-presenting molecules in human pancreatic cancer and pancreatic cancer cell lines. Clin Exp Immunol 148, 127–135 (2007). [DOI] [PMC free article] [PubMed] [Google Scholar]
- 8.Pommier A et al. Unresolved endoplasmic reticulum stress engenders immune-resistant, latent pancreatic cancer metastases. Science 360, eaao4908 (2018). [DOI] [PMC free article] [PubMed] [Google Scholar]
- 9.Yang S et al. Pancreatic cancers require autophagy for tumor growth. Genes Dev 25, 717–729 (2011). [DOI] [PMC free article] [PubMed] [Google Scholar]
- 10.Yang A et al. Autophagy is critical for pancreatic tumor growth and progression in tumors with p53 alterations. Cancer Discov 4, 905–913 (2014). [DOI] [PMC free article] [PubMed] [Google Scholar]
- 11.Perera RM et al. Transcriptional control of autophagy-lysosome function drives pancreatic cancer metabolism. Nature 524, 361–365 (2015). [DOI] [PMC free article] [PubMed] [Google Scholar]
- 12.Yang A et al. Autophagy Sustains Pancreatic Cancer Growth through Both Cell-Autonomous and Nonautonomous Mechanisms. Cancer Discov 8, 276–287 (2018). [DOI] [PMC free article] [PubMed] [Google Scholar]
- 13.Cunha LD et al. LC3-Associated Phagocytosis in Myeloid Cells Promotes Tumor Immune Tolerance. Cell 175, 429–441 e416 (2018). [DOI] [PMC free article] [PubMed] [Google Scholar]
- 14.Heckmann BL et al. LC3-Associated Endocytosis Facilitates beta-Amyloid Clearance and Mitigates Neurodegeneration in Murine Alzheimer’s Disease. Cell 178, 536–551 e514 (2019). [DOI] [PMC free article] [PubMed] [Google Scholar]
- 15.Kirkin V, McEwan DG, Novak I & Dikic I A role for ubiquitin in selective autophagy. Mol Cell 34, 259–269 (2009). [DOI] [PubMed] [Google Scholar]
- 16.Branon TC et al. Efficient proximity labeling in living cells and organisms with TurboID. Nat Biotechnol 36, 880–887 (2018). [DOI] [PMC free article] [PubMed] [Google Scholar]
- 17.Kirkin V et al. A role for NBR1 in autophagosomal degradation of ubiquitinated substrates. Mol Cell 33, 505–516 (2009). [DOI] [PubMed] [Google Scholar]
- 18.Mosesson Y et al. Endocytosis of receptor tyrosine kinases is driven by monoubiquitylation, not polyubiquitylation. J Biol Chem 278, 21323–21326 (2003). [DOI] [PubMed] [Google Scholar]
- 19.Fujita N et al. An Atg4B mutant hampers the lipidation of LC3 paralogues and causes defects in autophagosome closure. Mol Biol Cell 19, 4651–4659 (2008). [DOI] [PMC free article] [PubMed] [Google Scholar]
- 20.Li J et al. Tumor Cell-Intrinsic Factors Underlie Heterogeneity of Immune Cell Infiltration and Response to Immunotherapy. Immunity 49, 178–193 e177 (2018). [DOI] [PMC free article] [PubMed] [Google Scholar]
- 21.Hildner K et al. Batf3 deficiency reveals a critical role for CD8alpha+ dendritic cells in cytotoxic T cell immunity. Science 322, 1097–1100 (2008). [DOI] [PMC free article] [PubMed] [Google Scholar]
- 22.Broz ML et al. Dissecting the tumor myeloid compartment reveals rare activating antigen-presenting cells critical for T cell immunity. Cancer Cell 26, 638–652 (2014). [DOI] [PMC free article] [PubMed] [Google Scholar]
- 23.Spranger S, Dai D, Horton B & Gajewski TF Tumor-Residing Batf3 Dendritic Cells Are Required for Effector T Cell Trafficking and Adoptive T Cell Therapy. Cancer Cell 31, 711–723 e714 (2017). [DOI] [PMC free article] [PubMed] [Google Scholar]
- 24.Dangaj D et al. Cooperation between Constitutive and Inducible Chemokines Enables T Cell Engraftment and Immune Attack in Solid Tumors. Cancer Cell 35, 885–900 e810 (2019). [DOI] [PMC free article] [PubMed] [Google Scholar]
- 25.Boj SF et al. Organoid models of human and mouse ductal pancreatic cancer. Cell 160, 324–338 (2015). [DOI] [PMC free article] [PubMed] [Google Scholar]
- 26.Sakuishi K et al. Targeting Tim-3 and PD-1 pathways to reverse T cell exhaustion and restore anti-tumor immunity. J Exp Med 207, 2187–2194 (2010). [DOI] [PMC free article] [PubMed] [Google Scholar]
- 27.Munster T et al. Hydroxychloroquine concentration-response relationships in patients with rheumatoid arthritis. Arthritis Rheum 46, 1460–1469 (2002). [DOI] [PubMed] [Google Scholar]
- 28.Karasic TB et al. Effect of Gemcitabine and nab-Paclitaxel With or Without Hydroxychloroquine on Patients With Advanced Pancreatic Cancer: A Phase 2 Randomized Clinical Trial. JAMA Oncol, doi: 10.1001/jamaoncol.2019.0684 (2019). [DOI] [PMC free article] [PubMed] [Google Scholar]
- 29.Zeh H et al. A Randomized Phase II Preoperative Study of Autophagy Inhibition With High-Dose Hydroxychloroquine and Gemcitabine/Nab-Paclitaxel in Pancreatic Cancer Patients. Clin Cancer Res, doi: 10.1158/1078-0432.CCR-19-4042 (2020). [DOI] [PMC free article] [PubMed] [Google Scholar]
- 30.Markosyan N et al. Tumor cell-intrinsic EPHA2 suppresses anti-tumor immunity by regulating PTGS2 (COX-2). J Clin Invest 130, doi: 10.1172/JCI127755 (2019). [DOI] [PMC free article] [PubMed] [Google Scholar]
- 31.Sousa CM et al. Pancreatic stellate cells support tumour metabolism through autophagic alanine secretion. Nature 536, 479–483 (2016). [DOI] [PMC free article] [PubMed] [Google Scholar]
- 32.Katheder NS et al. Microenvironmental autophagy promotes tumour growth. Nature 541, 417–420 (2017). [DOI] [PMC free article] [PubMed] [Google Scholar]
- 33.Poillet-Perez L et al. Autophagy maintains tumour growth through circulating arginine. Nature 563, 569–573 (2018). [DOI] [PMC free article] [PubMed] [Google Scholar]
- 34.Loi M et al. Macroautophagy Proteins Control MHC Class I Levels on Dendritic Cells and Shape Anti-viral CD8(+) T Cell Responses. Cell Rep 15, 1076–1087 (2016). [DOI] [PubMed] [Google Scholar]
- 35.DeVorkin L et al. Autophagy Regulation of Metabolism Is Required for CD8(+) T Cell Anti-tumor Immunity. Cell Rep 27, 502–513 e505 (2019). [DOI] [PubMed] [Google Scholar]
- 36.Starobinets H et al. Antitumor adaptive immunity remains intact following inhibition of autophagy and antimalarial treatment. J Clin Invest 126, 4417–4429 (2016). [DOI] [PMC free article] [PubMed] [Google Scholar]
- 37.Xu X et al. Autophagy is essential for effector CD8(+) T cell survival and memory formation. Nat Immunol 15, 1152–1161 (2014). [DOI] [PMC free article] [PubMed] [Google Scholar]
- 38.Lee HK et al. In vivo requirement for Atg5 in antigen presentation by dendritic cells. Immunity 32, 227–239 (2010). [DOI] [PMC free article] [PubMed] [Google Scholar]
- 39.Michaud M et al. Autophagy-dependent anticancer immune responses induced by chemotherapeutic agents in mice. Science 334, 1573–1577 (2011). [DOI] [PubMed] [Google Scholar]
- 40.Moral JA et al. ILC2s amplify PD-1 blockade by activating tissue-specific cancer immunity. Nature, doi: 10.1038/s41586-020-2015-4 (2020). [DOI] [PMC free article] [PubMed] [Google Scholar]
- 41.Ward JP, Gubin MM & Schreiber RD The Role of Neoantigens in Naturally Occurring and Therapeutically Induced Immune Responses to Cancer. Adv Immunol 130, 25–74 (2016). [DOI] [PMC free article] [PubMed] [Google Scholar]
References for Methods
- 42.Liu N, Furukawa T, Kobari M & Tsao MS Comparative phenotypic studies of duct epithelial cell lines derived from normal human pancreas and pancreatic carcinoma. Am J Pathol 153, 263–269 (1998). [DOI] [PMC free article] [PubMed] [Google Scholar]
- 43.Bardeesy N et al. Both p16(Ink4a) and the p19(Arf)-p53 pathway constrain progression of pancreatic adenocarcinoma in the mouse. Proc Natl Acad Sci U S A 103, 5947–5952 (2006). [DOI] [PMC free article] [PubMed] [Google Scholar]
- 44.Kaizuka T et al. An Autophagic Flux Probe that Releases an Internal Control. Mol Cell 64, 835–849 (2016). [DOI] [PubMed] [Google Scholar]
- 45.Zoncu R et al. mTORC1 senses lysosomal amino acids through an inside-out mechanism that requires the vacuolar H(+)-ATPase. Science 334, 678–683 (2011). [DOI] [PMC free article] [PubMed] [Google Scholar]
- 46.Abu-Remaileh M et al. Lysosomal metabolomics reveals V-ATPase- and mTOR-dependent regulation of amino acid efflux from lysosomes. Science 358, 807–813 (2017). [DOI] [PMC free article] [PubMed] [Google Scholar]
- 47.Matsuura T et al. Organoid-based ex vivo reconstitution of Kras-driven pancreatic ductal carcinogenesis. Carcinogenesis, doi: 10.1093/carcin/bgz122 (2019). [DOI] [PubMed] [Google Scholar]
- 48.Paulo JA, Gaun A & Gygi SP Global Analysis of Protein Expression and Phosphorylation Levels in Nicotine-Treated Pancreatic Stellate Cells. J Proteome Res 14, 4246–4256 (2015). [DOI] [PMC free article] [PubMed] [Google Scholar]
- 49.Biancur DE et al. Compensatory metabolic networks in pancreatic cancers upon perturbation of glutamine metabolism. Nat Commun 8, 15965 (2017). [DOI] [PMC free article] [PubMed] [Google Scholar]
- 50.Navarrete-Perea J, Yu Q, Gygi SP & Paulo JA Streamlined Tandem Mass Tag (SL-TMT) Protocol: An Efficient Strategy for Quantitative (Phospho)proteome Profiling Using Tandem Mass Tag-Synchronous Precursor Selection-MS3. J Proteome Res 17, 2226–2236 (2018). [DOI] [PMC free article] [PubMed] [Google Scholar]
- 51.McAlister GC et al. MultiNotch MS3 enables accurate, sensitive, and multiplexed detection of differential expression across cancer cell line proteomes. Anal Chem 86, 7150–7158 (2014). [DOI] [PMC free article] [PubMed] [Google Scholar]
- 52.Soares KC et al. A preclinical murine model of hepatic metastases. J Vis Exp, 51677, doi: 10.3791/51677 (2014). [DOI] [PMC free article] [PubMed] [Google Scholar]
- 53.Hirata Y et al. CD150(high) Bone Marrow Tregs Maintain Hematopoietic Stem Cell Quiescence and Immune Privilege via Adenosine. Cell Stem Cell 22, 445–453 e445 (2018). [DOI] [PMC free article] [PubMed] [Google Scholar]
- 54.Gump JM et al. Autophagy variation within a cell population determines cell fate through selective degradation of Fap-1. Nat Cell Biol 16, 47–54 (2014). [DOI] [PMC free article] [PubMed] [Google Scholar]
- 55.Gump JM & Thorburn A Sorting cells for basal and induced autophagic flux by quantitative ratiometric flow cytometry. Autophagy 10, 1327–1334 (2014). [DOI] [PMC free article] [PubMed] [Google Scholar]
- 56.Dobin A et al. STAR: ultrafast universal RNA-seq aligner. Bioinformatics 29, 15–21 (2013). [DOI] [PMC free article] [PubMed] [Google Scholar]
- 57.Liao Y, Smyth GK & Shi W featureCounts: an efficient general purpose program for assigning sequence reads to genomic features. Bioinformatics 30, 923–930 (2014). [DOI] [PubMed] [Google Scholar]
- 58.Subramanian A et al. Gene set enrichment analysis: a knowledge-based approach for interpreting genome-wide expression profiles. Proc Natl Acad Sci U S A 102, 15545–15550 (2005). [DOI] [PMC free article] [PubMed] [Google Scholar]
Associated Data
This section collects any data citations, data availability statements, or supplementary materials included in this article.
Supplementary Materials
Data Availability Statement
RNA-seq data are deposited to the Gene Expression Omnibus (GEO) data repository with accession number GSE145766. Source Data are provided for all experiments. Other data that support the findings of this study are available on request from the corresponding author upon reasonable request.


