Abstract
In this paper, we present the automatic labeling framework for sulci in the human lateral prefrontal cortex (PFC). We adapt an existing spherical U-Net architecture with our recent surface data augmentation technique to improve the sulcal labeling accuracy in a developmental cohort. Specifically, our framework consists of the following key components: (1) augmented geometrical features being generated during cortical surface registration, (2) spherical U-Net architecture to efficiently fit the augmented features, and (3) postrefinement of sulcal labeling by optimizing spatial coherence via a graph cut technique. We validate our method on 30 healthy subjects with manual labeling of sulcal regions within PFC. In the experiments, we demonstrate significantly improved labeling performance (0.7749) in mean Dice overlap compared to that of multi-atlas (0.6410) and standard spherical U-Net (0.7011) approaches, respectively (p < 0.05). Additionally, the proposed method achieves a full set of sulcal labels in 20 seconds in this developmental cohort.
Keywords: Prefrontal cortex labeling, data augmentation, spherical U-Net
1. INTRODUCTION
Cortical indentations, or sulci, have served as key phenotypical biomarkers in neuroimaging studies. The sulcal patterning of human lateral prefrontal cortex (PFC) has a protracted development with extensive individual differences that are correlated with both the functional organization of cortex, as well as cognitive skills. Their regional annotation is thus a critical step in morphological characterization and understanding. However, the high inter-subject variability of sulcal definitions, as well as their branches makes the labeling process much more challenging. Hence, a faster and cheaper labeling process necessitates an automatic framework that spans both types of variability (e.g., type of cortex and age), especially in a) association cortices that are more variable than primary sensory cortices and b) developmental cohorts within which morphological features of the sulcal patterning are still changing.
In neuroimaging, cortical surface reconstruction [1, 2] is widely used to model the 3D geometry of the cerebral cortex through triangular meshes. Specifically, sulcal region and sulcal curve extraction [3–5] techniques have been developed over the years on cortical surfaces. Nevertheless, as sulci are commonly defined based on additional labeling steps, a multi-atlas approach [6–8] is most popular in automatic sulcal labeling. This approach offers higher accuracy, as each atlas is registered to a target surface for its label propagation and fusion. In general, a multi-atlas approach performs better as more atlases are included, which, however, is computationally demanding as the number of atlases increases due to inter-subject registration.
Thanks to the current availability of enhanced computing power with GPUs and readily accessible large neuroimaging datasets, deep neural networks (DNN) permit high level abstraction and thus, increased complexity for neuroimaging processing. Specifically, convolutional neural networks (CNN) are widely adapted to image segmentation problems, which aim to preserve spatial relationships and thus, handle more complex images. However, conventional CNNs have limited ability to handle non-uniform data represented by unstructured grids or graphs (i.e., cortical surface), as CNNs are only optimized for standard Euclidean image grids. Nevertheless, with recent advances in spherical CNN architectures [9], cortical surface data can be properly handled due to inherent spherical topology of cortical surfaces. These architectures utilize spherical convolutional filters and render valid parametrizat ion in the spherical space without introducing spatial distortion on the sphere. Though these techniques can sufficiently support cortical surface data, a large collection of annotated training samples is necessary to yield practically plausible results.
In this paper, we describe an automatic framework for labeling sulci in PFC using spherical CNN. Herein, we address (1) the complex inter-variability of the cortical sulci that hinders the accuracy of traditional segmentation methods as well as (2) learning of such variability from relatively small training samples. Specifically, we propose a fully automatic framework that combines spherical U-Net and data augmentation. We augment geometric features by utilizing our recent surface registration method. In particular, we generate deformed features obtained by intermediate deformation fields after the surface registration. The key idea of data augmentation was first introduced in [10]. Although our approach has similar concepts, there are several major distinguishing features: (a) this is the first application of the spherical U-Net on cortical sulci labeling with relatively small samples, which is more challenging compared to broad lobe- or parcel-wise labeling in cortical surface parcellations and (b) this is the first time that we are applying these methods to sulcal definitions in association with cortex in a developmental cohort. Fig. 1 shows a schematic overview of the proposed framework.
Fig.1.

An overview of the proposed method. The three geometric features (iH , SD, H) for each subject are augmented by 16 times for training samples. Given the input features, cortical sulci labels are then predicted using a spherical U-Net.
2. METHODS
2.1. Data augmentation
In general, CNNs tend to offer better accuracy as sample size increases. Due to limited availability in the ground-truth data, we increase our sample size by generating artificial geometric features to address such a small sample size. The key idea of such augmentation is to generate deformed geometric features from intermediate deformation fields of cortical surface registration [10]. Here, we use our recent surface registration method that smoothly harmonizes rigid and non-rigid deformation. The deformation fields are estimated by a linear combination of spherical harmonics orthonormal basis functions, which can reconstruct deformed geometric features up to a given spherical harmonics degree. In our work, cortical surfaces are deformed for the optimal alignment with a template surface that is created in a group-wise manner. After surface registration, we generate intermediate deformed features between subject and template by increasing spherical harmonics degree l. For notational simplicity, let Dl denote the deformation field at degree l. For surface data augmentation, we generate the intermediate deformed features up to l =15 [11].
2.2. Deep learning architecture: spherical U-Net
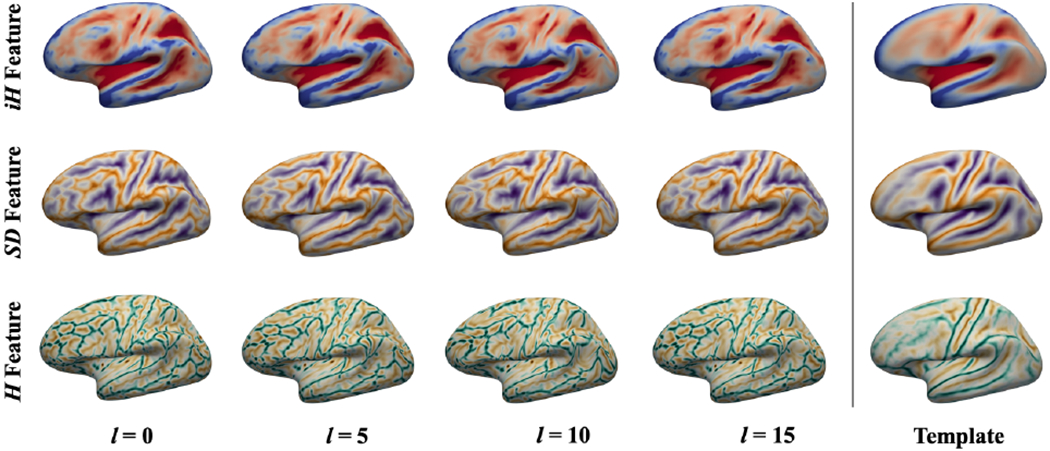
We adapt the spherical U-Net architecture [9] to annotate six cortical sulci in PFC in a developmental cohort. In this method, the parameterized differential operators [9] are used to define the convolutional kernels, which linearly combine the 1st and 2nd derivatives. This architecture shows improved performance compared to recent work on cortical surface parcellation [10]. In our framework, we create 16 deformation fields for each of the following cortical geometric features for their augmentation: mean curvature from inflated surface (iH), sulcal depth (SD) and mean curvature from cortical surface (H). These features are generally used in cortical surface registration for multiresolution optimization that captures both global and local spatial alignments [11]. Fig. 2 demonstrates examples of deformed cortical features. To augment more samples, we flip the right hemisphere, which generates 2×16 (=32) times the original sample size. These augmented features then serve as the input features (3 channels). The output of the spherical U-Net is 7 likelihoods including background for each label per vertex, and the final labels are determined by finding the maximum likelihoods.
Fig. 2.

Surface data augmentation. Mean curvature of an inflated surface (first row), sulcal depth (second row) and mean curvature of a cortical surface (third row). These features capture global and local spatial patterns of cortical folds. During data augmentation, the features are smoothly deformed via cortical surface registration with increasing spherical harmonics degree l from 0 to 15. The deformed cortical features are well aligned to their templates as degree increases.
2.3. Optimization for spatial label coherence
The spherical U-Net prediction could mislabel sulcal regions even over gyri. To enhance spatial label coherence, we employ geometric characteristics of a pial surface, where triangle size is adaptively reconstructed along sulci (small) and gyri (large) [1]. Let V denote a set of vertices of the cortical surface. Now, we consider the following two energy terms for label assignment at xi with its likelihood p(xi) and the association to its neighborhood xj:
| (1) |
| (2) |
Spatial smoothness cost is bounded between 0 and 1 and increased as two adjacent vertices are close to each other. This implies that vertices are likely located in sulcal regions and that the spatial coherence becomes more important if two vertices are close. The overall energy function is given by
| (3) |
where N(·) is a set of neighborhood and λ ∈ R+ is a scaling factor. We use a standard graph cut method [12] to optimize the energy function. In our experiments, we empirically set λ = 5. Fig. 3 shows an example result of the graph cut method.
Fig. 3.

Improved spatial coherence. The small isolated regions (circled in black) are removed after post-refinement with the proposed graph cut method. The refined result matched more closely with the ground truth sulcal labels.
3. EXPERIMENTS
3.1. Experimental setup
3.1.1. Data
Brain imaging data were collected on a Siemens 3T Trio system at the University of California Berkeley Brain Imaging Center. High-resolution Tl-weighted MPRAGE anatomical scans (TR=2300ms, TE=2.98ms, 1×1×1mm voxels) were acquired for cortical morphometric analyses. All Tl-weighted images were visually inspected for scanner artifacts. The cortical surfaces were reconstructed for each subject [13], and were visually inspected for segmentation errors and subsequently corrected if any were found. Labeling sulcal landmarks in lateral PFC were based on the most recent parcellation proposed by [14].The following 6 sulci in each hemisphere were manually defined at the individual subject level on inflated and pial surfaces: (1-2) the anterior (sfs_a) and posterior (sfs_p) components of the superior frontal sulcus, (3) the inferior frontal sulcus (ifs), (4) the central sulcus (cs), and the (5-6) superior (sprs) and inferior (iprs) precentral sulci. Locations of sulci were confirmed by 3 raters and finalized by a senior author.
3.1.2. Deep learning architecture
Both left and flipped right hemispheres were used for training, and we augmented the surface data by generating 16 deformation fields for each sample. Hence, 30 × 2 ×16 = 960 samples in total were used. We trained the data with the spherical U-Net model at level 5 of the icosahedral subdivision with vertices N = 10,242. For the training parameters, we used batch-size of 4 and initial learning rate of 0.01 with 0.9 step decay for every 20 epochs. We used cross entropy loss optimized by the Adam optimizer. Each epoch took about 2 minutes to compute on NVIDIA Titan Xp.
3.1.3. Baseline methods
We used two baseline methods: multi-atlas and standard spherical U-Net. In multi-atlas, we registered all the training samples [15] and mapped them to a single subject, and the final labels were determined by a majority vote scheme. For the standard spherical U-Net, we trained the model with only 60 samples of the left and flipped right hemispheres without data augmentation, which only took 10 seconds per epoch to train. The same parameter settings were used as those with our augmentation. For a fair comparison, we rigidly aligned spheres to the templates in the standard spherical U-Net. The proposed graph cut technique was applied to the two baseline methods.
3.2. Cross-validation
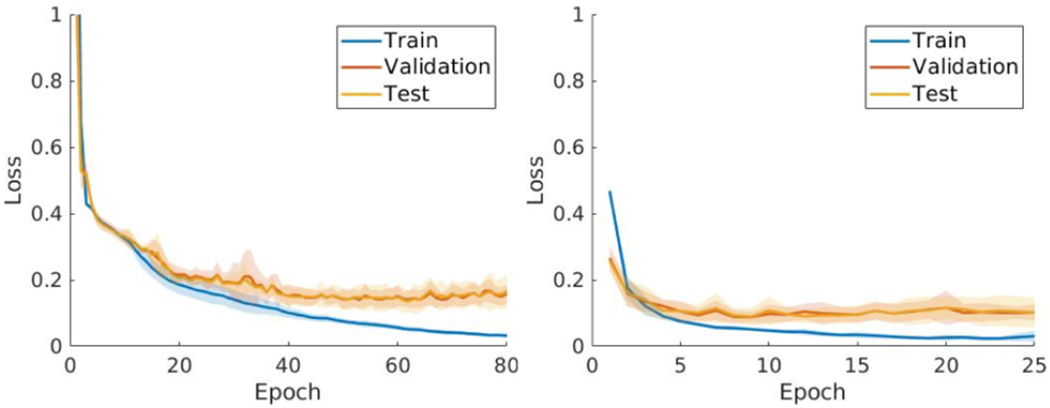
We evaluated the standard spherical U-Net and our method by 5-fold cross validation, where the samples were split into the following ratio: 60% training (36 samples, 576 samples after data augmentation), 20% validation (12 samples) and 20 % testing (12 samples). Note that data augmentation was not used for the validation or test. For each fold, we rotated the test and validation sets and used the rest of the dataset as training set. Fig. 4 shows the respective cross-entropy losses at 80 and 25 epochs for the standard spherical U-Net and proposed methods. The loss converges more quickly (before 25 epochs) in our method while achieving less errors than the baseline method (after 60 epochs). This implies that our training method with data augmentation is more stable than the standard spherical U-Net. We chose the minimum validation loss to evaluate the model performance.
Fig. 4.

Average loss after 5-fold cross validation along the training, validation and testing epochs for standard spherica U-Net (left) and our method (right). The curves represent the average of 5-fold experiments. The shaded regions represent the standard deviations at each epoch.
3.3. Comparison with existing methods
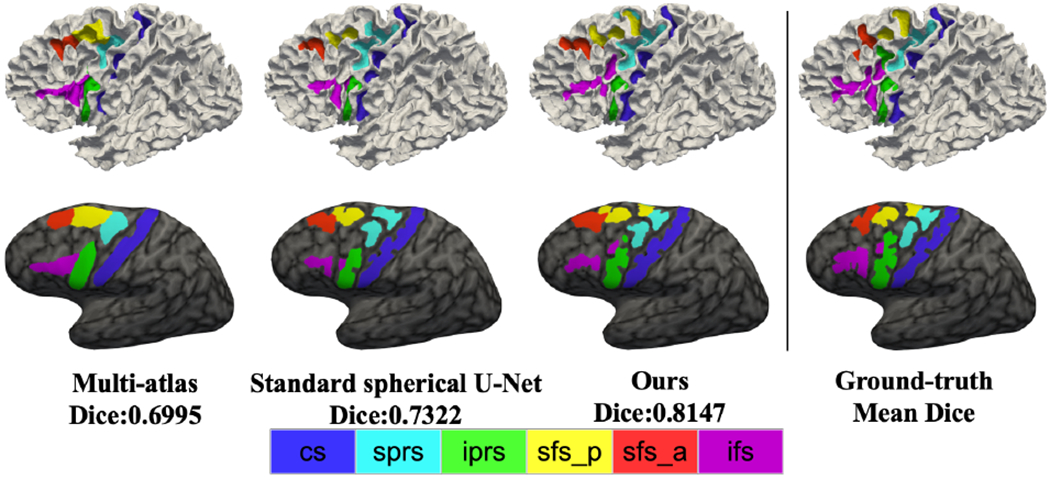
In comparisons with the two baseline methods, the mean Dice overlap was 0.6410 ± 0.0756, 0.7011 ± 0.1566 and 0.7749 ± 0.0987 for multi-atlas, standard spherical U-Net, and the proposed method. Though improvement in Dice overlap was marginal (0.0066, 0.0066, and 0.0077) after graph cut, it provides qualitative improvement (isolated region removal and spatial coherence) as shown in Fig. 3. Among these methods, ours achieved the highest average Dice overlap with statistical significance. For individual sulci, we performed paired statistical t-tests with multi-comparison correction using a false discovery rate (q=0.05) [16]. Fig. 5 illustrates the ROI-wise Dice overlap for each of the 6 sulci for the three methods. Specifically, we observed improved cortical sulcal labeling in (a) all regions compared to multi-atlas method and (b) 4 regions compared to standard spherical U-Net method. Fig. 6 demonstrates qualitative comparisons.
Fig. 5.

Dice overlap of 6 regions of multi-atlas, baseline spherical U-Net and the proposed method after multicomparison correction (FDR q = 0.05). The improved regions are represented by * (black) if improved against both, * (blue) if improved against multi-atlas.
Fig. 6.

Qualitative comparison between multi-atlas, standard spherical U-Net, our method, and ground-truth. Our method yields a better qualitative performance than the other two methods. Multi-atlas provides less accurate boundary delineation.
4. CONCLUSION
We presented a new application of an automatic framework for labeling of cortical sulci using spherical U-Net in a developmental cohort. The proposed method overcame problems of inter-variability of the cortical sulci and learning from a relatively small training sample size. To enhance the capability of the spherical U-Net with limited samples, we augmented the geometric features from the training data with their deformed features guided by the intermediate deformation fields. In the experiments, the proposed method demonstrated superior performance than multi-atlas and standard spherical U-Net methods both qualitatively and quantitatively; it is also more stable even when training with a limited sample size in this developmental cohort.
Acknowledgments
This work was supported in part by NIH R01EB017230, R01NS057156, NSF CAREER IIS 1452485, BCS1558585, VISE/VICTR VR3029, the Vanderbilt DSI-SRP, NVIDIA GPU Grant Program, the resources of the ACCRE at Vanderbilt University under 1S10OD020154-01, NCRR Grant UL1 RR024975-01, and NCATS Grant 2 UL1 TR000445-06.
5. REFERENCES
- [1].Dale AM, Fischl B, and Sereno MI, “Cortical surface-based analysis: I. Segmentation and surface reconstruction,” Neuroimage, vol. 9, no. 2, pp. 179–194, 1999. [DOI] [PubMed] [Google Scholar]
- [2].Kim JS et al. , “Automated 3-D extraction and evaluation of the inner and outer cortical surfaces using a Laplacian map and partial volume effect classification,” Neuroimage, vol. 27, no. 1, pp. 210–221, 2005. [DOI] [PubMed] [Google Scholar]
- [3].Lyu I, Kim SH, and Styner M, “Automatic sulcal curve extraction on the human cortical surface,” in Medical Imaging 2015: Image Processing, 2015, vol. 9413: International Society for Optics and Photonics, p. 94130P. [DOI] [PMC free article] [PubMed] [Google Scholar]
- [4].Kao C-Y, Hofer M, Sapiro G, Stern J, Rehm K, and Rottenberg DA, “A geometric method for automatic extraction of sulcal fundi,” IEEE transactions on medical imaging, vol. 26, no. 4, pp. 530–540, 2007. [DOI] [PubMed] [Google Scholar]
- [5].Lyu I, Kim SH, Woodward ND, Styner MA, and Landman BA, “TRACE: a topological graph representation for automatic sulcal curve extraction,” IEEE transactions on medical imaging, vol. 37, no. 7, pp. 1653–1663, 2017. [DOI] [PMC free article] [PubMed] [Google Scholar]
- [6].Shi Y et al. , “Joint sulcal detection on cortical surfaces with graphical models and boosted priors,” IEEE transactions on medical imaging, vol. 28, no. 3, pp. 361–373, 2008. [DOI] [PMC free article] [PubMed] [Google Scholar]
- [7].Lyu I et al. , “Spectral-based automatic labeling and refining of human cortical sulcal curves using expert-provided examples,” Neuroimage, vol. 52, no. 1, pp. 142–157, 2010. [DOI] [PubMed] [Google Scholar]
- [8].Mangin J-F et al. , “Sulcus identification and labeling.”
- [9].Jiang C, Huang J, Kashinath K, Marcus P, and Niessner M, “Spherical cnns on unstructured grids,” arXiv preprint arXiv:1901.02039, 2019. [Google Scholar]
- [10].Parvathaneni P et al. , “Cortical Surface Parcellation using Spherical Convolutional Neural Networks,” arXiv preprint arXiv:1907.05395, 2019. [DOI] [PMC free article] [PubMed] [Google Scholar]
- [11].Lyu I, Kang H, Woodward ND, Styner MA, and Landman BA, “Hierarchical Spherical Deformation for Cortical Surface Registration,” Medical image analysis, 2019. [DOI] [PMC free article] [PubMed] [Google Scholar]
- [12].Boykov Y and Kolmogorov V, “An experimental comparison of min-cut/max-flow algorithms for energy minimization in vision,” IEEE Transactions on Pattern Analysis & Machine Intelligence, no. 9, pp. 11–13, 2004. [DOI] [PubMed] [Google Scholar]
- [13].Wandell BA, Chial S, and Backus BT, “Visualization and measurement of the cortical surface,” Journal of cognitive neuroscience, vol. 12, no. 5, pp. 739–752, 2000. [DOI] [PubMed] [Google Scholar]
- [14].Lopez-Persem A, Verhagen L, Amiez C, Petrides M, and Sallet J, “The human ventromedial prefrontal cortex: sulcal morphology and its influence on functional organization,” Journal of Neuroscience, vol. 39, no. 19, pp. 3627–3639, 2019. [DOI] [PMC free article] [PubMed] [Google Scholar]
- [15].Fischl B, Sereno MI, and Dale AM, “Cortical surface-based analysis: II: inflation, flattening, and a surface-based coordinate system,” Neuroimage, vol. 9, no. 2, pp. 195–207, 1999. [DOI] [PubMed] [Google Scholar]
- [16].Benjamini Y and Hochberg Y, “Controlling the false discovery rate: a practical and powerful approach to multiple testing,” Journal of the Royal statistical society: series B (Methodological), vol. 57, no. 1, pp. 289–300, 1995. [Google Scholar]


