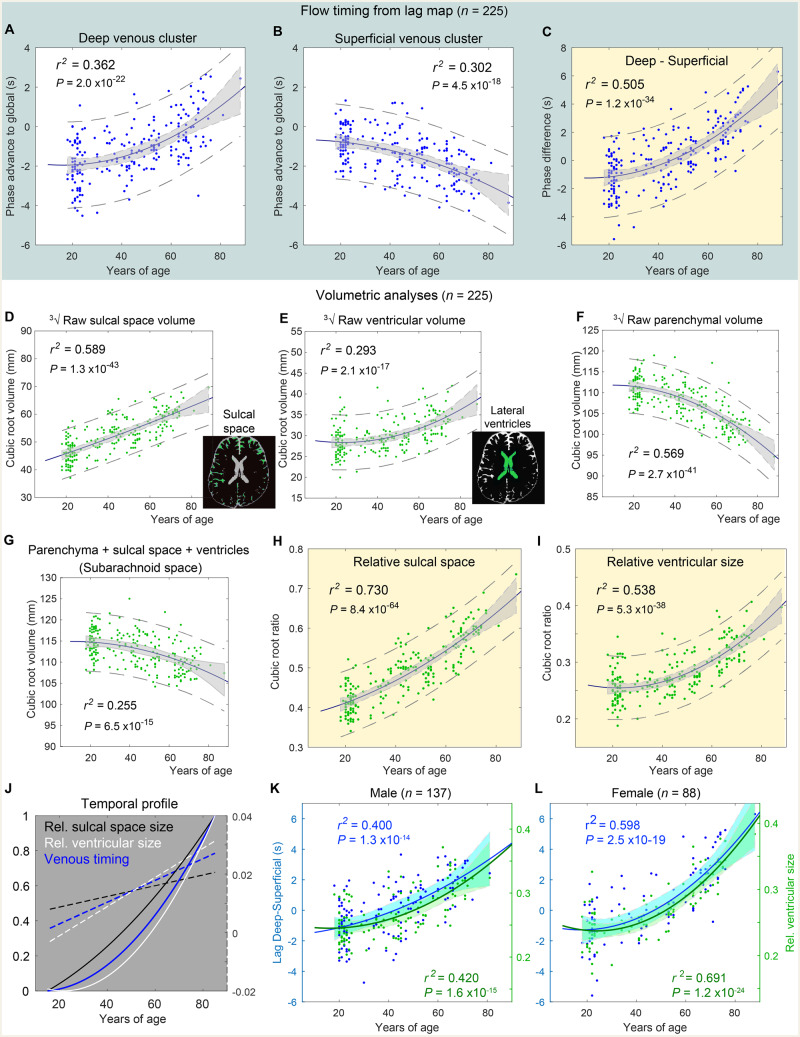
Figure 2.
Age-related changes in venous flow timing and volumetry. r2 indicates the R square of the quadratic fitting. (A and B) Individual phase advance (in seconds, positive values indicating upstream) from the clusters in Fig. 1C plotted against age. Shaded area: 95% confidence interval of the fitted curve. Dashed lines: 95% confidence interval estimated for the population. (C) Difference between the two clusters. (D–F) Cubic root of the sulcal space and the ventricular and parenchymal volumes. (G) Sum of these three measures representing the subarachnoid space. This value was used to calculate relative sulcal and ventricular sizes (H and I). (J) Temporal profiles from C, H, and I, normalized for comparison between 0 and 1. The first temporal derivatives are overlaid as dashed lines. (K and L) Temporal profiles of venous timing and ventricular size fitted separately for male and female subjects.

